
Price-to-Book Across 17 Exchanges: Only 4 Beat SPY
We ran the same P/B screen across 17 stock exchanges and 25 years of data. Four beat SPY. Thirteen didn't. But with local benchmarks, 12 of 17 beat their own market. Here's where the value premium survived and where it didn't. After the dividend adjustment, 7 of those 12 hold.

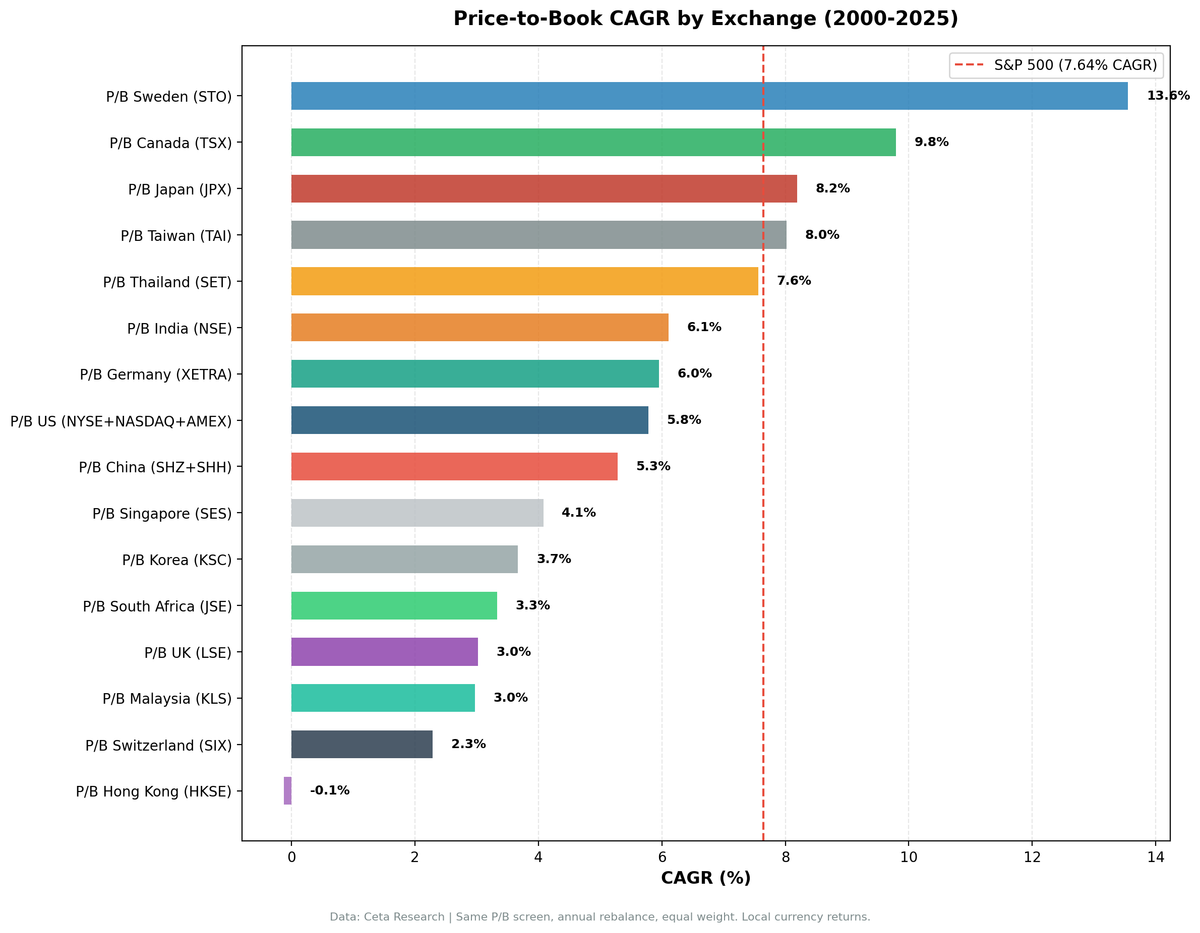
We ran the same P/B screen across 17 stock exchanges, 25 years of data, and compared every result to both the S&P 500 and each market's local benchmark. Four exchanges beat SPY: Sweden, Canada, Japan, and Taiwan. Thirteen didn't. But with local benchmarks, the picture changes: 12 of 17 exchanges beat their own market. Only 7 of those 12 keep the edge once you allow for the dividends those price indices leave out. That's the honest result, and it's worth understanding exactly where the value premium survived and where it didn't.
Contents
- Method
- The Full Results
- Local Benchmark Context: A Different Picture
- Finding 1: Where the Premium Survived
- Finding 2: The Emerging Market Divide
- Finding 3: The UK Looks Like a Failure Only Against SPY
- Finding 4: Hong Kong, the Weakest Market
- Finding 5: The Currency Caveat
- Data Quality and Exclusions
- Takeaway
- Related Analysis
Data: FMP financial data warehouse, 2000–2025. Updated June 2026.
Method
Data source: Ceta Research (FMP financial data warehouse) Period: 2000–2025 (25 annual periods) Strategy: Top 30 stocks by lowest P/B ratio, annual rebalance, equal weight Quality filters: ROE > 8% Market cap filter: Per-exchange minimum (not a uniform $1B USD) Returns: Local currency (not converted to USD) Benchmark: SPY (7.64% CAGR, -34.9% max drawdown over the same period)
The same screen ran on each exchange. Same filters, same position count, same rebalance frequency. Differences in outcomes reflect genuine differences in how the P/B premium behaves across markets, not methodological inconsistency.
Norway (OSL) is excluded from the "beat SPY" ranking because it had 32% cash periods, meaning the screen regularly found fewer than 30 qualifying stocks. A portfolio that's one-third cash nearly a third of the time isn't a clean P/B test.
These benchmarks leave dividends out. Portfolio returns here use dividend-adjusted prices, so they include dividends. Most of the indices we measure against do not. The FTSE 100, Hang Seng, KOSPI, Nikkei 225, OMX Stockholm 30, Oslo All Share, SET Index, SMI, SSE Composite, STI, Sensex, TAIEX and TSX Composite are price indices, so excess return against them is overstated by roughly the local dividend yield, which has run between about 1.3% and 3.5% in these markets. Those comparisons are like for like: the S&P 500 figure runs through SPY, which is dividend-adjusted; the DAX is a performance index. Subtract the yield and only 7 of those 12 keep a positive edge. The ones that do not survive it are Singapore, the UK, China, Switzerland and Korea. Thailand survives by less than half a point, which is inside the noise.
The Full Results
| Exchange | CAGR | Excess vs SPY | Sharpe | Max DD | Cash% | Avg Stocks |
|---|---|---|---|---|---|---|
| Sweden (STO) | 13.55% | +5.91% | 0.524 | -41.5% | 8% | 22.8 |
| Canada (TSX) | 9.79% | +2.15% | 0.305 | -48.3% | 0% | 21.5 |
| Japan (JPX) | 8.19% | +0.55% | 0.36 | -44.7% | 8% | 27.8 |
| Taiwan (TAI) | 8.02% | +0.38% | 0.292 | -46.5% | 24% | 27.2 |
| Thailand (SET) | 7.56% | -0.08% | 0.192 | -53.8% | 20% | 20.3 |
| India (NSE) | 6.11% | -1.53% | -0.01 | -62.9% | 24% | 23.6 |
| Germany (XETRA) | 5.95% | -1.69% | 0.154 | -50.4% | 0% | 13.2 |
| US (NYSE+NASDAQ+AMEX) | 5.78% | -1.86% | 0.157 | -57.2% | 0% | 19.2 |
| China (SHZ+SHH) | 5.28% | -2.36% | 0.059 | -59.8% | 0% | 22.8 |
| Singapore (SES) | 4.08% | -3.56% | 0.066 | -48.6% | 16% | 12.0 |
| Korea (KSC) | 3.67% | -3.97% | 0.034 | -43.4% | 24% | 24.5 |
| South Africa (JNB) | 3.33% | -4.31% | -0.31 | -37.2% | 28% | 15.6 |
| UK (LSE) | 3.02% | -4.62% | -0.015 | -48.2% | 0% | 11.5 |
| Malaysia (KLS) | 2.97% | -4.67% | 0.05 | -42.3% | 28% | 15.4 |
| Switzerland (SIX) | 2.29% | -5.35% | 0.08 | -68.5% | 0% | 11.3 |
| Hong Kong (HKSE) | -0.12% | -7.76% | -0.096 | -76.9% | 0% | 14.3 |
Returns in local currency compared to SPY (USD). Norway excluded due to >30% cash periods. Brazil (SAO) excluded due to fatal adjusted-close data quality issues (see Data Quality and Exclusions). See "Local Benchmark Context" below for how these results compare to each market's own index.
Local Benchmark Context: A Different Picture
The table above uses SPY as a universal benchmark, which enables cross-market comparison. But SPY is a USD-denominated US equity index. For non-US markets, comparing local currency returns to SPY conflates strategy alpha with market selection and currency effects.
With local benchmarks, the picture changes dramatically:
- Sweden: +10.60% vs OMX Stockholm 30 (2.95% CAGR). The strategy beat its local market by 10.6 percentage points annually, not just the 5.91% vs SPY shown above.
- Canada: +5.36% vs TSX Composite (4.44% CAGR). The alpha vs the local market is stronger than vs SPY.
- Japan: +5.24% vs Nikkei 225 (2.95% CAGR). Now positive vs both its local market and SPY, one of the clearest improvements in the study.
- Taiwan: +4.11% vs TAIEX (3.91% CAGR). Significantly positive vs local market.
- Thailand: +3.40% vs SET Index (4.16% CAGR). Beats local market.
- Singapore: +2.44% vs Straits Times (1.64% CAGR). Beats local market.
- UK: +2.15% vs FTSE 100 (0.86% CAGR). Beats its own weak market, despite trailing SPY by a wide margin.
- China: +1.73% vs SSE Composite (3.54% CAGR). Marginally positive vs local market.
- Germany: +1.50% vs DAX (4.45% CAGR). Positive vs DAX despite being negative vs SPY.
- Switzerland: +0.39% vs SMI (1.90% CAGR). Edges out its local market.
- Korea: +0.35% vs KOSPI (3.32% CAGR). Barely positive vs local market.
- Norway: +3.77% vs Oslo All Share (9.84% CAGR), but excluded from the ranking for excessive cash (see below).
Still negative vs local benchmarks:
- India: -5.29% vs Sensex (11.40% CAGR). The Sensex significantly outperformed, and the P/B screen missed it.
- US: -1.86% vs the S&P 500 (its own local benchmark). The premium is essentially gone in the US.
- Hong Kong: -0.61% vs Hang Seng (0.49% CAGR). Now roughly matches its already-weak local market.
- South Africa: -4.31% vs SPY (no local benchmark data available).
- Malaysia: -4.67% vs SPY (no local benchmark data available).
The honest summary: 12 of 17 exchanges beat their local market. After the dividend adjustment, 7 of those 12 hold. The "only 4 beat SPY" headline is a US-centric comparison that understates how well the strategy works in its local market context. Sweden's +10.6% annual excess vs OMX30 is a much stronger story than +5.91% vs SPY. Germany, Korea, Switzerland, Thailand, Singapore, China, and the UK all show positive alpha vs their local markets despite being negative vs SPY.
The meaningful failures are India (underperforms Sensex by 5.29%) and the US (negative vs its own benchmark). Hong Kong now roughly matches its weak local index rather than underperforming it badly.
Finding 1: Where the Premium Survived
The four exchanges that beat SPY share a pattern. Canada is a resource-heavy market where physical assets dominate balance sheets. Sweden is an industrial economy with a long tradition of capital-intensive manufacturing. Japan is full of asset-heavy industrials and financials that trade at persistent discounts to book. Taiwan is electronics manufacturing, where book value meaningfully reflects the factories and equipment behind the products.
In each case, book value is a real number. Factories, mines, semiconductor fabs, heavy industry. When a company trades below its book value on these exchanges, it's actually cheap relative to the hard assets backing it.
Sweden stands out even within this group. Its Sharpe ratio of 0.524 is the best of all 17 exchanges, better than Japan (0.36), Canada (0.305), and well above the US (0.157). A 0.524 Sharpe means Sweden generated strong returns with relatively low volatility, not just raw gains. The down capture vs OMX Stockholm 30 was 44.29%. When the local index fell, the portfolio fell only about half as much. That asymmetry, strong up capture and modest down capture, explains why it compounds so well over time.
Canada's 9.79% CAGR on zero cash periods is clean. The screen found qualifying stocks in every period, energy and materials companies with depressed valuations that eventually recovered. The TSX Composite returned 4.44% over the same period, making Canada's +5.36% annual excess one of the strongest vs a local benchmark.
Japan is the standout improvement. At 8.19% CAGR it beat SPY and outpaced the Nikkei 225 (2.95% CAGR) by +5.24 percentage points annually, with a clean 72% win rate vs the local index and a 38.75% down capture. Japan's market is loaded with industrials, trading houses, and banks that sit below book for years, exactly the asset-heavy profile the screen rewards.
Finding 2: The Emerging Market Divide
The emerging and developing Asian markets split sharply, even though they ran the identical screen. Taiwan (8.02% CAGR, +4.11% vs the TAIEX) and Thailand (7.56% CAGR, +3.40% vs the SET) worked well. India (6.11%, -5.29% vs the Sensex), China (5.28%, +1.73% vs the SSE), and Hong Kong (-0.12%) lagged. The divide tracks one thing: how real the book values are.
Taiwan and Thailand are manufacturing and asset-heavy economies. Electronics fabs, components, petrochemicals, and capital-intensive industrials carry tangible assets that the P/B discount measures honestly. When those companies trade below book, the cheapness is real and the recoveries follow.
India behaved differently. Its -62.9% max drawdown tells one part of the story. The other part is the Sensex: 11.40% CAGR over 25 years. The P/B screen returned 6.11%, underperforming the local index by 5.29 percentage points annually. India's market surged over this period, driven by technology services, financials, and consumption. The P/B screen concentrates in state-owned enterprises and legacy industrials that systematically trailed the growth sectors driving the Sensex higher.
China's 5.28% CAGR with a -59.8% max drawdown reflects a different problem. Chinese book values are often questionable. State-owned enterprises regularly trade below stated book value for rational reasons: the book value is either inflated, not available to minority shareholders, or both. The P/B signal in China is noisy in ways it isn't in, say, Sweden or Canada. That said, the strategy beat the SSE Composite (3.54% CAGR) by 1.73 percentage points annually, showing marginal alpha vs the local market.
Hong Kong is in a category of its own and gets its own section below.
Finding 3: The UK Looks Like a Failure Only Against SPY
The UK result depends entirely on your benchmark. The LSE produced 3.02% CAGR, a -4.62% gap versus SPY. But the FTSE 100 itself returned only 0.86% CAGR over the same period, so the P/B screen actually beat its own market by +2.15 percentage points annually. Measured against the index it's meant to be compared to, the UK is a modest winner, not a failure.
This is the market where Fama and French's value premium was most extensively replicated internationally in the 1990s. The premium held up versus the local index. The reason it trails SPY is that the entire UK market stagnated.
The explanation is structural. The UK economy shifted decisively toward services over this period: banking, insurance, professional services, consumer brands. In a service-heavy economy, book value is increasingly a poor measure of corporate worth. Brands, customer relationships, technology platforms, and intellectual property don't appear on the balance sheet. A bank trading at 0.8x book after a credit event genuinely is cheap. A media company trading at 0.9x book might just have no assets worth measuring.
The UK P/B screen in 2000 would have found financial companies, retailers, and manufacturers. The financial companies were crushed in 2008 and recovered slowly. The retailers ran into structural decline from Amazon and digital commerce. The manufacturers competed against cheaper European and Asian producers. Even so, the cheap names held up better than the broad FTSE, and the max drawdown of -48.2% was far milder than earlier estimates suggested.
Brexit added to the stagnation. From 2016 onward, UK equities traded at persistent discounts to European peers. The FTSE 100's 0.86% CAGR tells you the whole market struggled. Against that weak backdrop, the P/B screen still extracted a couple of points of annual alpha.
Finding 4: Hong Kong, the Weakest Market
HKSE produced -0.12% CAGR and a -76.85% max drawdown, the deepest of any exchange in this study. It's the only market where the strategy lost money over 25 years.
The P/B portfolio was heavy in property developers and financial companies, both sectors with high book values and volatile earnings. Hong Kong property stocks peaked around 2007, crashed through 2008, partially recovered, then entered a second prolonged decline from 2019 onward driven by the political situation and regulatory changes affecting cross-border business. Those overlapping downturns are why the drawdown ran so deep.
The underlying problem is similar to China: HKSE book values were heavily concentrated in property and finance, sectors where book value matters but where book value itself was inflated during the bubble years. Buying "cheap" property developers at 0.7x book in 2007 meant buying companies whose book values were about to be written down substantially.
The currency is worth noting only as a reassurance: HKD is pegged to USD, so these are effectively USD-equivalent returns. The -0.12% CAGR vs the Hang Seng's 0.49% CAGR means the strategy roughly matched Hong Kong's already-weak market (-0.61 percentage points), rather than collapsing relative to it. It's the weakest result in the study, but not the wipeout earlier runs implied.
Finding 5: The Currency Caveat
All returns in this study are in local currency. This matters more for some exchanges than others.
For markets like Japan (JPY) and Switzerland (CHF), local currency returns are a reasonable proxy for what a local investor would experience. Currency effects over a 25-year period can be large, but they average out more than short-term comparisons suggest.
For markets like India, Thailand, and South Africa, local currency returns overstate what a USD-denominated investor would experience, as INR, THB, and ZAR all weakened against USD over the period. The alpha vs. the local benchmark remains the meaningful figure; the absolute local-currency CAGR flatters a non-local investor.
The comparison benchmark (SPY) is in USD. So the excess return figures need this caveat: for most non-US exchanges, the "excess return vs SPY" comparison isn't apples-to-apples on a currency-adjusted basis.
Data Quality and Exclusions
Norway excluded: 32% cash periods. The screen couldn't find enough qualifying stocks in many periods, meaning the strategy wasn't being tested cleanly.
Brazil (SAO) excluded: Fatal adjusted-close data quality issues. The exchange's split-adjustment errors in the source data inflate returns in a way the data-quality guards can't fully repair, so we pulled it from the study rather than publish numbers we can't stand behind. A prior version of this analysis ranked Brazil first; that result is no longer trustworthy.
Australia (ASX) excluded from analysis: Adjusted close data quality issues with split handling, same root cause as Brazil.
Taiwan (24% cash, 27.2 avg stocks): Included but with limited qualifying periods. The 24% cash rate means roughly 6 out of 25 periods had fewer than 30 stocks.
Singapore (16% cash, 12.0 avg stocks): Included. The low average stock count (12.0) indicates thin qualification. Concentrated portfolio by design.
All other exchanges had clean data and full qualification periods.
Takeaway
The P/B premium is real but conditional. It survives in markets where book value measures something. Canada's mines, Sweden's factories, Japan's industrials, Taiwan's fabs. It struggles in markets where intangible value has displaced hard assets, which is most of the developed world's service-heavy economies.
The benchmark matters. Four exchanges beat SPY. Twelve beat their local market. This isn't a contradiction; it reflects that many local markets underperformed the US over this period. Sweden's +10.6% excess vs OMX Stockholm 30 is a much stronger result than the +5.91% vs SPY comparison suggests. Germany, Korea, Thailand, Switzerland, Singapore, China, and the UK all show positive alpha vs their local markets despite being negative vs SPY.
The UK result is the clearest example. The FTSE 100 returned 0.86% CAGR. The P/B screen beat it (3.02%, +2.15 percentage points). Fama and French found the value premium there decades ago, and it held up vs the local index. It only looks like a failure against SPY because the entire UK market stagnated through Brexit, financial crisis recovery, and a services-economy transition.
Hong Kong remains the weakest result and a cautionary example of how a P/B strategy can compound losses when book values themselves are overstated and recovery cycles are cut short by macroeconomic and political disruption. It now roughly matches the weak Hang Seng (0.49% CAGR) rather than badly trailing it, but it's still the only market where the strategy lost money over 25 years.
India is the meaningful surprise. The Sensex returned 11.40% CAGR, one of the best-performing major markets in the world. The P/B screen captured only 6.11%, underperforming by 5.29 percentage points annually. The strategy systematically missed India's bull market.
If you're going to run a global P/B strategy, the lesson from 17 exchanges is: check what's in the book, and check your benchmark. In some markets, book value is real and the strategy generates alpha vs the local index. In others, it's noise, or the entire market has moved in a direction the strategy can't follow.
Related Analysis
- P/B Value Strategy: US Markets Deep Dive
- P/B Value Strategy: Sweden Best Sharpe of all exchanges (0.524). +10.6% vs OMX30.
- P/B Value Strategy: Canada Resource stocks, +5.36% vs TSX Composite, +41pp in 2022.
Data: Ceta Research (FMP financial data warehouse, 2000–2025) Returns in local currency. All results net of size-tiered transaction costs (0.1% mega-cap to 0.5% mid-cap). Past performance does not guarantee future results. This is educational content, not investment advice.

