
Price-to-Book in Canada: 9.33% CAGR, 41% Down Capture, 25 Years on TSX
Canada's TSX returned 9.33% CAGR on a low P/B screen over 25 years, +4.90% annual excess vs the TSX Composite. In 2022, the portfolio gained +29% while the TSX fell -8% — the largest annual spread across all 18 exchanges we tested.

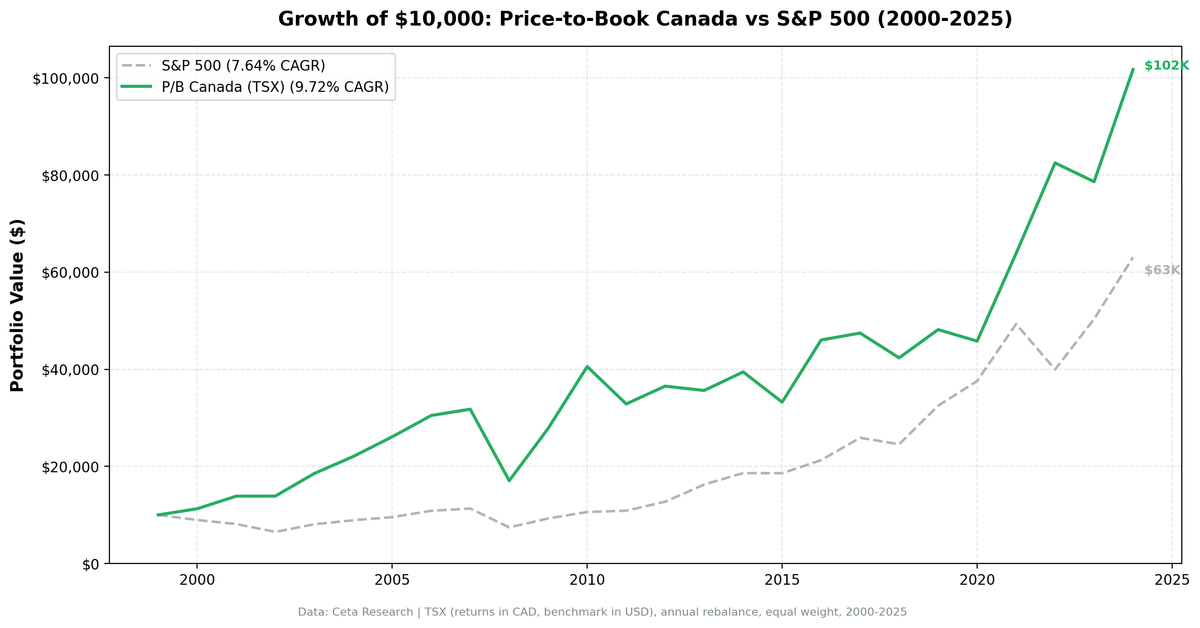
Canada's TSX delivered 9.33% CAGR on a low P/B screen from 2000 to 2025. That's 4.90% annual excess over the TSX Composite Index. The number that stands out is the down capture: 41.31% vs the local index. When the TSX Composite had a bad year, this portfolio typically held up much better. In 2022, while the TSX fell 8.44%, the Canada P/B portfolio returned +29.17%. That's a 37.6-point gap, the largest single-year relative performance of any exchange in the study.
Contents
- Method
- What Research Shows
- The Simple Screen
- The Advanced Screen
- Backtest Results
- When It Works
- When It Fails
- Sector Concentration
- Limitations
- Takeaway
- Part of a Series
- Run This Screen
- References
Canada's commodity-heavy structure made it a natural fit. Banks and resource companies dominate the TSX. They're asset-heavy businesses where book value is a real, measurable number. That's exactly the environment where P/B works.
Data: FMP financial data warehouse, 2000–2025. Updated March 2026.
Method
Data source: Ceta Research (FMP financial data warehouse) Universe: TSX (Toronto Stock Exchange), market cap above exchange threshold Period: 2000–2025 (25 years, 25 annual rebalance periods) Portfolio: Top 30 stocks by lowest P/B ratio, equal weight Rebalancing: Annual (January) Signal filters: P/B between 0 and 1.5, ROE > 8% Cash rule: Hold cash if fewer than 10 stocks qualify Average stocks per period: 23.0 Cash periods: 0 of 25 (fully invested throughout) Benchmark: TSX Composite Index (local currency). SPY used for cross-market comparison.
Currency note: Returns are in CAD (Canadian Dollar). The CAD tracked the USD closely over this period, ranging roughly between C$1.00 and C$1.45 per USD. The currency effect is modest over the full 25 years but can matter for individual years. A US-based investor would see somewhat different numbers.
What Research Shows
P/B is the original value signal in academic finance. Fama and French built their three-factor model around it in 1992, showing that high book-to-market (low P/B) stocks earned a persistent premium across multiple decades and markets. Their 1998 international study confirmed the pattern in 13 markets outside the US.
Rosenberg, Reid and Lanstein documented the US P/B premium as early as 1985, before it was mainstream knowledge. Gray and Vogel's 2012 comparison study found P/B underperformed EBIT/EV and FCF-based metrics as a standalone signal, but the premium persisted, especially in asset-heavy sectors.
The logic is straightforward. Buying below book value means paying less than the accounting value of net assets. For a bank or an oil company, where assets are real and tangible, that's a meaningful floor. For a software company with mostly intangible assets, book value is noise. Canada's sector mix (heavy on banks, energy, and mining) puts it squarely in the camp where P/B still means something.
The Simple Screen
Find every TSX stock currently trading below 1.5x book with a market cap above the exchange threshold:
SELECT
    r.symbol,
    p.companyName,
    ROUND(r.priceToBookRatioTTM, 3) AS pb_ratio,
    ROUND(k.marketCap / 1e9, 2) AS mktcap_b
FROM financial_ratios_ttm r
JOIN key_metrics_ttm k ON r.symbol = k.symbol
JOIN profile p ON r.symbol = p.symbol
WHERE r.priceToBookRatioTTM > 0
  AND r.priceToBookRatioTTM < 1.5
  AND k.marketCap > 1000000000
  AND p.exchange = 'TSX'
ORDER BY r.priceToBookRatioTTM ASC
LIMIT 30
Run this screen on Ceta Research →
This finds the cheap-on-assets names. On the TSX, the output is typically dominated by banks, insurance companies, and resource producers. You'll see Royal Bank or Scotiabank sitting near P/B 1.0–1.3 in certain years, alongside mining and energy companies after sector downturns.
The Advanced Screen
Add an ROE filter to separate genuinely cheap stocks from ones that are cheap because the business is deteriorating:
SELECT
    r.symbol,
    p.companyName,
    ROUND(r.priceToBookRatioTTM, 3) AS pb_ratio,
    ROUND(k.returnOnEquityTTM * 100, 1) AS roe_pct,
    ROUND(k.marketCap / 1e9, 2) AS mktcap_b
FROM financial_ratios_ttm r
JOIN key_metrics_ttm k ON r.symbol = k.symbol
JOIN profile p ON r.symbol = p.symbol
WHERE r.priceToBookRatioTTM > 0
  AND r.priceToBookRatioTTM < 1.5
  AND k.returnOnEquityTTM > 0.08
  AND k.marketCap > 1000000000
  AND p.exchange = 'TSX'
ORDER BY r.priceToBookRatioTTM ASC
LIMIT 30
ROE > 8% is the quality gate. A company trading at 0.8x book with 14% ROE is genuinely cheap. One trading at 0.8x book with 2% ROE may be pricing in a slow decline. The ROE filter doesn't eliminate all value traps, but it removes the worst ones.
Backtest Results
Summary metrics:
| Metric | P/B Canada (TSX) | TSX Composite |
|---|---|---|
| CAGR | 9.33% | 4.44% |
| Excess CAGR | +4.90% | — |
| Sharpe Ratio | 0.29 | — |
| Max Drawdown | -47.41% | — |
| Win Rate vs TSX | 60% (15/25 years) | — |
| Up Capture | 143.33% | — |
| Down Capture | 41.31% | — |
| Avg Stocks | 23.0 | — |
| Cash Periods | 0 / 25 | — |
For cross-market reference: the TSX Composite returned 4.44% CAGR. SPY returned 7.64% over the same period, and the Canada P/B strategy returned 9.33%, making it one of 4 exchanges globally to beat SPY.
Annual returns:
| Year | P/B Canada | TSX Composite | Excess |
|---|---|---|---|
| 2000 | +10.75% | +2.35% | +8.4pp |
| 2001 | +22.55% | -11.20% | +33.7pp |
| 2002 | +0.49% | -11.86% | +12.3pp |
| 2003 | +33.51% | +23.05% | +10.5pp |
| 2004 | +14.07% | +10.24% | +3.8pp |
| 2005 | +18.42% | +25.14% | -6.7pp |
| 2006 | +16.79% | +12.95% | +3.8pp |
| 2007 | +4.24% | +7.76% | -3.5pp |
| 2008 | -47.41% | -33.70% | -13.7pp |
| 2009 | +63.23% | +28.51% | +34.7pp |
| 2010 | +45.73% | +12.94% | +32.8pp |
| 2011 | -18.98% | -8.91% | -10.1pp |
| 2012 | +11.15% | +2.72% | +8.4pp |
| 2013 | -2.45% | +8.40% | -10.8pp |
| 2014 | +10.73% | +8.53% | +2.2pp |
| 2015 | -15.77% | -12.38% | -3.4pp |
| 2016 | +38.51% | +19.15% | +19.4pp |
| 2017 | +3.10% | +5.89% | -2.8pp |
| 2018 | -10.75% | -12.03% | +1.3pp |
| 2019 | +13.73% | +19.19% | -5.5pp |
| 2020 | -5.81% | +2.50% | -8.3pp |
| 2021 | +39.46% | +21.16% | +18.3pp |
| 2022 | +29.17% | -8.44% | +37.6pp |
| 2023 | -4.68% | +7.35% | -12.0pp |
| 2024 | +29.38% | +19.29% | +10.1pp |
When It Works
Down markets relative to local index. The 41.31% down capture is the defining feature of this backtest vs the TSX Composite. When the Canadian market had a bad year, the P/B portfolio typically held up much better. 2001 (+22.55% vs TSX -11.2%), 2002 (+0.49% vs TSX -11.86%). The early 2000s barely touched this portfolio because Canadian banks and resource companies had no exposure to US tech valuations.
Commodity up-cycles. 2009 (+63.23% vs TSX +28.51%) and 2016 (+38.51% vs TSX +19.15%) were driven by resource prices. When oil, mining, and agriculture are in a bull market, the TSX's low-P/B names ride the wave at multiples of the index return.
Value rotations. 2022 is the clearest demonstration. Energy prices spiked. Canadian oil and gas companies, which typically show up in the low-P/B screen after years of undervaluation, produced exceptional returns. The P/B portfolio gained +29.17% while the TSX fell -8.44%. A 37.6-point gap.
When It Fails
Commodity down-cycles. 2015 (-15.77% vs TSX -12.38%) and 2008 (-47.41%) are both largely commodity stories. Oil crashed in 2015. The 2008 financial crisis hit Canadian banks and energy simultaneously. The same sector concentration that protects you in good commodity years hurts in bad ones.
Local market outperformance. 2013 (-2.45% vs TSX +8.40%), 2019 (+13.73% vs TSX +19.19%), 2020 (-5.81% vs TSX +2.50%), 2023 (-4.68% vs TSX +7.35%). When the broader TSX outperforms, the concentrated P/B portfolio can lag. This happens in years when growth and diversified holdings drive the index rather than cheap value names.
The 2008 drawdown. The -47.41% max drawdown exceeds the TSX's -33.70%. Oil prices collapsed, banks were under pressure, and mining stocks were crushed. This is the honest counterweight to the defensive narrative. When the global economy falls apart and commodities crash simultaneously, this portfolio falls harder than the index.
Sector Concentration
The TSX low-P/B screen is persistently concentrated in two sectors:
Financials (banks and insurance). Canada's Big Six banks trade at low P/B multiples relative to their US counterparts. They're highly regulated, earn consistently, and maintain strong ROE. They almost always pass the P/B < 1.5 and ROE > 8% filters. In most years, banks represent 30–50% of the portfolio.
Energy and Materials. Oil sands producers, gold miners, diversified miners, and pipeline companies make up the rest. These are capital-intensive businesses where physical assets dominate the balance sheet. Book value is an actual number. When commodity cycles turn, these companies see their P/B compress and then expand dramatically.
Both sectors are cyclical. That explains the volatility (max drawdown of -47.41%) alongside the long-run alpha.
Limitations
Currency. Returns are in CAD. The Canadian dollar traded between roughly C$0.62 and C$1.10 per US dollar over this period. Long-run, the currency didn't drift dramatically. But individual years can look quite different for a USD-based investor.
Sector concentration. This portfolio is effectively a bet on Canadian banks and commodity producers. If you already own those through other positions, the P/B TSX portfolio adds less diversification than it appears.
Book value reliability. For mining and oil companies, asset writedowns are common after commodity crashes. A company with P/B 0.9 before an asset impairment may have P/B 1.3 after. Historical P/B screens may not fully capture this timing issue.
Survivorship bias. The universe uses current company profiles. Companies that delisted or went bankrupt aren't fully captured. Early-period results may be slightly optimistic.
Transaction costs. Returns are after transaction costs. Annual rebalancing of 30 stocks generates real costs, particularly for smaller-cap names in the portfolio.
Takeaway
Canada is one of the best markets we found for P/B investing. The structural reasons are clear: banks and commodity companies are the backbone of the TSX, and these are exactly the businesses where book value is a real, tangible anchor.
The 2022 result (+29.17% while the TSX fell -8.44%) is the single largest annual spread in our 18-exchange study. Down capture of 41.31% vs the TSX Composite means this portfolio historically holds up much better than the index in down years. The tradeoff is that you can miss years when growth stocks and diversified holdings drive the index.
For a CAD-based value investor who wants commodity and financial exposure with strong relative downside protection, the TSX P/B screen has a credible 25-year track record. Understand the sector concentration, account for 2008, and it's a strategy with real logic behind it.
Part of a Series
This is part of our Price-to-Book global exchange series:
- P/B in the US → (flagship, full methodology)
- P/B in Sweden →
- P/B in Canada → (this post)
- P/B in Brazil →
- Global Comparison →
Run This Screen
Via web: Run the P/B Canada screen on Ceta Research →
Via Python:
# Clone the backtest repo
git clone https://github.com/ceta-research/backtests.git
cd backtests

# Run the screen (requires CR_API_KEY)
export CR_API_KEY="your-api-key"
python3 price-to-book/screen.py --exchange TSX

# Run the backtest
python3 price-to-book/backtest.py --exchange TSX --verbose
Get your API key at cetaresearch.com.
References
- Fama, E. & French, K. (1992). "The Cross-Section of Expected Stock Returns." Journal of Finance, 47(2), 427–465.
- Fama, E. & French, K. (1998). "Value versus Growth: The International Evidence." Journal of Finance, 53(6), 1975–1999.
- Rosenberg, B., Reid, K. & Lanstein, R. (1985). "Persuasive Evidence of Market Inefficiency." Journal of Portfolio Management, 11(3), 9–16.
- Gray, W. & Vogel, J. (2012). "Analyzing Valuation Measures: A Performance Horse-Race over the Past 40 Years." Journal of Portfolio Management, 39(1), 112–121.
Data: Ceta Research (FMP financial data warehouse). Universe: TSX, 2000–2025. Annual rebalance (January), equal weight, top 30 by P/B ASC. Filters: P/B 0–1.5, ROE > 8%, market cap above exchange threshold. Returns in CAD. Benchmark: TSX Composite Index. Full methodology: METHODOLOGY.md


