
Price-to-Book in the US: The Academic Gold Standard Barely Works Anymore
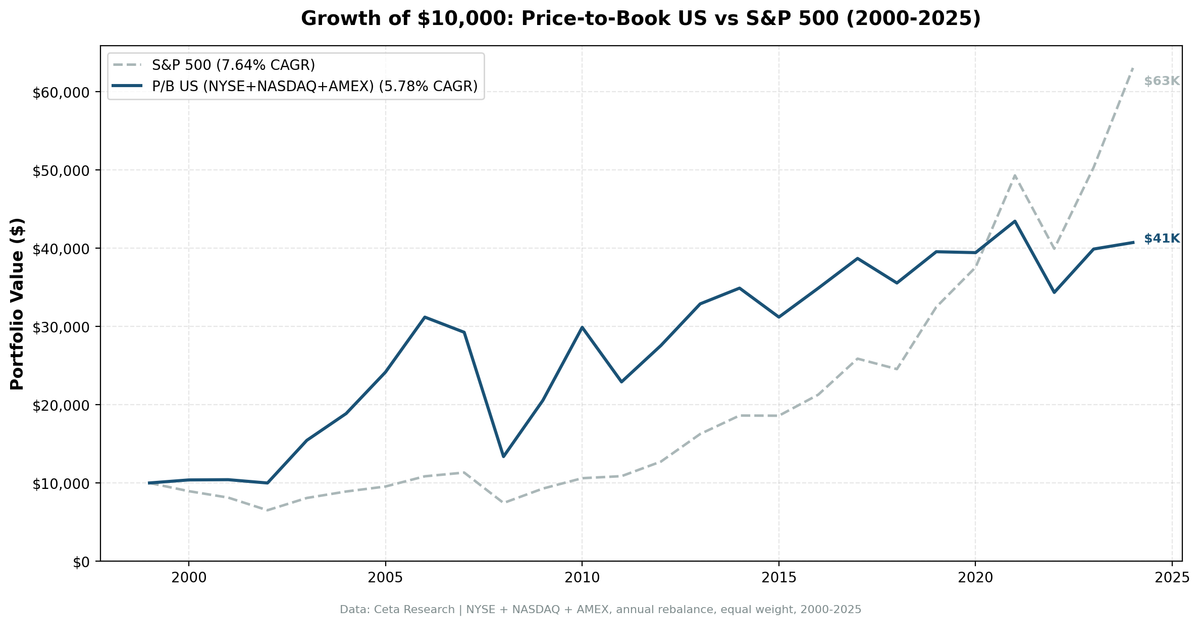
We backtested a P/B < 1.5 + ROE > 8% screen on US stocks from 2000 to 2025. 5.78% CAGR vs 7.64% for the S&P 500. The Nobel Prize-documented premium has been arbitraged away, and the old downside-protection story is gone too.

Price-to-Book is the most studied value signal in finance. Fama and French built a Nobel Prize-winning model around it. Academic research documented the premium across decades and markets. Quants have been running low P/B screens since the 1980s.
Contents
- Method
- What Research Shows
- The Simple Screen
- The Advanced Screen
- Backtest Results
- When It Works
- When It Fails
- Sector Concentration
- Limitations
- Full Annual Returns
- Takeaway
- Run It Yourself
- Part of a Series
- References
In the US from 2000 to 2025, it returned 5.78% annually vs 7.64% for the S&P 500. That's -1.87% annual underperformance over 25 years.
The story behind that number is more interesting than the headline.
Data: FMP financial data warehouse, 2000–2025. Updated June 2026.
Method
Data source: Ceta Research (FMP financial data warehouse) Universe: All US exchanges (NYSE, NASDAQ, AMEX), market cap > $1B Signal: P/B 0–1.5, ROE > 8% (from financial_ratios FY + key_metrics FY) Period: 2000–2025 (25 annual rebalance periods) Rebalancing: Annual (January), equal weight top 30 by lowest P/B Benchmark: S&P 500 Total Return (SPY) Cash rule: Hold cash if fewer than 10 stocks qualify Transaction costs: Size-tiered model (0.1% mega-cap to 0.5% mid-cap)
Historical financial data with 45-day lag to prevent look-ahead bias. Full methodology: backtests/METHODOLOGY.md
What Research Shows
The P/B premium was first documented by Rosenberg, Reid, and Lanstein in 1985. They found that high book-to-market stocks (low P/B) earned excess returns over subsequent periods. Fama and French (1992) documented the same effect across the cross-section of US returns, and their three-factor model built it into a tradable factor: HML (high-minus-low) captures the spread between value stocks (high B/M) and growth stocks (low B/M). The premium persisted across international markets, different time periods, and various methodological frameworks.
Lakonishok, Shleifer, and Vishny (1994) offered a behavioral explanation: investors systematically overpay for glamour stocks and underpay for value stocks. The correction of this mispricing generates the premium.
Gray and Vogel (2012) complicated the picture. Testing multiple valuation metrics head-to-head, they found P/B underperformed EV/EBITDA and FCF-based measures as a standalone signal. It worked, but not as well as alternatives.
More recent research suggests the premium has weakened. As economies shifted toward intangible assets (software, brands, human capital), book value became less reflective of true economic value. A software company might have a P/B of 15 and be genuinely cheap on cash flow terms. A bank at P/B 0.8 might be a trap.
The Simple Screen
This query finds every large-cap US stock currently trading below 1.5x book value.
SELECT
    r.symbol,
    p.companyName,
    p.exchange,
    p.sector,
    ROUND(r.priceToBookRatioTTM, 3) AS pb_ratio,
    ROUND(k.marketCap / 1e9, 2) AS mktcap_b
FROM financial_ratios_ttm r
JOIN key_metrics_ttm k ON r.symbol = k.symbol
JOIN profile p ON r.symbol = p.symbol
WHERE r.priceToBookRatioTTM > 0.1
  AND r.priceToBookRatioTTM < 1.5
  AND k.marketCap > 1000000000
  AND p.exchange IN ('NYSE', 'NASDAQ', 'AMEX')
  AND p.currency = 'USD'
  AND p.isFund = false
  AND p.isEtf = false
  AND p.isAdr = false
  AND p.isActivelyTrading = true
  AND p.symbol NOT LIKE '%-P%'
QUALIFY ROW_NUMBER() OVER (
    PARTITION BY p.companyName
    ORDER BY k.marketCap DESC, p.symbol
  ) = 1
ORDER BY r.priceToBookRatioTTM ASC
LIMIT 30
The filters after the exchange line are data-quality guards: they keep one actively traded common share per company and drop funds, ETFs, ADRs, and preferred share classes, which otherwise crowd the top of a raw P/B sort with near-zero accounting artifacts.
You'll notice the output is dominated by financials. Banks, insurance companies, and REITs naturally trade near or below book value because their assets are largely financial instruments marked to market. An industrial at 0.8x P/B is a different animal from a bank at 0.8x P/B.
The Advanced Screen
Adding ROE > 8% separates companies that are cheap and earning decent returns from companies that are cheap and destroying capital.
SELECT
    r.symbol,
    p.companyName,
    p.exchange,
    p.sector,
    ROUND(r.priceToBookRatioTTM, 3) AS pb_ratio,
    ROUND(k.returnOnEquityTTM * 100, 1) AS roe_pct,
    ROUND(k.marketCap / 1e9, 2) AS mktcap_b
FROM financial_ratios_ttm r
JOIN key_metrics_ttm k ON r.symbol = k.symbol
JOIN profile p ON r.symbol = p.symbol
WHERE r.priceToBookRatioTTM > 0.1
  AND r.priceToBookRatioTTM < 1.5
  AND k.returnOnEquityTTM > 0.08
  AND k.marketCap > 1000000000
  AND p.exchange IN ('NYSE', 'NASDAQ', 'AMEX')
  AND p.currency = 'USD'
  AND p.isFund = false
  AND p.isEtf = false
  AND p.isAdr = false
  AND p.isActivelyTrading = true
  AND p.symbol NOT LIKE '%-P%'
QUALIFY ROW_NUMBER() OVER (
    PARTITION BY p.companyName
    ORDER BY k.marketCap DESC, p.symbol
  ) = 1
ORDER BY r.priceToBookRatioTTM ASC
LIMIT 30
The ROE filter matters. A stock at P/B 0.9 with ROE of 3% is burning through equity. A stock at P/B 1.2 with ROE of 14% is compounding it. The backtest uses this ROE > 8% filter on FY data.
Backtest Results
| Metric | Portfolio | S&P 500 |
|---|---|---|
| CAGR | 5.78% | 7.64% |
| Max Drawdown | -57.15% | -34.90% |
| Sharpe Ratio | 0.157 | 0.322 |
| Up Capture | 95.2% | — |
| Down Capture | 95.7% | — |
| Win Rate (vs SPY) | 40% (10/25 years) | — |
| Cash Periods | 0/25 | — |
| Avg Stocks | 19.2 | — |
A $10,000 investment in January 2000 grew to ~$40,726 by end of 2025 vs ~$63,071 for SPY.
The headline is negative, and there's no consolation hiding underneath it. Up capture of 95.2% and down capture of 95.7% are almost identical. This portfolio moves with the S&P 500 in both directions and gives up about 1.9 points of return a year for the privilege. There's no defensive asymmetry to point to. The max drawdown of -57.15% is 22 points deeper than SPY's -34.90%, so the strategy is actually more fragile in the worst moments, not less.
When It Works
The value decade (2000–2006): The strategy's dominant stretch. After the dot-com bubble, the market spent years repricing fundamentals. P/B screens toward industrial, financial, and materials stocks, exactly the sectors that recovered while tech stayed suppressed.
| Year | Portfolio | S&P 500 | Excess |
|---|---|---|---|
| 2000 | +3.86% | -10.5% | +14.4pp |
| 2001 | +0.30% | -9.17% | +9.5pp |
| 2002 | -4.06% | -19.92% | +15.9pp |
| 2003 | +54.58% | +24.12% | +30.5pp |
| 2004 | +22.18% | +10.24% | +11.9pp |
| 2005 | +28.07% | +7.17% | +20.9pp |
| 2006 | +29.07% | +13.65% | +15.4pp |
Seven consecutive years of positive excess. The dot-com crash barely touched this portfolio (it gained in 2000 and 2001 and lost only 4% in 2002 while SPY shed 10-20% each year). The subsequent recovery was enormous.
Post-crisis recovery (2009–2010): +53.75% in 2009 (+29.0pp excess), +45.43% in 2010 (+31.1pp excess). When cheap stocks bounce, they bounce hard.
When It Fails
The modern era has been brutal for P/B screens in the US.
| Year | Portfolio | S&P 500 | Excess |
|---|---|---|---|
| 2008 | -54.31% | -34.31% | -20.0pp |
| 2011 | -23.33% | +2.46% | -25.8pp |
| 2015 | -10.62% | -0.12% | -10.5pp |
| 2019 | +11.24% | +32.31% | -21.1pp |
| 2020 | -0.29% | +15.64% | -15.9pp |
| 2021 | +10.19% | +31.26% | -21.1pp |
| 2024 | +2.09% | +25.28% | -23.2pp |
2008 is the critical year. The -54.31% loss tells you exactly what P/B screens hold: financials, banks, industrials. Those were the stocks at the center of the financial crisis. When book value itself becomes suspect (impaired mortgage assets, off-balance-sheet exposure), P/B 0.6 can mean the stock is still expensive relative to its true net worth.
2019, 2020, 2021, 2024 show a structural problem. The S&P 500's gains in those years were concentrated in large-cap technology companies with high or expanding P/B ratios. Microsoft, Nvidia, Apple, Meta, Google don't show up in P/B screens. They never will. A portfolio that systematically excludes them underperforms in years they dominate the index.
Sector Concentration
Low P/B screens in the US overwhelmingly select financials and industrials. These sectors have high book values (loan portfolios, plant, equipment) and often trade near or below them.
This isn't a problem in itself. But it means P/B portfolios are implicitly a bet on financial and industrial sector performance relative to technology. From 2010 to 2024, that was a losing bet in most years. The sector composition is structural, not incidental.
Energy and materials also appear when commodity prices are depressed. A steel company at P/B 0.7 when iron ore is cheap looks cheap. The P/B filter finds it. Whether the sector reprices is a separate question.
Limitations
The alpha is gone, or at least deeply cyclical. From 2000 to 2010, the strategy beat SPY in 9 of 11 years. From 2011 to 2024, it beat SPY in just 1 of 14 years. The US market's dominance by intangible-heavy technology companies means P/B screens will chronically underweight the index's best performers.
2008 risk is real. The -57.15% max drawdown is 22 percentage points deeper than SPY's. P/B screens pack the portfolio with financial stocks. Financial crises hit exactly those stocks.
Book value is accounting, not economics. A software company writes off R&D immediately. Its book value is minimal but its economic assets (code, talent, relationships) are enormous. P/B of 15 might be genuinely cheap. An industrial carrying depreciated plants on the books at cost might show P/B 0.5 but the assets are worth less in a modern economy. The ratio measures accounting equity, not replacement value.
Annual rebalancing lag. Rebalancing in January uses prior-year FY filings. The portfolio can't respond to mid-year deterioration.
Full Annual Returns
| Year | Portfolio | S&P 500 | Excess |
|---|---|---|---|
| 2000 | +3.9% | -10.5% | +14.4pp |
| 2001 | +0.3% | -9.2% | +9.5pp |
| 2002 | -4.1% | -19.9% | +15.9pp |
| 2003 | +54.6% | +24.1% | +30.5pp |
| 2004 | +22.2% | +10.2% | +11.9pp |
| 2005 | +28.1% | +7.2% | +20.9pp |
| 2006 | +29.1% | +13.6% | +15.4pp |
| 2007 | -6.2% | +4.4% | -10.6pp |
| 2008 | -54.3% | -34.3% | -20.0pp |
| 2009 | +53.8% | +24.7% | +29.0pp |
| 2010 | +45.4% | +14.3% | +31.1pp |
| 2011 | -23.3% | +2.5% | -25.8pp |
| 2012 | +20.3% | +17.1% | +3.2pp |
| 2013 | +19.3% | +27.8% | -8.4pp |
| 2014 | +6.1% | +14.5% | -8.4pp |
| 2015 | -10.6% | -0.1% | -10.5pp |
| 2016 | +11.9% | +14.5% | -2.6pp |
| 2017 | +10.9% | +21.6% | -10.7pp |
| 2018 | -8.1% | -5.1% | -3.0pp |
| 2019 | +11.2% | +32.3% | -21.1pp |
| 2020 | -0.3% | +15.6% | -15.9pp |
| 2021 | +10.2% | +31.3% | -21.1pp |
| 2022 | -21.0% | -19.0% | -2.0pp |
| 2023 | +16.2% | +26.0% | -9.9pp |
| 2024 | +2.1% | +25.3% | -23.2pp |
Takeaway
The P/B premium existed in the US. It was real from 2000 to 2010, when the screen beat SPY in 9 of 11 years. In the 15 years since, it's all but vanished: the strategy beat the index in just one year out of fourteen.
The defensive case doesn't rescue it either. Up capture (95.2%) and down capture (95.7%) are nearly identical, so the portfolio tracks the index down about as much as it tracks it up, then surrenders roughly 1.9 points of annual return on top. Worse, its deepest drawdown (-57.15%) runs 22 points below SPY's, because P/B screens load up on financials right before financial crises. There's no asymmetry to lean on.
If you're running this screen today, the strongest case is for markets outside the US, where the intangible economy is less dominant, where financials and industrials still make up a larger share of index weight, and where the P/B premium hasn't been as thoroughly arbitraged.
Run It Yourself
git clone https://github.com/ceta-research/backtests.git
cd backtests

# US backtest
python3 price-to-book/backtest.py --preset us --output results.json --verbose

# All exchanges
python3 price-to-book/backtest.py --global --output results/exchange_comparison.json

# Current screen
python3 price-to-book/screen.py --preset us
Part of a Series
This is the US analysis. We ran the same screen across 17 exchanges globally:
- Sweden analysis → Best Sharpe ratio of all exchanges (0.524). 13.55% CAGR, +10.6% vs OMX Stockholm 30.
- Canada analysis → Resource-heavy market where P/B still screens well. 9.79% CAGR, +5.36% vs TSX Composite.
- Global comparison → All 17 exchanges. Only 4 beat SPY: Sweden, Canada, Japan, Taiwan.
References
- Fama, E. & French, K. (1992). "The Cross-Section of Expected Stock Returns." Journal of Finance, 47(2), 427–465.
- Rosenberg, B., Reid, K. & Lanstein, R. (1985). "Persuasive Evidence of Market Inefficiency." Journal of Portfolio Management, 11(3), 9–16.
- Lakonishok, J., Shleifer, A. & Vishny, R. (1994). "Contrarian Investment, Extrapolation, and Risk." Journal of Finance, 49(5), 1541–1578.
- Gray, W. & Vogel, J. (2012). "Analyzing Valuation Measures: A Performance Horse-Race over the Past 40 Years." Journal of Portfolio Management, 39(1), 112–121.
- Novy-Marx, R. (2013). "The Other Side of Value: The Gross Profitability Premium." Journal of Financial Economics, 108(1), 1–28.
Data: Ceta Research (FMP financial data warehouse), 2000–2025. Universe: NYSE + NASDAQ + AMEX. Full methodology: METHODOLOGY.md. Past performance does not guarantee future results.


