
Price-to-Tangible-Book in China: 9.71% CAGR, Beta 0.11, and a +46%

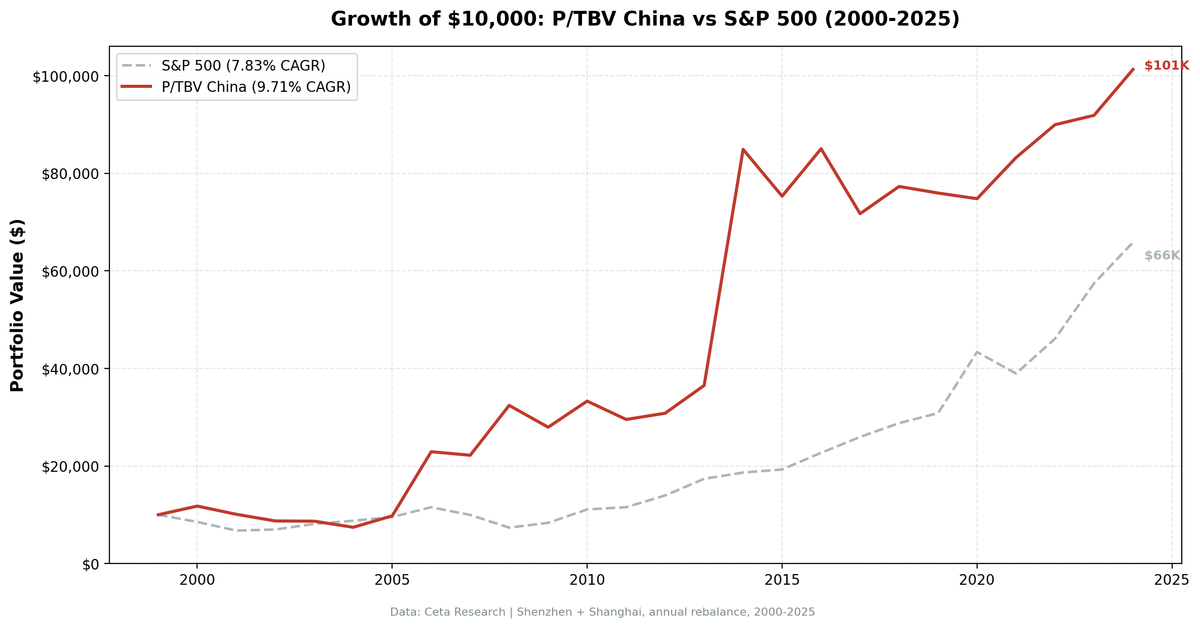
The P/TBV strategy on China's Shenzhen and Shanghai exchanges returned 9.71% annualised over 25 years against SPY's 7.83%, adding 1.88% per year with a beta of 0.113. That near-zero beta is the structural fact that defines this strategy on Chinese markets: these stocks move almost independently of the US. In 2008, while SPY lost 26.14%, China's low-P/TBV portfolio gained 46.06%. A 72-percentage-point divergence in one year isn't a fluke. It's the result of holding Chinese manufacturing stocks whose valuations are driven by domestic conditions, not Wall Street sentiment.
Contents
The Strategy
Price-to-Tangible-Book removes goodwill and intangible assets from book value before dividing into market cap: P/TBV = marketCap / (totalStockholdersEquity - goodwill - intangibleAssets). What remains captures only the physical business: land, equipment, inventory, receivables.
China's listed universe is manufacturing-heavy. Shenzhen and Shanghai are dominated by companies in industrials, basic materials, energy, and consumer goods. These businesses carry large tangible asset bases. A low P/TBV screen in China finds companies trading below their physical asset value with quality earnings, which in this market frequently means manufacturers with real pricing power and domestic demand exposure.
Quality filters prevent the strategy from buying distressed or hollow companies. We require ROE above 8%, ROA above 3%, and operating profit margin above 10%. These thresholds kept the portfolio in genuinely profitable businesses through 25 years of Chinese market cycles.
| Parameter | Value |
|---|---|
| Signal | P/TBV ascending (lowest first) |
| Quality filters | ROE > 8%, ROA > 3%, OPM > 10% |
| Rebalance | Annual (July), 45-day filing lag |
| Portfolio size | Top 30, equal weight |
| Minimum stocks | 10 (else cash) |
| Market cap threshold | ¥2B (~$276M USD) |
| Universe | Shenzhen (SHZ) + Shanghai (SHH) |
| Period | 2000-2025 (25 years) |
| Benchmark | SPY |
What We Found
The down capture of -67.38% is the largest negative of any exchange we tested. In years when SPY fell, China's tangible-book stocks didn't just preserve capital. They actively rose. The 2008 result is the most extreme example: +46.06% versus SPY's -26.14%. Chinese manufacturers were largely insulated from the US financial crisis. Their earnings came from domestic demand and export contracts priced before the crisis. Their tangible book values didn't collapse alongside US mortgage-backed securities. While global markets priced in systemic financial failure, low-P/TBV Chinese industrials simply kept earning.
The beta of 0.113 explains why. These stocks trade on domestic Chinese growth cycles, retail investor sentiment in A-share markets, and policy stimulus. They don't respond meaningfully to Fed rate decisions or US credit events. Adding them to a US-heavy portfolio genuinely reduces portfolio-level correlation. This is real diversification, not paper diversification.
The two bull market episodes are captured cleanly. In 2006, the strategy returned +134.59%. The China A-share boom was driven by real earnings growth in manufacturing as Chinese exporters benefited from commodity and consumer goods demand. Low P/TBV filtered out speculative names and kept the portfolio in manufacturing and industrial stocks that had the earnings to justify the re-rating. In 2014, +132.61% as a second bull wave driven by domestic retail flows and policy support hit the same kinds of names again.
The Sharpe ratio of 0.184 looks low but needs context. China's risk-free rate (government bond yield) is 2.5%, which means the excess return calculation is less penalised by the rate assumption. Compared to domestic Chinese investment alternatives at the same risk level, this strategy looks considerably stronger than the raw Sharpe suggests.
The recent period from 2020 to 2023 tells a warning story. Returns were flat to negative: -1.53% in 2020, -1.74% in 2019 (the year prior), +11.27% in 2021, +8.10% in 2022, +2.13% in 2023. China's property sector crisis after 2021 is part of the explanation. Property-related companies and their suppliers carried large tangible book values on their balance sheets, largely in land and construction assets. As property values collapsed, low P/TBV signals pointed at companies whose tangible base was actively deteriorating. The strategy doesn't know that land values are falling until the financials are restated. This is a genuine structural risk for tangible-book strategies in markets with large property sector exposure.
China averaged 25.4 stocks per period with zero cash years. The universe is large enough that the quality screen always found sufficient qualifying companies.
Annual Returns
| Year | Strategy | SPY |
|---|---|---|
| 2000 | +17.73% | -14.78% |
| 2001 | -14.26% | -20.77% |
| 2002 | -13.56% | +3.29% |
| 2003 | -0.57% | +16.44% |
| 2004 | -14.36% | +7.94% |
| 2005 | +31.52% | +8.86% |
| 2006 | +134.59% | +20.95% |
| 2007 | -3.15% | -13.71% |
| 2008 | +46.06% | -26.14% |
| 2009 | -13.81% | +13.42% |
| 2010 | +19.16% | +32.94% |
| 2011 | -11.31% | +4.10% |
| 2012 | +4.34% | +20.85% |
| 2013 | +18.47% | +24.50% |
| 2014 | +132.61% | +7.38% |
| 2015 | -11.30% | +3.36% |
| 2016 | +12.90% | +17.73% |
| 2017 | -15.65% | +14.34% |
| 2018 | +7.78% | +10.91% |
| 2019 | -1.74% | +7.12% |
| 2020 | -1.53% | +40.68% |
| 2021 | +11.27% | -10.17% |
| 2022 | +8.10% | +18.31% |
| 2023 | +2.13% | +24.60% |
| 2024 | +10.25% | +14.67% |
The Current Screen
The US screen is available at cetaresearch.com/data-explorer?q=z9gpaUlNfi. Exchange-specific queries for Shenzhen and Shanghai can be run directly on the data explorer at cetaresearch.com.
Limitations
The bull market years of 2006 and 2014 (+134% and +133%) dominate the CAGR calculation. Without those two years, the compound return is substantially lower. These aren't regular market cycles. They were policy-driven retail investor waves that hit the same types of stocks the strategy naturally holds. Don't extrapolate them as a recurring feature.
Property sector risk is real and ongoing. After 2021, tangible-book signals in property-adjacent companies pointed at deteriorating assets dressed up in old balance sheet values. The filing lag means the strategy rebalances on financials that may already be outdated when property values are moving fast.
Foreign access to A-share markets is constrained. Shenzhen and Shanghai are accessible to foreign investors through the Stock Connect programs, but position limits, repatriation rules, and currency management (CNY isn't freely convertible) create friction that doesn't appear in backtest returns. A USD-based investor faces CNY/USD exposure in addition to equity risk.
The near-zero beta cuts both ways. When China's domestic market underperforms for extended periods, as it has since 2021, the strategy provides no correlation to US recovery. That independence is a feature in US downturns and a cost in US upturns.
Part of a Series
This post is part of a multi-exchange series on the Price-to-Tangible-Book strategy. The US flagship backtest, including full methodology and global results summary, is at ptbv-strategy-us-backtest.
Data: Ceta Research (FMP financial data warehouse), 2000-2025. Full methodology: backtests/METHODOLOGY.md


