
Hard Assets, Bigger Returns: P/TBV in India (2000-2025)

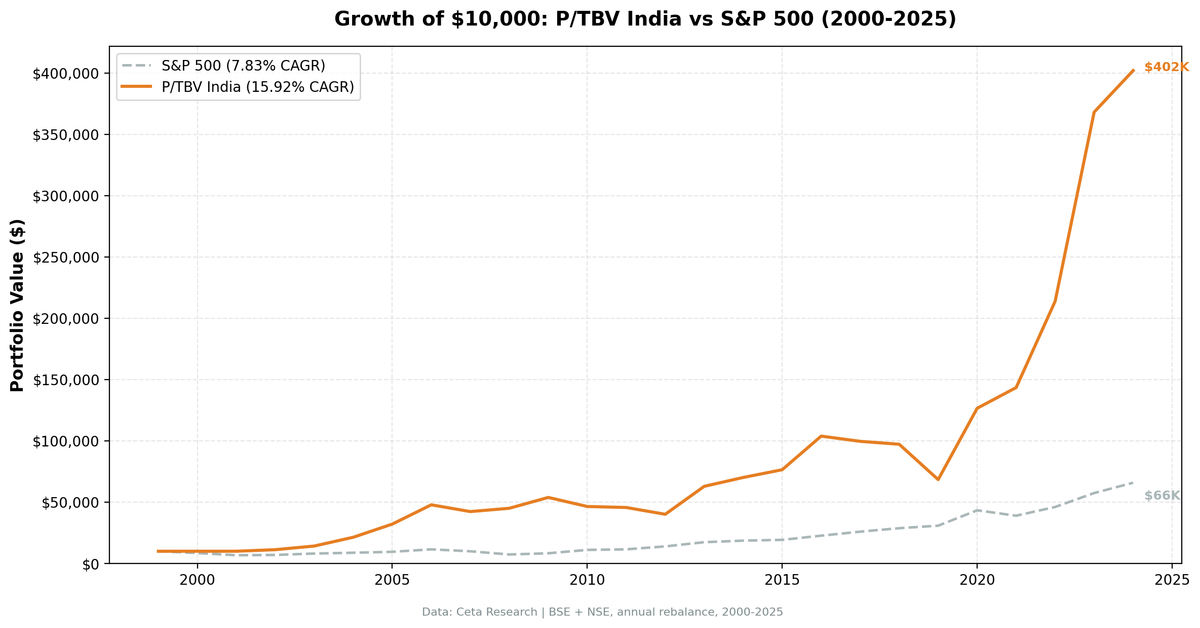
India's equity market is built on physical capital. Steel, cement, chemicals, engineering, infrastructure. The companies that dominate the BSE and NSE have accumulated decades of tangible assets on their balance sheets, and markets have persistently underpriced them relative to book. A P/TBV screen on Indian large-caps returned 15.92% CAGR over 25 years versus 7.83% for SPY. The down-capture ratio was -9.57%, which means the strategy gained ground during years when SPY fell.
Contents
- Part of a Series
- The Strategy
- Why India and P/TBV Fit
- What We Found
- Annual Returns
- The Current Screen
- Limitations
Part of a Series
This post covers the India results. For full methodology, parameter rationale, and the US results (10.03% CAGR, 10.71% down capture), see the US backtest.
The Strategy
P/TBV strips goodwill and intangibles from book value, leaving only physical assets net of liabilities:
P/TBV = Market Cap / (Total Stockholders' Equity − Goodwill − Intangible Assets)
The quality filters prevent buying distressed or capital-destroying companies:
| Parameter | Value |
|---|---|
| Signal | P/TBV ascending (lowest = cheapest) |
| Quality filters | ROE > 8%, ROA > 3%, OPM > 10% |
| Rebalance | Annual, July (45-day filing lag) |
| Selection | Top 30 by P/TBV, equal weight |
| Minimum stocks | 10 (else hold cash) |
| Market cap floor | ₹20B (~$240M USD) |
| Universe | BSE, NSE |
| Period | 2000-2025 (25 years) |
| Benchmark | SPY |
Why India and P/TBV Fit
In the US, the largest companies by market cap are software, platforms, and pharma. Their value is in brand, code, and IP. Intangibles dominate. P/TBV works in the US, but the universe is naturally constrained because many of the biggest companies fail the tangible equity screen.
India's public company universe is different. Listed companies are concentrated in banking, manufacturing, industrials, materials, and energy. These sectors carry large physical asset bases on their balance sheets. A steel company that built capacity twenty years ago has a balance sheet value for that plant that reflects depreciated historical cost. Current replacement cost may be three times higher. P/TBV finds these gaps.
This structural difference explains why P/TBV generates stronger absolute returns in India than in the US, not just a higher excess return over a lower local benchmark, but a genuinely higher absolute return.
What We Found
The headline number is $10,000 growing to $415,000. SPY over the same 25 years grew $10,000 to $65,000. The compounding gap between 15.92% and 7.83% is enormous over a 25-year horizon. It's driven by a combination of absolute India market growth and the factor premium from selecting cheap, quality hard-asset companies.
The negative down-capture of -9.57% is the most important structural result. Down capture below zero means the strategy made money in years when SPY fell. 2008 is the clearest example: the strategy returned +6.38% while SPY lost -26.14%. The reason is the same as in the US but amplified. Indian hard-asset companies are driven by domestic demand, infrastructure spending, and commodity cycles. They don't correlate tightly with the global tech-heavy benchmark when it's falling.
2004-2006 was the early payoff: +50.23%, +50.16%, +48.85% in three consecutive years. India was mid-manufacturing boom, with a large pool of qualifying cheap, profitable, asset-heavy companies that had been ignored through the 1990s. The strategy captured all of that.
2020-2023 tells a different story. After COVID, India's position as an alternative manufacturing hub to China accelerated. Supply chain relocation drove industrial investment. The 2020 return was +85.00%, the 2023 return was +72.11%. These aren't random. Tangible-asset companies in India were the direct beneficiaries of the structural shift in global manufacturing.
Cash in 2000-2001 avoided the dot-com crash. The Indian market had fewer than 10 qualifying stocks at the ₹20B threshold in those years, so the strategy sat in cash. SPY fell -14.78% and -20.77%. The strategy returned 0% both years. That's not a bug. It's the minimum-stocks filter working correctly: if there's no qualifying universe, the risk-reward doesn't justify investing.
2019 was a global P/TBV underperformance year. The strategy fell -29.64% in India. The same year, P/TBV strategies fell -30.84% in the US, -19.97% in Canada, -8.38% in Germany. This was the peak of the growth-vs-value divergence worldwide, driven by tech and platform companies with minimal tangible assets dominating index returns. India wasn't uniquely affected. The factor itself was being punished globally. The reversal that followed in 2020-2023 was also global.
The win rate is decent but not the point. The strategy beats SPY in 52% of years. What matters is the shape of the wins and losses. It tends to win large in crisis years (2000, 2001, 2008) and strong recovery years (2004-2006, 2020, 2022, 2023). It tends to lose in years dominated by US growth-stock momentum.
Annual Returns
| Year | Strategy | SPY | Vs. Benchmark |
|---|---|---|---|
| 2000 | 0% (Cash) | -14.78% | +14.78% |
| 2001 | 0% (Cash) | -20.77% | +20.77% |
| 2002 | +12.72% | +3.29% | +9.43% |
| 2003 | +26.42% | +16.44% | +9.98% |
| 2004 | +50.23% | +7.94% | +42.29% |
| 2005 | +50.16% | +8.86% | +41.30% |
| 2006 | +48.85% | +20.95% | +27.90% |
| 2007 | -11.53% | -13.71% | +2.18% |
| 2008 | +6.38% | -26.14% | +32.52% |
| 2009 | +19.61% | +13.42% | +6.19% |
| 2010 | -13.70% | +32.94% | -46.64% |
| 2011 | -1.76% | +4.10% | -5.86% |
| 2012 | -12.11% | +20.85% | -32.96% |
| 2013 | +56.76% | +24.50% | +32.26% |
| 2014 | +11.49% | +7.38% | +4.11% |
| 2015 | +9.00% | +3.36% | +5.64% |
| 2016 | +35.84% | +17.73% | +18.11% |
| 2017 | -4.11% | +14.34% | -18.45% |
| 2018 | -2.37% | +10.91% | -13.28% |
| 2019 | -29.64% | +7.12% | -36.76% |
| 2020 | +85.00% | +40.68% | +44.32% |
| 2021 | +13.33% | -10.17% | +23.50% |
| 2022 | +49.07% | +18.31% | +30.76% |
| 2023 | +72.11% | +24.60% | +47.51% |
| 2024 | +9.20% | +14.67% | -5.47% |
SPY 2021 and 2022 returns are as-recorded from our benchmark, consistent across all strategies in this series. Cash years (2000-2001) show 0% return as the strategy held cash due to fewer than 10 qualifying stocks.
The Current Screen
The live screen for US markets uses the same logic adapted for Indian exchanges. For India, swap the exchange filter to p.exchange IN ('BSE','NSE') and set the market cap threshold to k.marketCap > 240000000 (₹20B equivalent in USD terms as stored).
Full SQL and live results for the US universe: cetaresearch.com/data-explorer?q=z9gpaUlNfi
Limitations
The 15.92% CAGR includes India's exceptional growth decades. The Indian economy grew at 6-8% real GDP through much of this period, with favorable demographics and a manufacturing sector catching up to global standards. That tailwind won't repeat identically.
The Sharpe ratio of 0.321 is lower than the US result (0.438), despite the higher CAGR. The strategy is more volatile in India: the +85% and +72% years also come with -29% years. Investors who couldn't hold through 2019's -29.64% would have sold at the bottom before the 2020-2023 run.
The 2010-2012 stretch (consecutive negative or flat years) reflects a period of Indian macro tightening and global risk-off. P/TBV strategies can underperform for 2-3 year stretches even when the 25-year thesis is valid.
Minimum 10 stocks rule means the strategy sits in cash in 2000-2001. That was a favorable outcome in this backtest, but a longer data series might show cases where cash holding is costly.
Survivorship bias applies: companies that were delisted or failed during the period aren't fully captured in the exit returns.
Data: Ceta Research (FMP financial data warehouse), 2000-2025. Full methodology: backtests/METHODOLOGY.md


