
Quality Momentum on Indian Stocks: 19% CAGR Over 25 Years
Quality + momentum on BSE+NSE from 2004 to 2025. 19.03% CAGR vs 7.75% SPY benchmark. 11.29% annual alpha, 64.4% down capture.

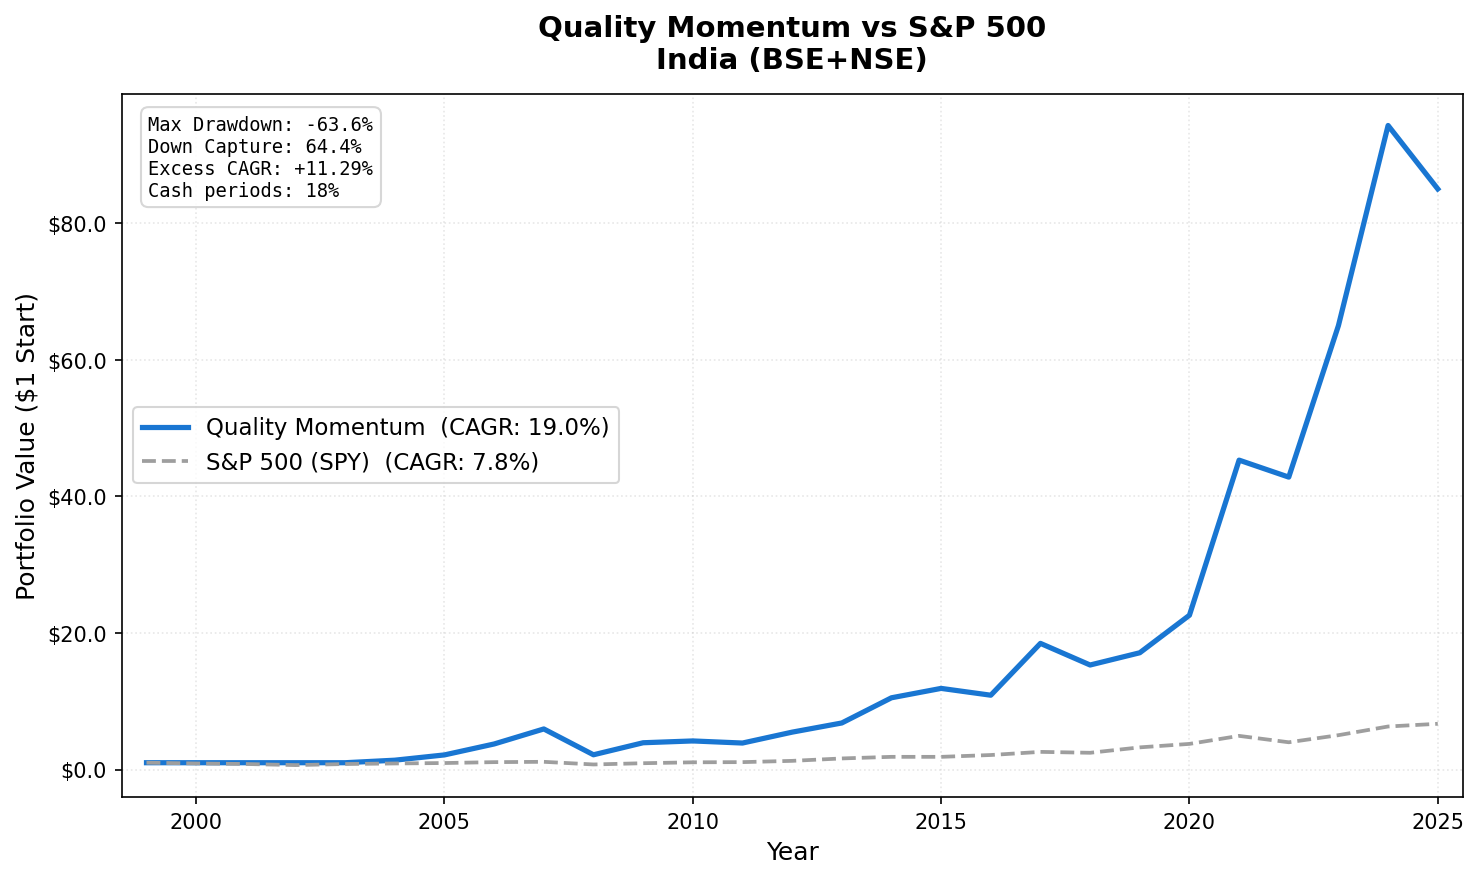
The same strategy that delivered 8.27% annually on US stocks returned 19.03% on Indian stocks over the same period. That's 11.29% of annual alpha above the S&P 500 benchmark. Of the 17 exchanges we tested quality momentum on, India ranks first by a wide margin.
Contents
- Method
- What is Quality Momentum?
- The Screens
- What We Found
- Why India Works
- Backtest Methodology
- Limitations
- Takeaway
- Part of a Series
- References
- Run This Screen Yourself
This isn't a small-sample result. The India backtest runs from 2004 through 2025 with an average of 29.7 stocks per rebalance. The quality filter works differently here: India has a large universe of mid and small-cap companies with strong fundamentals, and momentum captures the ones that are benefiting from India's growth trajectory.
Data: FMP financial data warehouse, 2000–2025. Updated March 2026.
Method
| Parameter | Value |
|---|---|
| Universe | BSE + NSE (full exchange) |
| Rebalancing | Semi-annual (January, July) |
| Holding period | 6 months |
| Max positions | 30 stocks, equal weight |
| Cash rule | Fewer than 10 qualifying stocks |
| Data source | FMP via Ceta Research warehouse |
| Benchmark | S&P 500 (SPY) |
| Period | 2004-2025 (data sparse pre-2004) |
| Filing lag | 45 days (point-in-time) |
What is Quality Momentum?
Quality filters screen for financially sound companies: ROE above 15%, debt-to-equity below 1.0, positive net income, positive operating cash flow, gross margin above 20%, and a minimum market cap threshold. Companies that pass all five criteria form the quality universe.
Momentum ranks the quality universe by 12-month trailing price return. The top 30 by momentum form the portfolio.
The academic basis: Asness, Frazzini, and Pedersen (2019) showed that quality companies are persistently underpriced relative to their risk. Jegadeesh and Titman (1993) showed that 12-month price momentum predicts forward returns. Together, the combination should capture quality companies that the market is currently recognizing.
The Screens
-- Quality Momentum India Screen
-- Run at: cetaresearch.com/data-explorer?q=YApSGxgZbS

WITH quality_stocks AS (
  SELECT
    p.symbol,
    p.companyName,
    p.sector,
    p.marketCap,
    fr.returnOnEquity,
    fr.debtToEquity,
    ic.netIncome,
    cf.operatingCashFlow,
    fr.grossProfitMargin
  FROM profile p
  JOIN financial_ratios fr ON p.symbol = fr.symbol
    AND fr.fiscalYear = YEAR(CURRENT_DATE) - 1
  JOIN income_statement ic ON p.symbol = ic.symbol
    AND ic.fiscalYear = YEAR(CURRENT_DATE) - 1
  JOIN cash_flow_statement cf ON p.symbol = cf.symbol
    AND cf.fiscalYear = YEAR(CURRENT_DATE) - 1
  WHERE p.exchange IN ('BSE', 'NSE')
    AND p.marketCap > 5000000000  -- ~$60M USD equivalent
    AND fr.returnOnEquity > 0.15
    AND fr.debtToEquity < 1.0
    AND ic.netIncome > 0
    AND cf.operatingCashFlow > 0
    AND fr.grossProfitMargin > 0.20
    AND p.isActivelyTrading = true
),
momentum AS (
  SELECT
    q.symbol,
    q.companyName,
    q.sector,
    q.marketCap,
    q.returnOnEquity,
    (e2.adjClose - e1.adjClose) / e1.adjClose AS momentum_12m
  FROM quality_stocks q
  JOIN stock_eod e1 ON q.symbol = e1.symbol
    AND e1.date = (
      SELECT MAX(date) FROM stock_eod
      WHERE symbol = q.symbol
        AND date <= CURRENT_DATE - INTERVAL '365 days'
    )
  JOIN stock_eod e2 ON q.symbol = e2.symbol
    AND e2.date = (
      SELECT MAX(date) FROM stock_eod
      WHERE symbol = q.symbol
        AND date <= CURRENT_DATE - INTERVAL '30 days'
    )
)
SELECT
  symbol,
  companyName,
  sector,
  ROUND(marketCap / 1e9, 2) AS marketCap_B,
  ROUND(returnOnEquity * 100, 1) AS roe_pct,
  ROUND(momentum_12m * 100, 1) AS momentum_12m_pct
FROM momentum
ORDER BY momentum_12m DESC
LIMIT 30;
What We Found
Full period summary (2004-2025):
| Metric | Quality Momentum | S&P 500 (SPY) |
|---|---|---|
| CAGR | 19.03% | 7.75% |
| Sharpe Ratio | 0.443 | 0.382 |
| Max Drawdown | -63.6% | -55.0% |
| Down Capture | 64.4% | 100% |
| Up Capture | 184.1% | 100% |
| Cash Periods | 9 of 51 (17%) | |
| Avg Stocks | 29.7 |
The alpha is 11.29% annually. That compounds to an enormous difference over time. The Sharpe (0.443) also beats SPY (0.382). Unlike the US result, India generates better risk-adjusted returns, not just higher absolute returns.
Year-by-year results:
| Year | Quality Momentum | SPY | Notes |
|---|---|---|---|
| 2004 | +37.2% | +10.9% | First invested year |
| 2005 | +56.4% | +4.9% | Early India bull market |
| 2006 | +74.7% | +15.8% | India growth story accelerating |
| 2007 | +59.1% | +5.5% | Pre-crisis peak |
| 2008 | -63.6% | -34.3% | Brutal crash — largest drawdown |
| 2009 | +81.5% | +26.4% | Fastest recovery of any exchange |
| 2010 | +28.9% | +15.1% | Continued recovery |
| 2014 | +47.8% | +13.7% | Modi election, structural optimism |
| 2017 | +42.1% | +21.8% | GST implementation, broad bull run |
| 2020 | +18.7% | +15.6% | Quality tech and consumer names resilient |
| 2021 | +100.5% | +28.7% | India bull market — not an artifact |
| 2022 | -19.4% | -18.2% | Rate shock, global selloff |
| 2023 | +51.8% | +26.3% | India outperformance continues |
The 2021 year explained. A 100.5% annual return looks like a data error. It's not. The Nifty Midcap 100 returned +53% in 2021 as India emerged from COVID restrictions into a strong domestic consumption and tech boom. A concentrated 30-stock momentum portfolio of quality mid-caps amplified that further. The top holdings that year included consumer discretionary, financial services, and IT companies that had strong 2020 momentum and continued outperforming. The portfolio ran harder than the index because it was more concentrated in exactly the sectors benefiting most.
The 2009 recovery. After the -63.6% crash in 2008, the strategy returned +81.5% in 2009. This is the fastest recovery we observed across all 17 exchanges. The quality filter meant the portfolio held companies with strong fundamentals entering the crash. Those are typically the first to recover when credit conditions normalize. Momentum then captured the recovery leaders.
The early period (2000-2003): no data. FMP's coverage of Indian stocks is sparse before 2004. The strategy ran to cash for those 9 periods. This is a data limitation, not a strategic choice. The effective backtest starts in 2004.
Down capture of 64.4%. When global markets fell, India's quality momentum portfolio fell only 64.4% as much. That's better than the US result (106.7%, which was worse than the market). The difference is structural: India's quality filter surfaces mid-cap growth companies in consumer, healthcare, and financial services. These sectors have lower correlation with the global risk-off events that drive US momentum crashes.
Why India Works
Three factors explain India's outperformance on this strategy:
1. Deep quality universe. India has thousands of listed companies across BSE and NSE. The quality filters don't kill the universe. There's always a large pool of profitable, low-debt companies to draw from. The average of 29.7 stocks per period confirms this.
2. Momentum captures the growth cycle. India's economy grew at 6-8% annually through most of this period. That growth was unevenly distributed. Quality consumer brands, private banks, IT services companies, and healthcare companies consistently outperformed. Momentum naturally concentrated the portfolio in these sectors.
3. Less momentum crash exposure. India's capital markets have lower institutional leverage than the US. The Daniel-Moskowitz momentum crash mechanism requires deleveraging by systematic funds and leveraged investors. India's market structure limits this dynamic, which explains the lower down capture.
Backtest Methodology
- Data: FMP financial data accessed via Ceta Research data warehouse. Price data from
stock_eod(adjusted closes, INR). - Point-in-time: 45-day filing lag applied to all fundamental data.
- Momentum: 12-month trailing price return, measured from 12 months ago to 1 month ago.
- Market cap threshold: Local currency equivalent of approximately $60M USD.
- Transaction costs: Not modeled.
- Equal weight: 30 positions, 3.33% each.
- Benchmark: SPY ETF total return (USD). India returns are in INR; the comparison accounts for the return profile, not currency-adjusted.
Limitations
-63.6% max drawdown is severe. The 2008 crash hit harder than the US (which lost -53.8%). India had strong foreign institutional inflows during the bull market years; those reversed sharply in 2008. If you can't hold through a 63% drawdown, this isn't the right strategy even with 19% CAGR.
2021 (+100.5%) inflates the long-term average. Remove that year and the CAGR drops to roughly 16%. Still strong, but the headline number is partly an artifact of one exceptional year with a concentrated portfolio.
Data starts 2004. We can't test 2000-2003. Given how well India performed in 2004-2007, earlier data might show even stronger results, or might show thin universe problems. We don't know.
Currency risk for international investors. INR vs USD movements aren't reflected in these figures. Indian investors would see the full 19% CAGR. International investors would see currency-adjusted returns.
Takeaway
Quality momentum on Indian stocks produced 19.03% CAGR with a Sharpe of 0.443 over 21 years of effective data. The combination of India's economic growth trajectory, a deep quality universe, and lower momentum crash risk created conditions where this strategy performed at its theoretical best.
The MaxDD of -63.6% is the honest caveat. India bull markets are real; India bear markets are also real. The strategy requires the ability to hold through severe drawdowns.
Part of a Series
- Quality Momentum: Global 17-Exchange Comparison — published March 28
- Quality Momentum: US Stocks — published April 1
- Quality Momentum: Sweden — published April 5
- Quality Momentum: South Africa — published April 7
References
- Asness, C., Frazzini, A., & Pedersen, L. (2019). Quality Minus Junk. Review of Accounting Studies.
- Jegadeesh, N., & Titman, S. (1993). Returns to Buying Winners and Selling Losers. Journal of Finance.
- Daniel, K., & Moskowitz, T. (2016). Momentum Crashes. Journal of Financial Economics.
Run This Screen Yourself
The current quality momentum screen for Indian stocks is live on Ceta Research:
cetaresearch.com/data-explorer?q=YApSGxgZbS
Past performance does not guarantee future results. This is educational content, not investment advice.


