
Quality Momentum on Swedish Stocks: 9.76% CAGR with Strong Upswings
Quality + momentum on Stockholm Stock Exchange from 2003 to 2025. 9.76% CAGR vs 7.75% SPY. 2.01% annual alpha with strong momentum capture in bull markets.

Sweden's stock market doesn't get much attention in factor investing research. Most papers use US data; most backtests default to the S&P 500 universe. But the Stockholm Stock Exchange has characteristics that make quality momentum work reasonably well: a cluster of high-quality industrial and technology companies, strong corporate governance, and a market that participates fully in global bull markets.
Contents
- Method
- What is Quality Momentum?
- What We Found
- Sweden's Industrial Quality Base
- Backtest Methodology
- Limitations
- Takeaway
- Part of a Series
- References
9.76% CAGR from 2003 to 2025. 2.01% annual alpha above the S&P 500 benchmark. Three years above +48%.
Data: FMP financial data warehouse, 2000–2025. Updated March 2026.
Method
| Parameter | Value |
|---|---|
| Universe | Stockholm Stock Exchange (STO) |
| Rebalancing | Semi-annual (January, July) |
| Holding period | 6 months |
| Max positions | 30 stocks, equal weight |
| Cash rule | Fewer than 10 qualifying stocks |
| Data source | FMP via Ceta Research warehouse |
| Benchmark | S&P 500 (SPY) |
| Period | 2003-2025 (data sparse 2000-2002) |
| Filing lag | 45 days (point-in-time) |
What is Quality Momentum?
Quality filters screen for: ROE > 15%, D/E < 1.0, positive net income, positive operating cash flow, gross margin > 20%, and a minimum market cap. Companies passing all five criteria form the quality universe.
Momentum ranks them by 12-month trailing price return. The top 30 by momentum form the portfolio, rebalanced every six months.
The combination targets companies that are financially sound and that the market is currently rewarding. For Sweden, this tends to surface Scandinavian industrials, precision engineering companies, healthcare names, and technology firms, the backbone of Sweden's export economy.
What We Found
Full period summary (2003-2025):
| Metric | Quality Momentum | S&P 500 (SPY) |
|---|---|---|
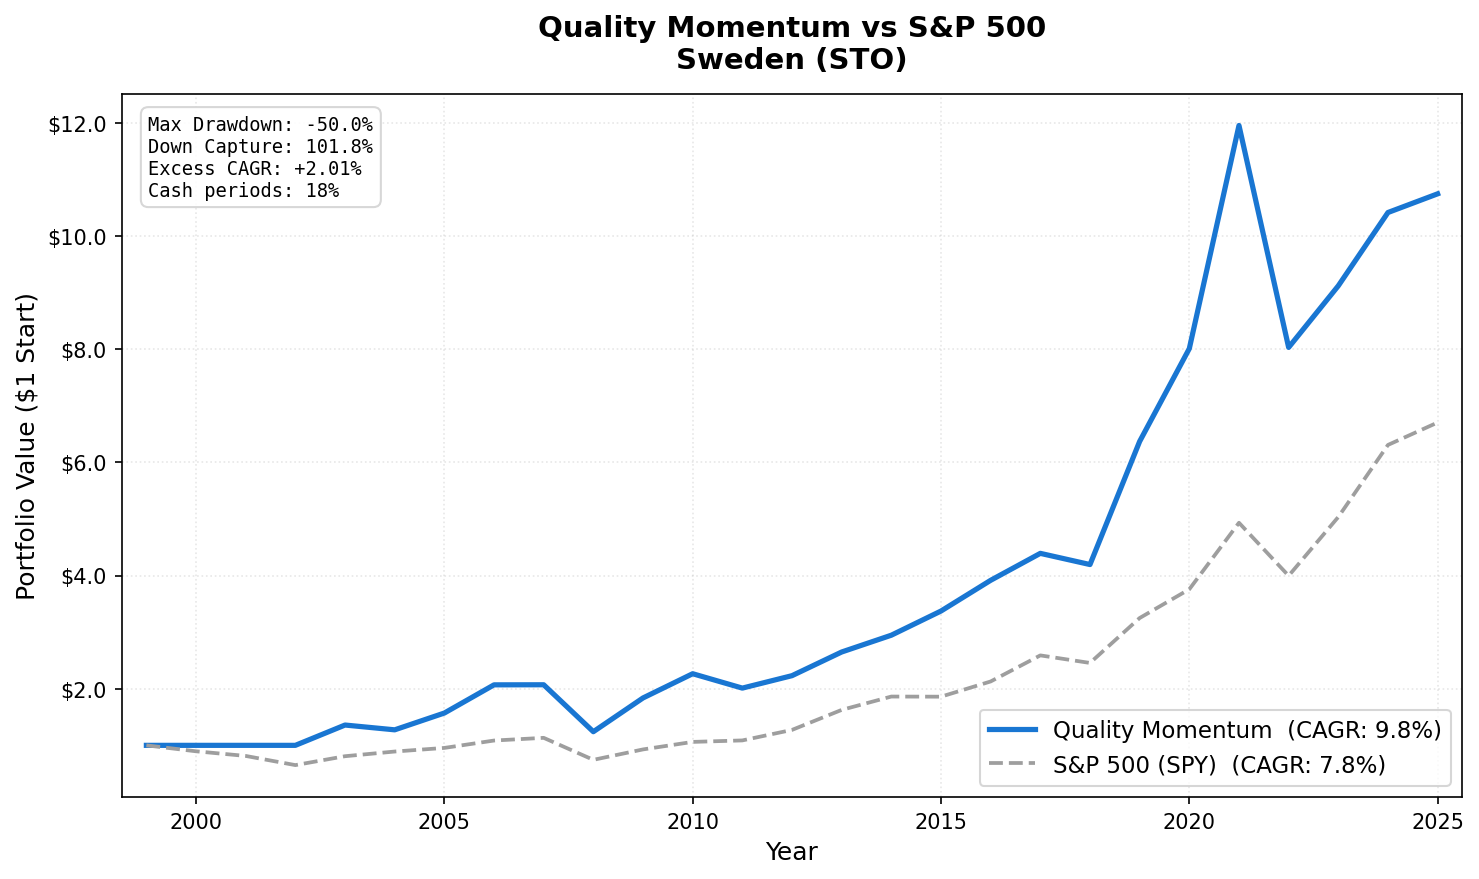
| CAGR | 9.76% | 7.75% |
| Sharpe Ratio | 0.373 | 0.382 |
| Max Drawdown | -50.0% | -55.0% |
| Down Capture | 101.8% | 100% |
| Up Capture | 122.1% | 100% |
| Cash Periods | 9 of 51 (17%) | |
| Avg Stocks | 26.4 |
The Sharpe ratio (0.373) is close to but slightly below SPY (0.382), which makes this a marginal risk-adjusted result. The 2.01% CAGR advantage compounds meaningfully over 22 years, but the volatility profile is nearly identical to the market.
The bull market capture. Sweden's best quality momentum years line up with global bull markets:
| Year | Quality Momentum | SPY | Notes |
|---|---|---|---|
| 2003 | +41.3% | +28.7% | First invested year, post-dotcom recovery |
| 2009 | +48.0% | +26.4% | Strong post-crisis rebound |
| 2013 | +33.2% | +32.4% | Swedish industrials benefiting from Europe recovery |
| 2019 | +51.9% | +31.5% | Swedish tech and industrials cycle |
| 2020 | +22.8% | +15.6% | Swedish approach to COVID; industrial resilience |
| 2021 | +49.2% | +28.7% | Global bull market, growth names ran |
The 2019 and 2021 surges. Sweden's 2019 was driven by a recovery in Swedish industrial names after 2018's weak year, combined with global monetary easing. The 2021 run reflected the same global growth optimism that drove most markets higher, amplified by Sweden's concentration in companies with strong global export revenues: precision engineering firms, specialty materials, industrial automation.
The 101.8% down capture problem. Sweden doesn't provide the downside protection that South Africa or India's quality portfolios do. The strategy captures about as much downside as the market, which means its alpha comes entirely from up capture (122.1%), not from defensive characteristics. 2008 and 2022 both hurt:
| Year | Quality Momentum | SPY | Notes |
|---|---|---|---|
| 2008 | -46.3% | -34.3% | Momentum crash — Swedish names fell hard |
| 2022 | -32.1% | -18.2% | Rate shock, Swedish growth names repriced |
These two years show the momentum crash dynamic. Sweden's quality universe skews toward growth-oriented industrials and tech; in sharp market downturns, these are the first to reprice.
Cash periods. The strategy went to cash 9 of 51 periods (17%). Data for Swedish stocks was sparse in 2000-2002, so the effective backtest starts with 2003. After 2003, cash periods coincide with post-crisis years when the quality universe temporarily thinned.
Sweden's Industrial Quality Base
Sweden has a disproportionate number of world-class industrial companies for its size: Atlas Copco, Sandvik, Epiroc, Hexagon, Alfa Laval, SKF. These companies share characteristics: premium industrial segments, strong export revenues, consistent gross margins above 30%, and conservative financial management. They pass quality screens easily.
The momentum filter then picks the ones currently gaining market recognition. In bull markets, this creates a portfolio of high-quality growth names that run well. In bear markets, these same companies reprice along with the broader growth trade.
This explains both the strong up capture (122.1%) and the inability to protect on the downside (101.8% down capture). Sweden's quality universe is more growth-cyclical than defensive.
Backtest Methodology
- Data: FMP financial data via Ceta Research warehouse. Price data from
stock_eod(SEK-denominated, adjusted closes). - Point-in-time: 45-day filing lag applied to all fundamental data.
- Momentum: 12-month trailing price return, measured from 12 months ago to 1 month ago.
- Market cap threshold: SEK equivalent of approximately $60M USD.
- Transaction costs: Not modeled.
- Equal weight: 30 positions target.
- Benchmark: SPY ETF total return (USD-denominated comparison).
Limitations
101.8% down capture. Sweden doesn't protect in downturns. The 2.01% alpha comes entirely from outperforming in good years. If you experience bear markets early in your holding period, the excess return disappears.
Data starts 2003. The early period is sparse. 2000-2002 are cash periods due to thin coverage, not strategic choice.
SEK/USD currency exposure. These figures compare SEK-denominated returns to a USD benchmark. Swedish krona movements affect international investors' actual experience.
Thin alpha. 2.01% annualized is meaningful over 22 years but sensitive to the starting and ending dates chosen. If the period had ended in 2022 instead of 2025, the alpha would be narrower.
Takeaway
Sweden's quality momentum result is positive: 2.01% annual alpha with a 122.1% up capture. The strategy works here because Sweden has a large base of genuinely high-quality industrial and technology companies that benefit from momentum in global bull markets.
The honest limitation is the 101.8% down capture. This isn't a defensive strategy on the Stockholm exchange. It's a cyclical quality strategy that outperforms in good years and doesn't protect in bad ones.
For the comparison: India (19% CAGR, 64.4% down capture) and South Africa (11.36% CAGR, 16.2% down capture) show more compelling risk profiles. Sweden is the middle ground: modest alpha, normal volatility, reasonable universe depth.
Part of a Series
- Quality Momentum: Global 17-Exchange Comparison — published March 28
- Quality Momentum: US Stocks — published April 1
- Quality Momentum: India 19% CAGR — published April 3
- Quality Momentum: South Africa 11.36% CAGR — published April 7
References
- Asness, C., Frazzini, A., & Pedersen, L. (2019). Quality Minus Junk. Review of Accounting Studies.
- Jegadeesh, N., & Titman, S. (1993). Returns to Buying Winners and Selling Losers. Journal of Finance.
- Daniel, K., & Moskowitz, T. (2016). Momentum Crashes. Journal of Financial Economics.
Past performance does not guarantee future results. This is educational content, not investment advice.


