
Sector-Adjusted Momentum Tested on 14 Global Exchanges: 11 of 14 Beat Their Local Benchmark
We backtested sector-adjusted momentum (12M-1M return minus sector average) on 14 exchanges from 2000 to 2025. Eleven beat their local benchmark on raw return. Japan, South Africa, and China fell short. The US wins on raw return but only through beta.

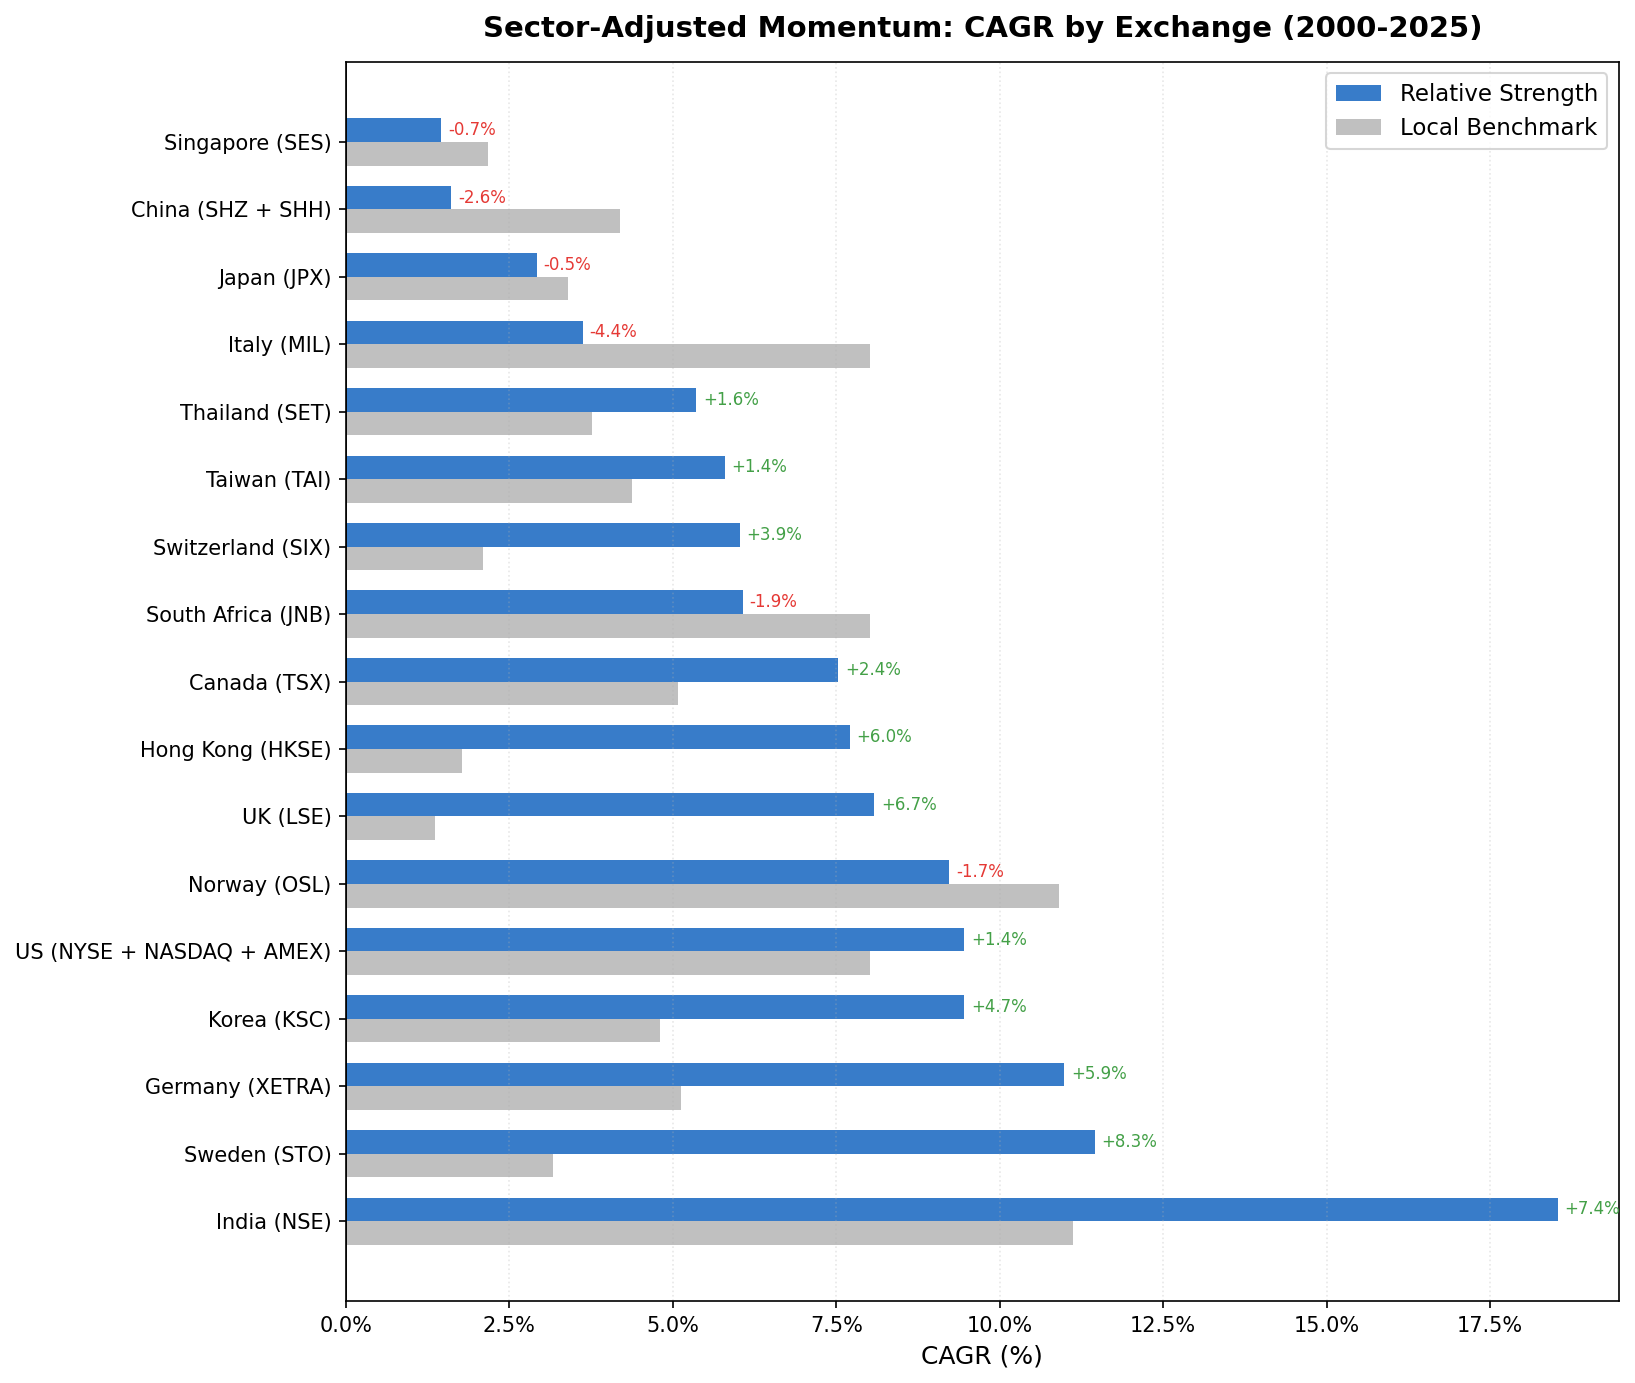
We tested the Sector-Adjusted Momentum strategy on 14 stock exchanges worldwide from 2000 to 2025. The strategy buys stocks that outperform their own sector peers, not just the market. Moskowitz and Grinblatt (1999) showed that roughly half of momentum profits come from sector-level trends. Strip that out, and you're left with stock-specific momentum.
Contents
- Method
- What We Found
- 11 outperform, 3 underperform vs local benchmark
- Why the Pattern Is Murkier Than It Looks
- Sector diversity helps, but doesn't decide it
- The US: a beta win, not an alpha win
- Japan, China, and South Africa: where it falls short
- Down capture as a portfolio construction tool
- The Signal
- By the Numbers
- Per-Market Deep Dives
- Academic Basis
Tested against each market's local benchmark, sector-adjusted momentum beat the index on raw return in 11 of 14 exchanges. Only 8 of those 11 keep the edge once you allow for the dividends those price indices leave out. The three that fell short were Japan (-0.48% vs Nikkei), South Africa (-1.95% vs the S&P 500 fallback), and China (-2.58% vs SSE Composite). The pattern is messier than market efficiency alone. The clearest read: the failures cluster in Asian markets with strong sector co-movement, plus South Africa, where thin sector breadth and a tough benchmark both work against the signal. And one of the "wins," the US, turns out to be beta rather than alpha.
Data: FMP financial data warehouse, 2000-2025. Updated June 2026.
Method
Data source: Ceta Research (FMP financial data warehouse) Period: 2000-2025 (25 years, 103 quarterly periods) Rebalancing: Quarterly (January, April, July, October), equal weight Benchmark: Local market index for each exchange (e.g., Sensex for India, DAX for Germany, FTSE 100 for UK). S&P 500 used for US and South Africa (no local index data available in FMP stock_eod). Transaction costs: Size-tiered model (0.1-0.5% one-way based on market cap) Cash rule: Hold cash if fewer than 10 stocks qualify at a rebalance date
Signal construction: 1. Compute each stock's 12-month return, skipping the most recent month (12M-1M lookback per Jegadeesh & Titman 1993) 2. Compute the equal-weighted average of that return across all qualifying stocks in the same GICS sector 3. Relative strength = stock return minus sector average return 4. Buy top 30 by relative strength
Universe: All stocks on each exchange with market cap above exchange-specific threshold (local currency) and known GICS sector from profile data. Minimum 5 stocks per sector to compute a sector average; stocks in under-represented sectors are excluded.
Three exchanges were excluded from this analysis: Norway (OSL), Italy (MIL), and Singapore (SES). All three had more than 5 consecutive years of zero qualifying stocks at the start of the backtest period combined with fewer than 5 average active sectors at rebalance dates. The RS signal relies on sector diversity to function; these markets didn't have it.
These benchmarks leave dividends out. Portfolio returns here use dividend-adjusted prices, so they include dividends. Most of the indices we measure against do not. The FTSE 100, Hang Seng, KOSPI, Nikkei 225, OMX Stockholm 30, Oslo All Share, SET Index, SMI, SSE Composite, STI, Sensex, TAIEX and TSX Composite are price indices, so excess return against them is overstated by roughly the local dividend yield, which has run between about 1.3% and 3.5% in these markets. Those comparisons are like for like: the S&P 500 figure runs through SPY, which is dividend-adjusted; the DAX is a performance index. Subtract the yield and only 8 of those 11 keep a positive edge. The ones that do not survive it are Canada, Thailand and Taiwan.
What We Found
11 outperform, 3 underperform vs local benchmark
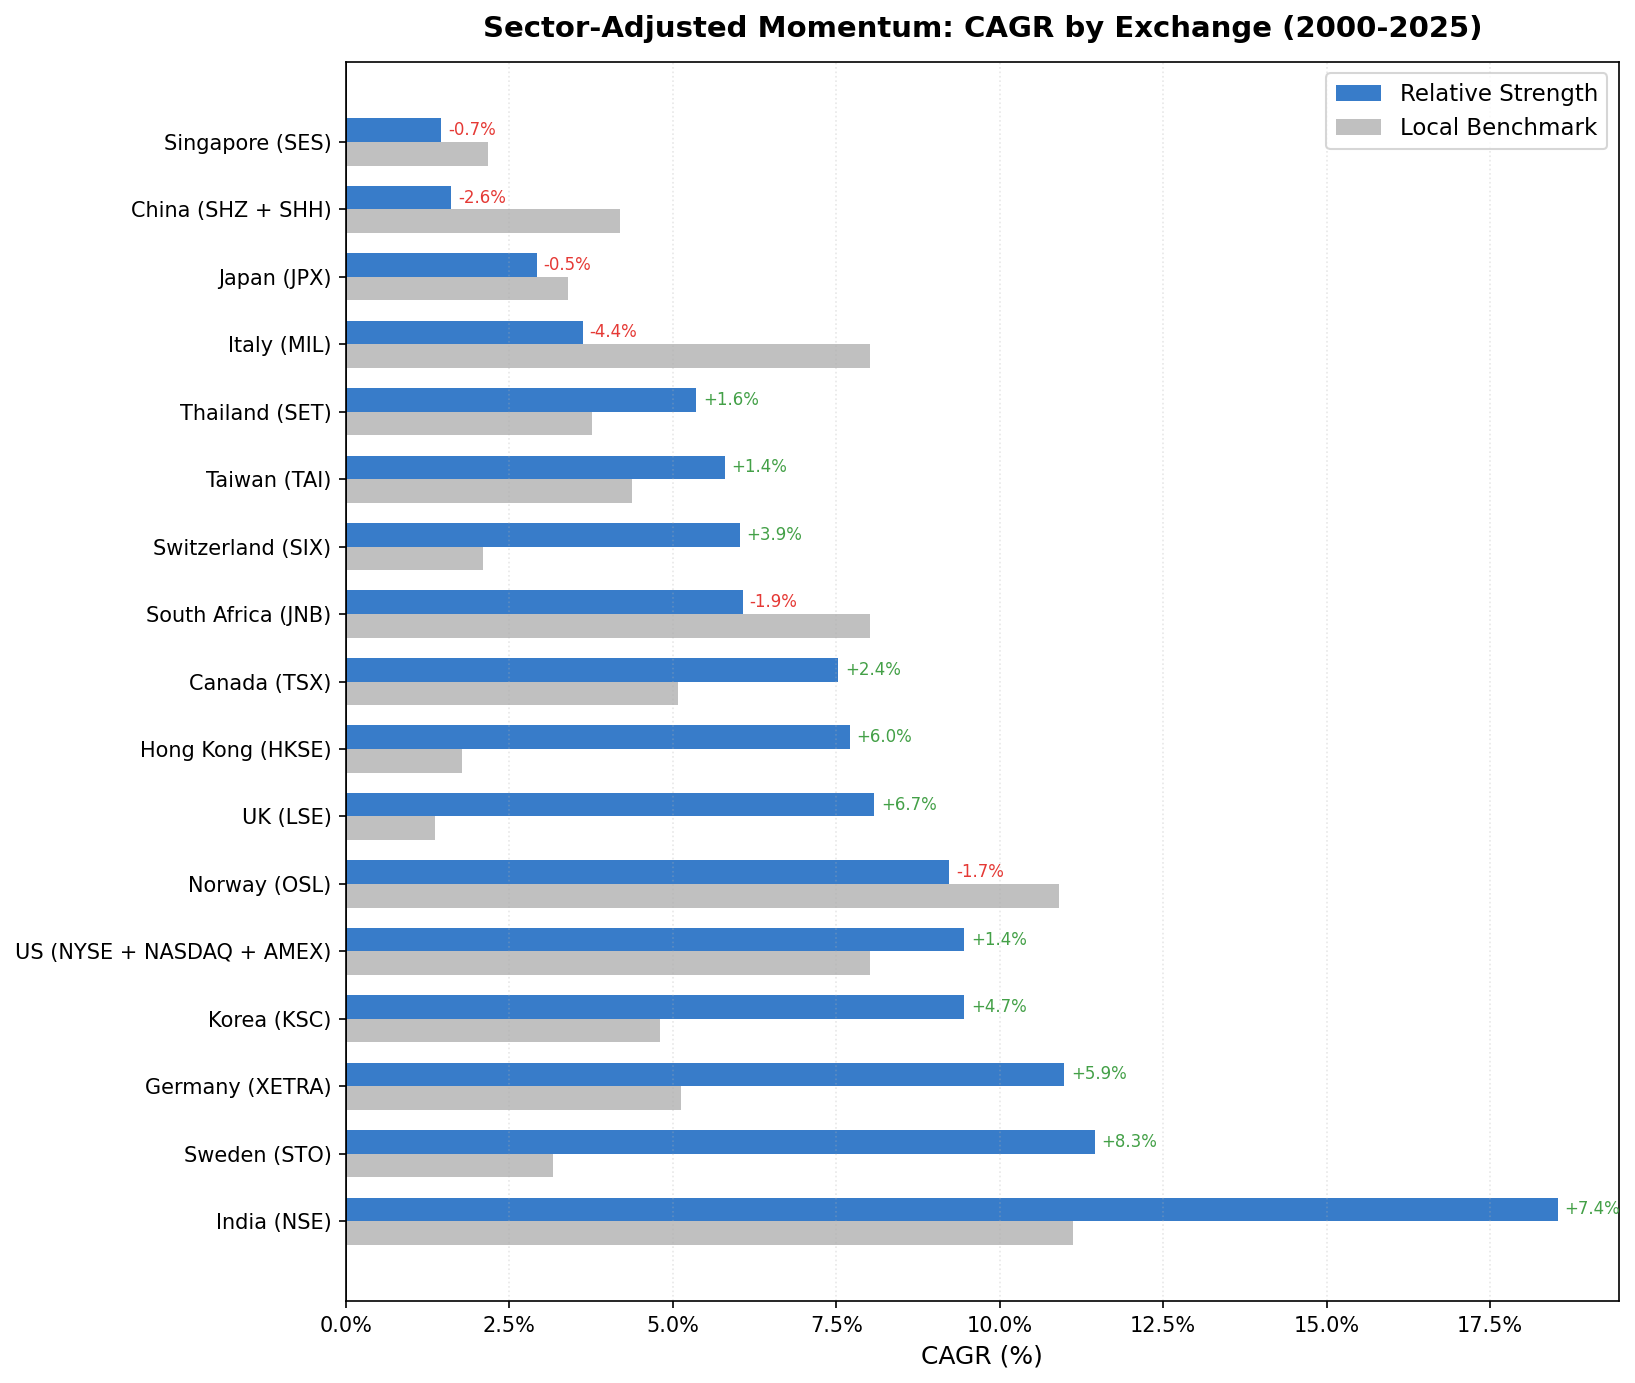
| Exchange | CAGR | Local Benchmark | Bench CAGR | Excess | Sharpe | Max Drawdown | Down Capture |
|---|---|---|---|---|---|---|---|
| Sweden (STO) | 11.45% | OMX Stockholm 30 | 3.17% | +8.28% | 0.457 | -52.32% | 63.97% |
| India (NSE) | 18.54% | Sensex | 11.12% | +7.42% | 0.427 | -69.30% | 82.30% |
| UK (LSE) | 8.08% | FTSE 100 | 1.36% | +6.72% | 0.209 | -47.86% | 79.89% |
| Hong Kong (HKSE) | 7.71% | Hang Seng | 1.77% | +5.95% | 0.157 | -73.01% | 86.04% |
| Germany (XETRA) | 10.99% | DAX | 5.12% | +5.87% | 0.478 | -46.03% | 54.55% |
| Korea (KSC) | 9.46% | KOSPI | 4.81% | +4.65% | 0.280 | -42.64% | 54.77% |
| Switzerland (SIX) | 6.03% | SMI | 2.10% | +3.92% | 0.294 | -50.82% | 95.81% |
| Canada (TSX) | 7.53% | TSX Composite | 5.08% | +2.44% | 0.226 | -46.93% | 114.63% |
| Thailand (SET) | 5.36% | SET Index | 3.76% | +1.61% | 0.129 | -46.91% | 67.45% |
| US (NYSE+NASDAQ+AMEX) | 9.46% | S&P 500 | 8.02% | +1.45% | 0.248 | -59.90% | 146.93% |
| Taiwan (TAI) | 5.80% | TAIEX | 4.38% | +1.42% | 0.217 | -60.68% | 65.35% |
| Japan (JPX) | 2.92% | Nikkei 225 | 3.40% | -0.48% | 0.137 | -63.60% | 75.97% |
| S.Africa (JNB) | 6.07% | S&P 500* | 8.02% | -1.95% | -0.189 | -37.88% | 35.83% |
| China (SHZ+SHH) | 1.61% | SSE Composite | 4.19% | -2.58% | -0.026 | -70.59% | 103.48% |
*South Africa benchmark: S&P 500 used as fallback (no local index data in FMP stock_eod for JSE All Share). The US row beats the S&P 500 on raw return, but the edge is beta, not alpha (see below).
Why the Pattern Is Murkier Than It Looks
Sector diversity helps, but doesn't decide it
The neat story would be "sector diversity predicts success." The data doesn't fully support it. Sweden tops the table at +8.28% excess with only 6.4 average active sectors. South Africa underperforms with just 3.7. India (9.5 sectors), the UK (9.0), and Germany (9.0) all have deep sector breadth and all post strong alpha, so breadth clearly helps. But it isn't the whole story.
What the outperformers share is a weak local benchmark and slower information diffusion. India's Sensex compounded at 11.12% from 2000 to 2025; the RS strategy added 7.42 points. Sweden's OMX Stockholm 30 compounded at just 3.17%; the RS strategy added 8.28. In both cases the sector adjustment isolates genuine company-specific momentum that persists because analyst coverage is thinner and prices adjust more slowly than in the US.
The US: a beta win, not an alpha win
The US looks like one of the 11 winners, with 9.46% CAGR against the S&P 500's 8.02%. Look closer and the win dissolves. The portfolio's beta is 1.46, its up capture and down capture are both about 147%, and its Jensen's alpha is negative at -1.3%. The strategy is essentially a 1.46-times leveraged S&P 500: in a 25-year bull market that earns more than the index, but its Sharpe ratio (0.248) sits below the market's (0.361) and its drawdown (-59.9%) is far deeper (-43.9%). The raw outperformance is exposure, not skill. Moskowitz and Grinblatt showed the industry component drives roughly half of US momentum profits; stripping it out leaves a high-beta tilt, not a clean alpha source, in the world's most efficient equity market.
Japan, China, and South Africa: where it falls short
Japan (-0.48% vs Nikkei) and China (-2.58% vs SSE Composite) both have sector diversity, but RS still underperforms. The likely cause is sector co-movement: Asian markets show stronger local sector trends, so removing the sector effect removes the strongest part of the momentum signal.
South Africa is a different failure. It has only 3.7 average active sectors, well below the breadth the signal needs, and it's measured against the S&P 500 rather than a local index (FMP carries no JSE All Share series). After the data-quality guards strip out broken split adjustments that had inflated earlier runs, South Africa's CAGR lands at 6.07%, below the S&P 500's 8.02%. Thin breadth and a tough benchmark both work against it.
Down capture as a portfolio construction tool
The down capture numbers reveal how each strategy behaves during market downturns.
| Exchange | Down Capture | What It Means |
|---|---|---|
| S.Africa | 35.83% | Lowest in the study, but it still trails its benchmark |
| Germany | 54.55% | Absorbed 55 cents per euro of DAX loss |
| Korea | 54.77% | Absorbed about half of KOSPI's bear quarter losses |
| Sweden | 63.97% | Good protection in OMX Stockholm downturns |
| UK | 79.89% | Moderate protection in FTSE 100 downturns |
| India | 82.30% | Fell 82% as much as Sensex in bear quarters |
| Canada | 114.63% | Amplifies TSX downturns |
| US | 146.93% | Worst bear market behavior in the dataset |
The US at 146.93% down capture means the RS portfolio absorbed nearly one and a half times S&P 500 bear market losses. It's the clearest sign that the US result is a high-beta tilt: it amplifies the market in both directions, which is why it beats on raw return while still posting the worst drawdown behavior in the study. This is the momentum crash problem: winners get oversold in panics.
The Signal
The screen below runs on current data. It identifies stocks outperforming their own sector peers using the same 12M-1M lookback as the backtest.
WITH universe AS (
    SELECT p.symbol, p.companyName, MIN(p.exchange) AS exchange, p.sector,
           MAX(k.marketCap) / 1e9 AS market_cap_billions
    FROM profile p
    JOIN key_metrics_ttm k ON p.symbol = k.symbol
    WHERE k.marketCap > 1000000000
      AND p.isActivelyTrading = true
      AND p.sector IS NOT NULL AND p.sector != ''
    GROUP BY p.symbol, p.companyName, p.sector
),
price_1m_ago AS (
    SELECT symbol, adjClose AS price_1m,
           ROW_NUMBER() OVER (PARTITION BY symbol
               ORDER BY ABS(CAST(dateEpoch AS BIGINT) -
                   CAST(EXTRACT(EPOCH FROM (CURRENT_DATE - INTERVAL '30' DAY))::BIGINT AS BIGINT))
           ) AS rn
    FROM stock_eod
    WHERE CAST(date AS DATE) BETWEEN CURRENT_DATE - INTERVAL '45' DAY AND CURRENT_DATE - INTERVAL '15' DAY
      AND adjClose > 1.0
),
price_12m_ago AS (
    SELECT symbol, adjClose AS price_12m,
           ROW_NUMBER() OVER (PARTITION BY symbol
               ORDER BY ABS(CAST(dateEpoch AS BIGINT) -
                   CAST(EXTRACT(EPOCH FROM (CURRENT_DATE - INTERVAL '365' DAY))::BIGINT AS BIGINT))
           ) AS rn
    FROM stock_eod
    WHERE CAST(date AS DATE) BETWEEN CURRENT_DATE - INTERVAL '395' DAY AND CURRENT_DATE - INTERVAL '335' DAY
      AND adjClose > 1.0
),
raw_momentum AS (
    SELECT u.symbol, u.companyName, u.exchange, u.sector, u.market_cap_billions,
           ROUND((p1m.price_1m - p12.price_12m) / p12.price_12m * 100, 1) AS raw_mom_pct
    FROM universe u
    JOIN price_12m_ago p12 ON u.symbol = p12.symbol AND p12.rn = 1
    JOIN price_1m_ago p1m  ON u.symbol = p1m.symbol  AND p1m.rn = 1
    WHERE p12.price_12m > 1.0 AND p1m.price_1m > 1.0
      AND (p1m.price_1m - p12.price_12m) / p12.price_12m <= 5.0
),
sector_avg AS (
    SELECT sector, COUNT(*) AS sector_count, AVG(raw_mom_pct) AS sector_avg_mom
    FROM raw_momentum
    GROUP BY sector
    HAVING COUNT(*) >= 5
)
SELECT m.symbol, m.companyName, m.exchange, m.sector,
       ROUND(m.market_cap_billions, 2) AS market_cap_billions,
       m.raw_mom_pct,
       ROUND(s.sector_avg_mom, 1) AS sector_avg_pct,
       ROUND(m.raw_mom_pct - s.sector_avg_mom, 1) AS relative_strength_pct,
       s.sector_count
FROM raw_momentum m
JOIN sector_avg s ON m.sector = s.sector
ORDER BY relative_strength_pct DESC
LIMIT 30
Run it on the Ceta Research Data Explorer.
By the Numbers
Period: 2000-2025 (25 years, 103 quarterly rebalance periods) Exchanges tested: 14 (after excluding OSL, MIL, SES for insufficient sector diversity) Outperformers vs local benchmark: 11 (Sweden, India, UK, Hong Kong, Germany, Korea, Switzerland, Canada, Thailand, US, Taiwan) Underperformers vs local benchmark: 3 (Japan, South Africa, China)
Best excess: Sweden, +8.28% vs OMX Stockholm 30, Sharpe 0.457 Highest absolute return: India, 18.54% CAGR, +7.42% vs Sensex Strongest alpha in developed markets: Sweden (+8.28% vs OMX), UK (+6.72% vs FTSE 100), Germany (+5.87% vs DAX) Worst result: China, -2.58% excess vs SSE Composite Note on the US: +1.45% raw vs S&P 500, but negative Jensen's alpha (-1.3%) and the worst down capture in the study (146.9%). The edge is beta, not skill. Most defensive: South Africa (35.83% down capture, but underperforms), Germany (54.55%), Korea (54.77%)
Per-Market Deep Dives
Full write-ups for the standout markets, each with the local benchmark, year-by-year results, and a runnable screen:
- Sweden (STO): 11.45% CAGR, +8.28% vs OMX Stockholm 30
- India (NSE): 18.54% CAGR, +7.42% vs Sensex
- Germany (XETRA): 10.99% CAGR, +5.87% vs DAX
- United States: 9.46% CAGR, why the +1.45% edge is beta, not alpha
Academic Basis
The strategy is grounded in two papers:
Moskowitz, T. & Grinblatt, M. (1999). "Do Industries Explain Momentum?" Journal of Finance, 54(4), 1249-1290. Found that roughly half of momentum profits in the US come from industry-level momentum. Individual stock momentum, once sector effects are removed, is the cleaner signal.
Jegadeesh, N. & Titman, S. (1993). "Returns to Buying Winners and Selling Losers." Journal of Finance, 48(1), 65-91. The foundational momentum paper. Established the 12-month lookback with one-month skip to avoid short-term reversal contamination.
The cross-market variation we see here extends the Moskowitz-Grinblatt finding. In markets with stronger stock-specific momentum and weaker sector co-movement (Sweden, India, Germany, UK), removing sector effects helps. In markets where sector co-movement is stronger (Japan, China), it hurts. And in the US, the residual stock-specific signal survives as a high-beta tilt that earns raw return without a risk-adjusted edge.
Data: Ceta Research (FMP financial data warehouse). Backtest period 2000-2025. Each exchange benchmarked against its local market index. Past performance does not guarantee future results. This is educational content, not investment advice.

