
Sector-Adjusted Momentum on NSE Stocks: 18.54% CAGR, +7.42% vs Sensex (2000-2025)
Sector-adjusted momentum on NSE stocks returned 18.54% annually from 2000 to 2025 vs the Sensex''s 11.12%. +7.42% annual alpha, 82% down capture vs Sensex. India had the highest absolute return across 14 global exchanges tested.

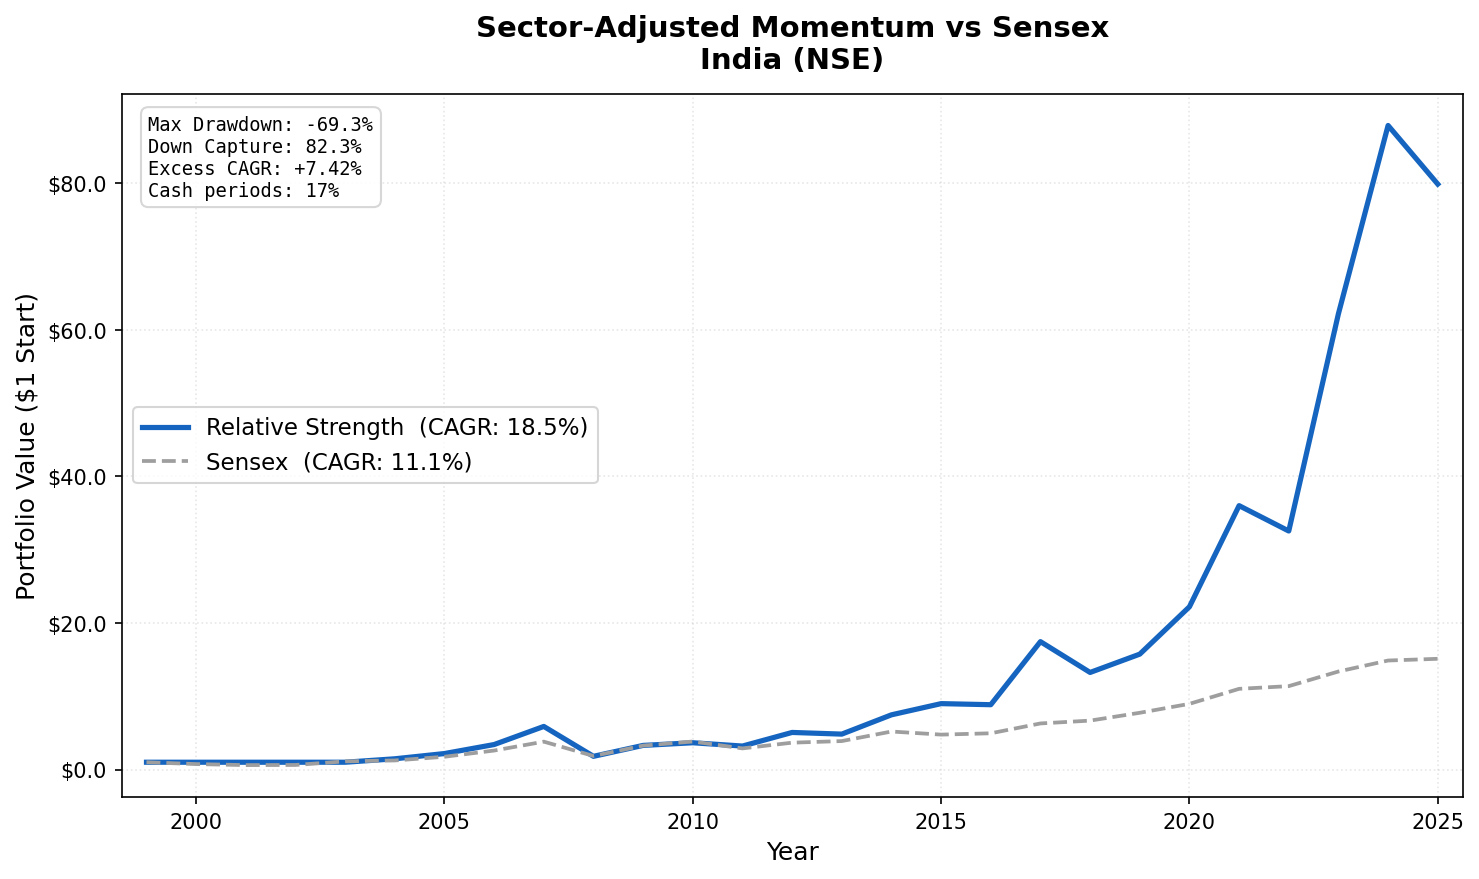
We backtested the Sector-Adjusted Momentum strategy on NSE stocks from 2000 to 2025. The strategy buys stocks that are outperforming their own sector peers, not just the market overall. The result: 18.54% annual return versus the Sensex's 11.12%, with +7.42% annual alpha.
Contents
- Method
- Performance
- Why India Works
- The Indian Market Context
- The Current Screen
- By the Numbers
- Academic Basis
India delivered the highest absolute return of any market in a 14-exchange study. At 18.54% a year, it isn't close: the next-best market compounded at 11.45%.
Data: FMP financial data warehouse, 2000-2025. Updated June 2026.
Method
Data source: Ceta Research (FMP financial data warehouse) Universe: NSE stocks, market cap > ₹20B (~$240M USD equivalent) Period: 2000-2025 (25 years, 103 quarterly periods) Rebalancing: Quarterly (January, April, July, October), equal weight Benchmark: Sensex (^BSESN), 11.12% CAGR over this period Transaction costs: 0.5% one-way (small-cap tier for Indian market) Cash rule: Hold cash if fewer than 10 stocks qualify at a rebalance date
Signal construction: 1. Compute each stock's 12-month return, skipping the most recent month (12M-1M per Jegadeesh & Titman 1993) 2. Compute the equal-weighted sector average of that return across qualifying NSE stocks 3. Relative strength = stock return minus sector average return 4. Buy top 30 by relative strength, equal weight
Data quality guards: Minimum price ₹1.0, maximum raw signal 500% (filters split-adjustment artifacts), maximum single-period return 200%, and a price-oscillation filter that removes phantom holiday rows and broken split adjustments.
18 of 103 quarters had fewer than 10 qualifying stocks (cash periods). These occurred mostly between 2000 and 2004 when the Indian market had fewer listed companies meeting the market cap threshold.
Performance

| Metric | Strategy | Sensex |
|---|---|---|
| CAGR (2000-2025) | 18.54% | 11.12% |
| Excess CAGR | +7.42% | N/A |
| Sharpe Ratio | 0.427 | 0.194 |
| Max Drawdown | -69.30% | -51.34% |
| Down Capture | 82.30% | 100% |
| Cash Periods | 18/103 (17%) | N/A |
| Avg Stocks Held | 29.8 | N/A |
| Avg Active Sectors | 9.5 | N/A |
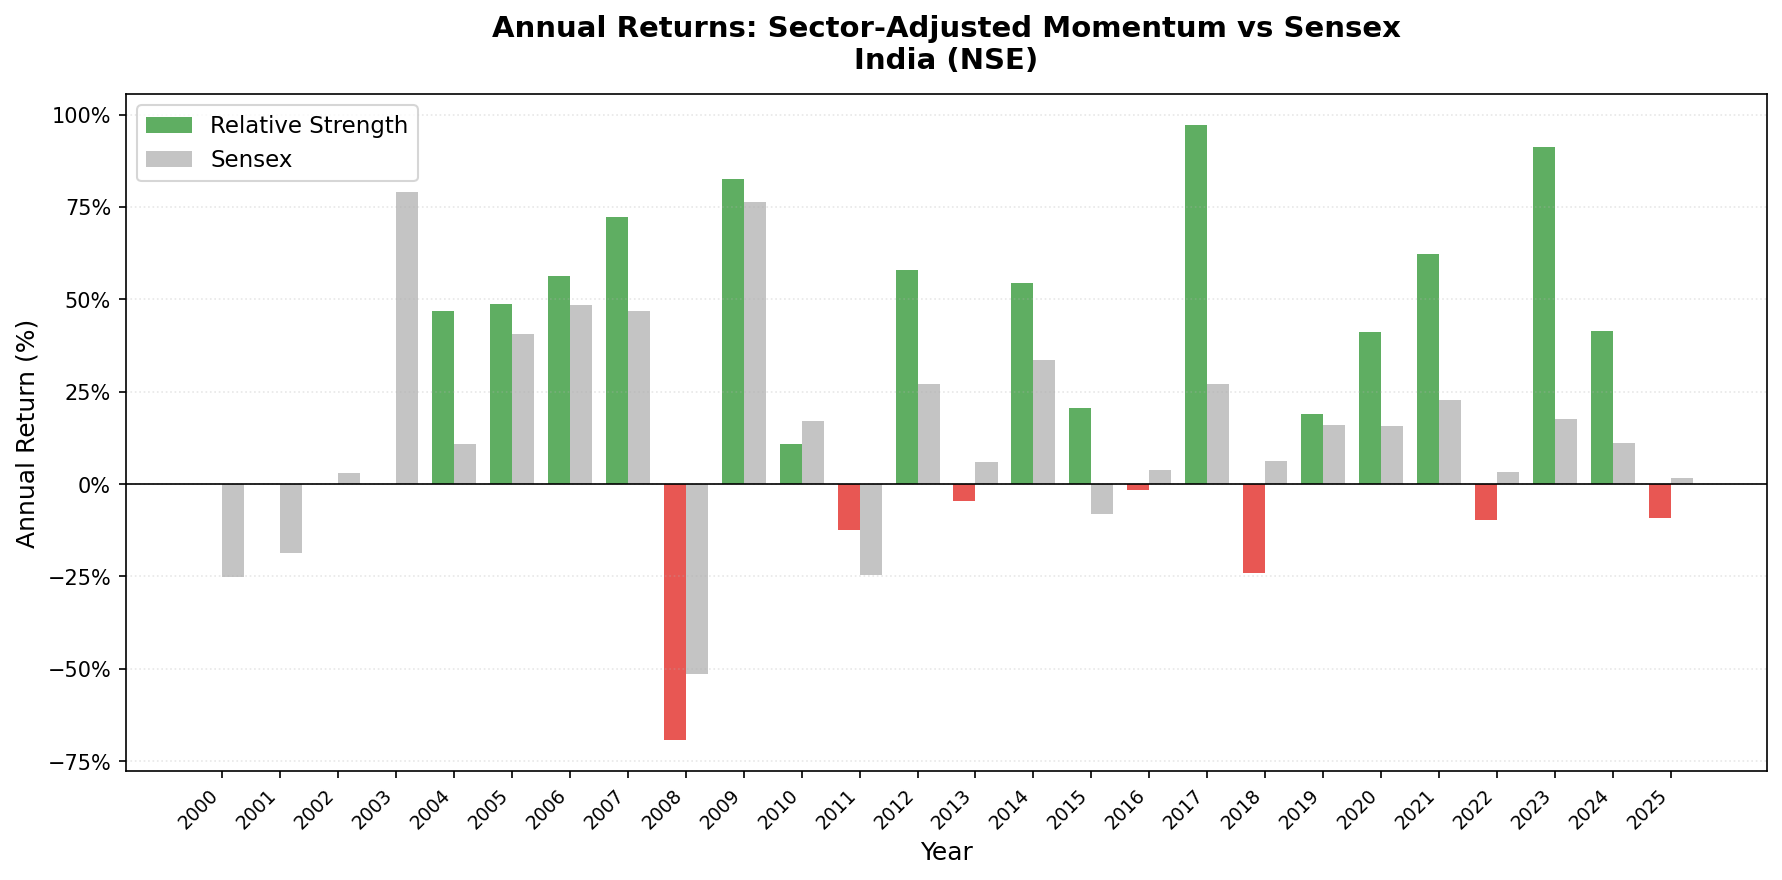
The down capture of 82.30% means that during quarters when the Sensex fell, this portfolio fell 82 cents for every rupee of market loss. The strategy provides moderate protection in Indian market downturns while delivering strong absolute returns on top of an already strong benchmark.
Why India Works
Three things explain the India result.
Sector diversity. At rebalance dates, the NSE market averages 9.5 distinct active sectors with qualifying stocks, the most of any exchange in the study. That's enough breadth for the sector adjustment to matter. When you compute relative strength, stock return minus sector average, you're comparing within meaningful peer groups: tech stocks versus tech peers, consumer stocks versus consumer peers. With only 3 or 4 sectors (as in some smaller markets), the adjustment is noise. With 9 or more, it's signal.
Market inefficiency. The Indian market has more room for fundamental mispricing than the US. Analyst coverage is thinner, information dissemination is slower, and foreign institutional participation has grown only gradually. Momentum strategies in general work better where inefficiencies exist. When sector effects are removed, the stock-specific momentum that remains is real and persistent.
Sector dispersion. Indian sectors don't move together as tightly as, say, Asian tech-heavy markets like Taiwan or Hong Kong. This means sector-adjusting amplifies the signal rather than reducing it. A stock in Information Technology that's up 80% when tech is up 20% has 60 percentage points of genuine company-specific momentum. In a market where every sector moves together, that decomposition is less meaningful.
The Indian Market Context
During periods of high momentum signal, the portfolio pulled heavily from technology, consumer discretionary, and financial services. Healthcare and basic materials contributed during commodity and healthcare cycles. The sector adjustment prevented the portfolio from chasing the same sector rotation that raw momentum would have followed.
The 18 cash periods (2000-2004 primarily) reflect the early Indian market having fewer MCap-qualifying listed companies. By 2005, the signal fired consistently every quarter. From 2005 to 2025, the strategy had only 4 additional cash periods.
The Current Screen
This SQL runs on live NSE data and replicates the signal logic used in the backtest.
WITH universe AS (
    SELECT p.symbol, p.companyName, p.exchange, p.sector,
           k.marketCap / 1e9 AS market_cap_billions
    FROM profile p
    JOIN key_metrics_ttm k ON p.symbol = k.symbol
    WHERE k.marketCap > 20000000000        -- ₹20B (~$240M USD)
      AND p.isActivelyTrading = true
      AND p.sector IS NOT NULL AND p.sector != ''
      AND p.exchange = 'NSE'
),
price_1m_ago AS (
    SELECT symbol, adjClose AS price_1m,
           ROW_NUMBER() OVER (PARTITION BY symbol
               ORDER BY ABS(CAST(dateEpoch AS BIGINT) -
                   CAST(EXTRACT(EPOCH FROM (CURRENT_DATE - INTERVAL '30' DAY))::BIGINT AS BIGINT))
           ) AS rn
    FROM stock_eod
    WHERE CAST(date AS DATE) BETWEEN CURRENT_DATE - INTERVAL '45' DAY AND CURRENT_DATE - INTERVAL '15' DAY
      AND adjClose > 1.0
),
price_12m_ago AS (
    SELECT symbol, adjClose AS price_12m,
           ROW_NUMBER() OVER (PARTITION BY symbol
               ORDER BY ABS(CAST(dateEpoch AS BIGINT) -
                   CAST(EXTRACT(EPOCH FROM (CURRENT_DATE - INTERVAL '365' DAY))::BIGINT AS BIGINT))
           ) AS rn
    FROM stock_eod
    WHERE CAST(date AS DATE) BETWEEN CURRENT_DATE - INTERVAL '395' DAY AND CURRENT_DATE - INTERVAL '335' DAY
      AND adjClose > 1.0
),
raw_momentum AS (
    SELECT u.symbol, u.companyName, u.exchange, u.sector, u.market_cap_billions,
           ROUND((p1m.price_1m - p12.price_12m) / p12.price_12m * 100, 1) AS raw_mom_pct
    FROM universe u
    JOIN price_12m_ago p12 ON u.symbol = p12.symbol AND p12.rn = 1
    JOIN price_1m_ago p1m  ON u.symbol = p1m.symbol  AND p1m.rn = 1
    WHERE p12.price_12m > 1.0 AND p1m.price_1m > 1.0
      AND (p1m.price_1m - p12.price_12m) / p12.price_12m <= 5.0
),
sector_avg AS (
    SELECT sector, COUNT(*) AS sector_count, AVG(raw_mom_pct) AS sector_avg_mom
    FROM raw_momentum
    GROUP BY sector
    HAVING COUNT(*) >= 5
)
SELECT m.symbol, m.companyName, m.exchange, m.sector,
       ROUND(m.market_cap_billions, 2) AS market_cap_billions,
       m.raw_mom_pct,
       ROUND(s.sector_avg_mom, 1) AS sector_avg_pct,
       ROUND(m.raw_mom_pct - s.sector_avg_mom, 1) AS relative_strength_pct,
       s.sector_count
FROM raw_momentum m
JOIN sector_avg s ON m.sector = s.sector
ORDER BY relative_strength_pct DESC
LIMIT 30
Run it on the Ceta Research Data Explorer.
By the Numbers
Period: 2000-2025 (25 years, 103 quarterly periods) Strategy CAGR: 18.54% Sensex benchmark CAGR: 11.12% Excess CAGR: +7.42% Sharpe ratio: 0.427 Max drawdown: -69.30% Down capture: 82.30% (absorbed 82% of Sensex bear market losses) Cash periods: 18 of 103 (17%), mostly 2000-2004 Average stocks held: 29.8 of 30 target Average active sectors: 9.5
Academic Basis
Moskowitz, T. & Grinblatt, M. (1999). "Do Industries Explain Momentum?" Journal of Finance, 54(4), 1249-1290. Showed that roughly half of raw momentum profits come from industry-level trends. The RS signal isolates the stock-specific half.
Jegadeesh, N. & Titman, S. (1993). "Returns to Buying Winners and Selling Losers." Journal of Finance, 48(1), 65-91. The foundational momentum paper. Established the 12M skip-1M lookback to avoid short-term reversal bias.
Data: Ceta Research (FMP financial data warehouse). Backtest period 2000-2025 on NSE. Past performance does not guarantee future results. This is educational content, not investment advice.


