
Sector Momentum in Germany: 13.07% CAGR, +5.05% Excess Over 26 Years

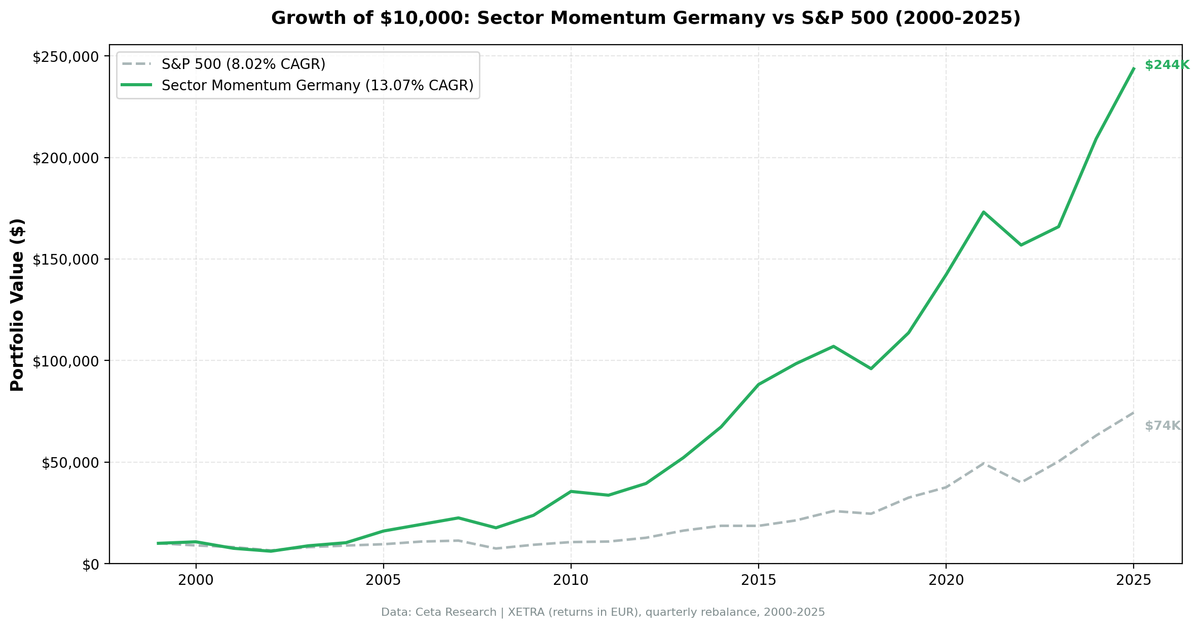
Germany delivered the best sector momentum results of any European market in our 14-exchange study. 13.07% CAGR over 26 years. $10,000 grew to €243,629 in EUR-denominated terms versus $74,347 for SPY. The 2008 global financial crisis tells a lot about why: the portfolio returned -21.68% while SPY fell -34.31%. That 12.6% relative gap in a single year captures the structural protection built into Germany's sector rotation patterns.
Contents
- The Strategy
- Results
- The Technology and Real Estate Cycle
- When It Worked, When It Didn't
- Full Annual Returns
- Limitations
Two sectors tied for the most time in the top-2 rotation: Technology and Real Estate, each appearing in 30 of 104 quarters. That alternating cycle between Germany's industrial-tech leadership and its property market is the mechanical backbone of this strategy's long-run edge.
The Strategy
Each quarter, we rank all 11 GICS sectors by their equal-weighted 12-month trailing return across XETRA-listed stocks. We hold stocks from the top 2 sectors, equal-weighted, and rebalance quarterly. Stocks must clear an exchange-specific market cap threshold. Transaction costs of 0.1% per trade are applied.
Full methodology: backtests/METHODOLOGY.md
| Parameter | Value |
|---|---|
| Universe | XETRA (Germany) |
| Signal | Top 2 sectors by trailing 12-month equal-weighted return |
| Selection | All qualifying stocks in those sectors |
| Rebalancing | Quarterly |
| Period | 2000-2025 (26 years, 104 quarters) |
| Cash periods | 3 of 104 (3%) |
| Avg stocks held | 64.6 |
| Benchmark | S&P 500 Total Return (SPY, USD) |
| Data source | Ceta Research (FMP financial data warehouse) |
Returns are in EUR. SPY is a USD benchmark used for cross-exchange comparison. The currency difference makes the excess return comparison illustrative rather than exact.
Results
The aggregate numbers:
| Metric | Portfolio | S&P 500 (USD) |
|---|---|---|
| CAGR (2000-2025) | 13.07% | 8.02% |
| Excess CAGR | +5.05% | — |
| Final value ($10k) | €243,629 | $74,347 |
| Max drawdown | -52.85% | -45.53% |
| Sharpe ratio | 0.620 | — |
| Sortino ratio | 1.055 | — |
| Calmar ratio | 0.247 | — |
| Up capture | 102.98% | — |
| Down capture | 55.30% | — |
| Beta | 0.716 | — |
| Alpha | 6.75% | — |
| Win rate vs SPY | 52.88% | — |
The down capture of 55.30% is the headline metric. When SPY dropped in a given period, the Germany portfolio fell roughly half as much on average. That asymmetry compounds over 26 years into a meaningful wealth difference. A beta of 0.716 reflects the lower correlation to US equity cycles, driven by the real estate and healthcare components of the rotation.
The Sharpe of 0.620 is strong for a pure equity strategy over this period, particularly given that the mid-2000s included some volatile Tech and Real Estate quarters.
The Technology and Real Estate Cycle
Germany's sector rotation has a structural pattern that doesn't appear in most other markets. Technology and Real Estate tied at exactly 30 quarters each in the top-2 rotation.
| Sector | Quarters in Top 2 |
|---|---|
| Technology | 30 |
| Real Estate | 30 |
| Basic Materials | 23 |
| Energy | 21 |
| Communication Services | 19 |
| Consumer Defensive | 19 |
| Healthcare | 19 |
| Consumer Cyclical | 19 |
| Industrials | 14 |
| Utilities | 13 |
| Financial Services | 1 |
Germany's technology sector is dominated by companies like SAP, Siemens, and Infineon, which are industrial-adjacent technology leaders, not speculative growth stocks. When global tech cycles run, Germany's version runs with lower volatility. The Real Estate component reflects Germany's decades-long property appreciation cycle, which accelerated post-GFC as European rates dropped toward zero and German housing supply stayed constrained.
These two sectors don't typically lead at the same time. The strategy rotated between them across different macro phases. From 2003 to 2007, Real Estate and Basic Materials drove returns. Post-2009, Real Estate resumed leadership as ECB rates fell. Technology returned to dominance in later cycles. The mechanical rotation between these two themes explains why the Sharpe sits at 0.620 despite a 52-year holding period spanning two full market crashes.
Financial Services appeared only once. Germany's financial sector, anchored by Deutsche Bank, struggled with persistently low margins in the European rate environment. The signal correctly avoided it.
When It Worked, When It Didn't
The 2000 dotcom crash: protection from the start. Germany's sector momentum portfolio returned +7.37% in 2000 while SPY fell -10.5%. That's a +17.9% gap in year one. German sectors weren't loaded with US-style speculative tech. The rotation held Basic Materials and Real Estate as US tech imploded.
2001: Heavy tech exposure in Germany. The reversal was sharp. The portfolio fell -29.85% in 2001 while SPY fell -9.17%. Germany's tech sector, including telecoms and software, suffered its own version of the crash. The strategy lagged badly. This is the clearest downside of momentum: when the sector that led into a crash is still in the top-2 signal entering the next period, you take the full hit.
2005 and 2010: What sustained sector trends look like. Two years stand out as the clearest examples of momentum compounding:
| Year | Portfolio | SPY | Excess |
|---|---|---|---|
| 2005 | +55.82% | +7.17% | +48.6% |
| 2010 | +49.48% | +14.31% | +35.2% |
2005 was a Real Estate and Technology momentum year in Germany. Both sectors had sustained multi-quarter trends running. The strategy was fully positioned and captured nearly the entire move. 2010 followed the same pattern as post-GFC recovery drove Real Estate and Basic Materials for consecutive quarters.
2008: The crisis protection result. This is the year that matters most for understanding the structural character of this strategy.
| Year | Portfolio | SPY | Excess |
|---|---|---|---|
| 2008 | -21.68% | -34.31% | +12.6% |
A -21.68% loss still hurts. But in a year where the global financial system nearly collapsed and US equities lost a third of their value, the Germany sector momentum portfolio's relative outperformance of 12.6% is substantial. Germany's Real Estate sector, while it did decline, wasn't leveraged to US subprime. Consumer Defensive was in the rotation. The beta of 0.716 shows up clearly when markets crash.
The AI era drag (2017-2024). Germany's rotation struggled when US mega-cap tech drove the S&P 500 higher through market-cap concentration rather than broad sector rotation.
| Year | Portfolio | SPY | Excess |
|---|---|---|---|
| 2017 | +8.65% | +21.64% | -13.0% |
| 2018 | -10.29% | -5.15% | -5.1% |
| 2019 | +18.42% | +32.31% | -13.9% |
| 2020 | +25.17% | +15.64% | +9.5% |
| 2021 | +21.69% | +31.26% | -9.6% |
| 2022 | -9.4% | -18.99% | +9.6% |
| 2023 | +5.78% | +26.0% | -20.2% |
| 2024 | +26.08% | +25.28% | +0.8% |
2023 was the worst year in the recent period. German sectors didn't benefit from AI momentum the way US mega-caps did. The strategy returned +5.78% while SPY gained 26%. That's a -20.2% gap. But 2022 provided an offset: -9.4% vs -18.99% for SPY (+9.6% relative) as European real estate and defensive sectors held better than US growth equities in a rate-hike environment. And 2024 almost exactly matched SPY (+26.08% vs +25.28%).
Full Annual Returns
| Year | Portfolio (EUR) | SPY (USD) | Excess |
|---|---|---|---|
| 2000 | +7.37% | -10.5% | +17.9% |
| 2001 | -29.85% | -9.17% | -20.7% |
| 2002 | -19.08% | -19.92% | +0.8% |
| 2003 | +44.29% | +24.12% | +20.2% |
| 2004 | +17.04% | +10.24% | +6.8% |
| 2005 | +55.82% | +7.17% | +48.6% |
| 2006 | +20.21% | +13.65% | +6.6% |
| 2007 | +16.77% | +4.4% | +12.4% |
| 2008 | -21.68% | -34.31% | +12.6% |
| 2009 | +34.85% | +24.73% | +10.1% |
| 2010 | +49.48% | +14.31% | +35.2% |
| 2011 | -5.23% | +2.46% | -7.7% |
| 2012 | +17.15% | +17.09% | +0.1% |
| 2013 | +32.35% | +27.77% | +4.6% |
| 2014 | +28.85% | +14.5% | +14.4% |
| 2015 | +31.07% | -0.12% | +31.2% |
| 2016 | +11.65% | +14.45% | -2.8% |
| 2017 | +8.65% | +21.64% | -13.0% |
| 2018 | -10.29% | -5.15% | -5.1% |
| 2019 | +18.42% | +32.31% | -13.9% |
| 2020 | +25.17% | +15.64% | +9.5% |
| 2021 | +21.69% | +31.26% | -9.6% |
| 2022 | -9.4% | -18.99% | +9.6% |
| 2023 | +5.78% | +26.0% | -20.2% |
| 2024 | +26.08% | +25.28% | +0.8% |
| 2025 | +16.46% | +17.88% | -1.4% |
The early period (2000-2015) shows consistent alpha. The exceptions are 2001 (tech crash follow-through) and 2011 (European debt crisis hit German materials and energy). Post-2015, the pattern is more mixed, with strong relative years in 2020, 2022, and 2024 offset by underperformance in 2017, 2019, 2021, and 2023.
Limitations
Currency mismatch. Returns are in EUR. Non-European investors face EUR/USD exchange rate exposure on top of equity volatility. The comparison to SPY (USD) is illustrative, not a direct like-for-like.
The 2001 lesson. A -29.85% year, 20.7% worse than SPY, is a sharp reminder that momentum can carry you into a crash. If the signal was positioned in Germany's tech-telecom complex heading into 2001, the strategy took the full drawdown before rotating out.
Max drawdown. -52.85% isn't a comfortable number. The GFC and the European debt crisis together put pressure on the strategy in multiple consecutive years. Investors need to be prepared to hold through multi-year drawdown and recovery cycles.
Sector concentration. With an average of 64.6 stocks across just 2 sectors, the portfolio is more concentrated than US or India versions of this strategy. Position-level diversification is thinner, which amplifies single-sector events.
AI era underperformance. Germany didn't benefit from the US AI equity wave. The 2023 and 2019 underperformance reflects a genuine structural gap: European sector rotation doesn't capture the mega-cap tech concentration effect driving S&P 500 returns. If that concentration persists, the EUR vs USD comparison may widen further.
Win rate. 52.88% annual win rate against SPY is modest. Expect multi-year underperformance periods, particularly in years where US mega-cap tech dominates index returns.
Run It Yourself
Explore the data behind this analysis on Ceta Research. Query our financial data warehouse with SQL, build custom screens, and run your own backtests across 70,000+ stocks on 20 exchanges.
Data: Ceta Research (FMP financial data warehouse). Universe: XETRA (Germany). Period: 2000-2025 (26 years), quarterly rebalance, returns in EUR. Past performance doesn't guarantee future results. This is educational content, not investment advice.
Part of the Sector Momentum Rotation series. US flagship blog


