Value-Momentum on German Stocks: 8.17% CAGR, +3.11% vs DAX
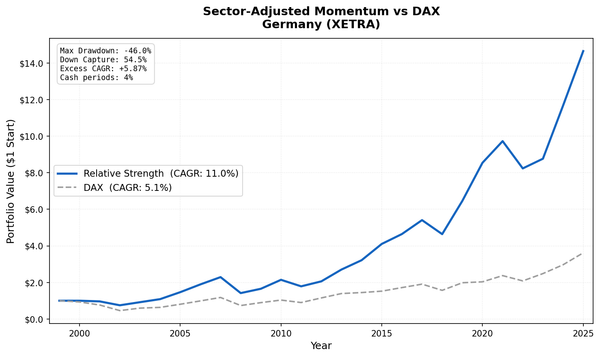
Value-momentum composite on XETRA from 2002 to 2025. 8.17% CAGR with +3.11% excess over DAX and 47.86% down capture against the local index. Mittelstand industrials fit the screen.

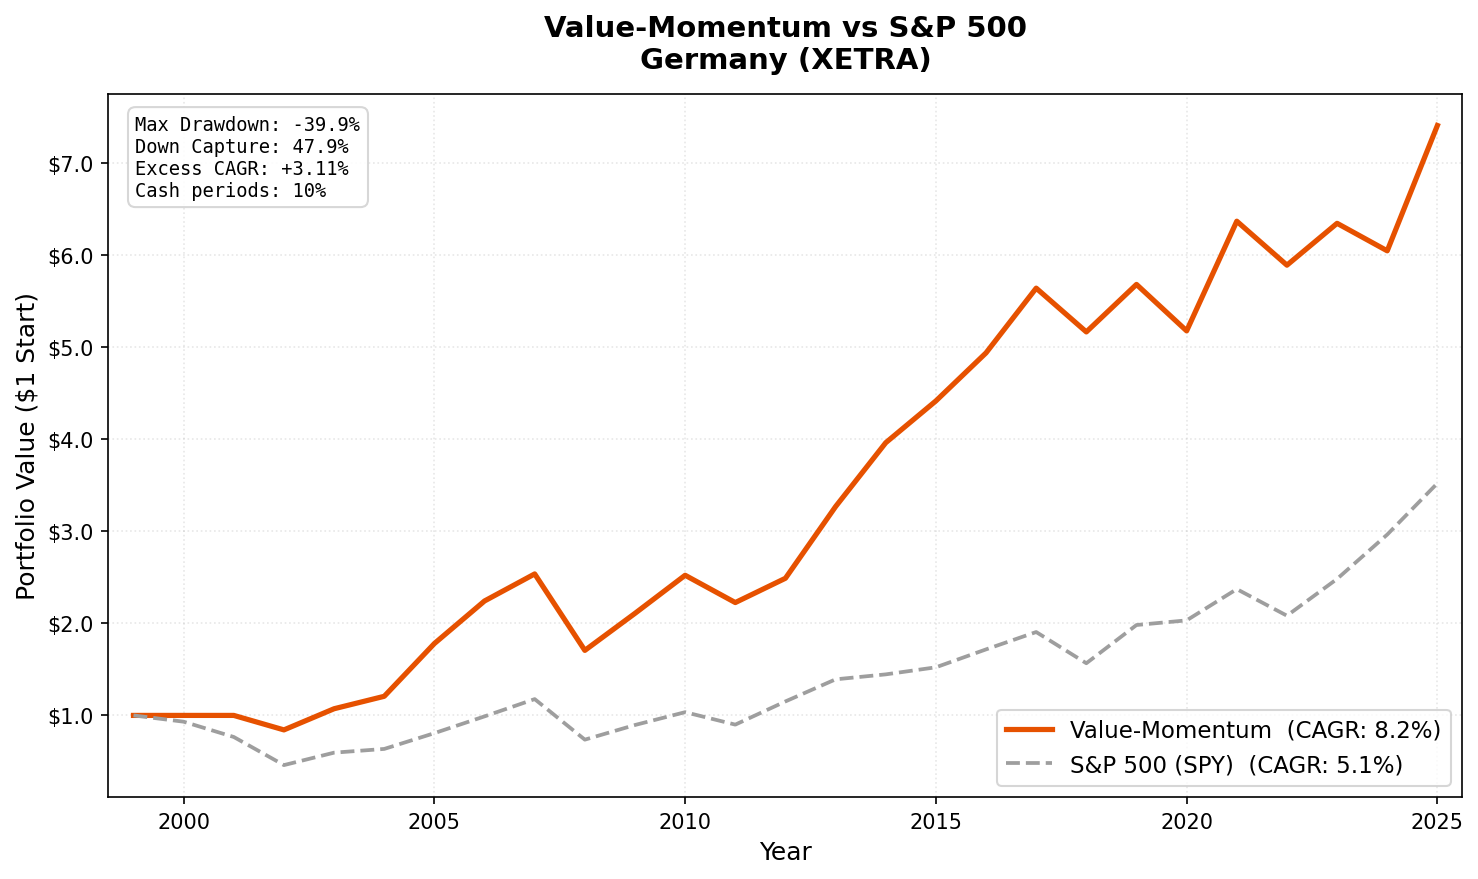
Germany produced 8.17% CAGR with +3.11% excess over the DAX. The Sharpe of 0.387 is solid, and the strategy held up well in most downturns, though the -39.90% max drawdown is deeper than some other exchanges in the study.
Contents
Data: FMP financial data warehouse, 2000–2025. Updated May 2026.
Method
| Parameter | Value |
|---|---|
| Universe | XETRA (Frankfurt Electronic Exchange) |
| Filters | P/E 0-20, ROE > 10%, D/E < 1.0 |
| Ranking | 12-month momentum, composite percentile |
| Rebalancing | Semi-annual (January, July) |
| Holding period | 6 months |
| Max positions | 30 stocks, equal weight |
| Cash rule | Fewer than 10 qualifying stocks |
| Market cap | > EUR 500M (~$545M USD) |
| Data source | FMP via Ceta Research warehouse |
| Execution | Next-day close (MOC execution model) |
| Benchmark | DAX (^GDAXI) |
| Period | 2000-2025 (effective: 2002-2025) |
Based on Asness, Moskowitz, and Pedersen (2013). For the full methodology, see our US flagship post.
The Screen
-- Value-Momentum Germany (XETRA) Screen
-- Run at: cetaresearch.com/data-explorer?q=4TPFeBzoki

SELECT
    k.symbol,
    p.companyName,
    f.priceToEarningsRatioTTM as pe_ratio,
    k.returnOnEquityTTM * 100 as roe_pct,
    f.debtToEquityRatioTTM as debt_to_equity,
    k.marketCap / 1e9 as market_cap_billions
FROM key_metrics_ttm k
JOIN financial_ratios_ttm f ON k.symbol = f.symbol
JOIN profile p ON k.symbol = p.symbol
WHERE f.priceToEarningsRatioTTM > 0
    AND f.priceToEarningsRatioTTM < 20
    AND k.returnOnEquityTTM > 0.10
    AND f.debtToEquityRatioTTM >= 0
    AND f.debtToEquityRatioTTM < 1.0
    AND k.marketCap > 500e6
    AND p.exchange IN ('XETRA')
ORDER BY f.priceToEarningsRatioTTM ASC
LIMIT 100
What We Found
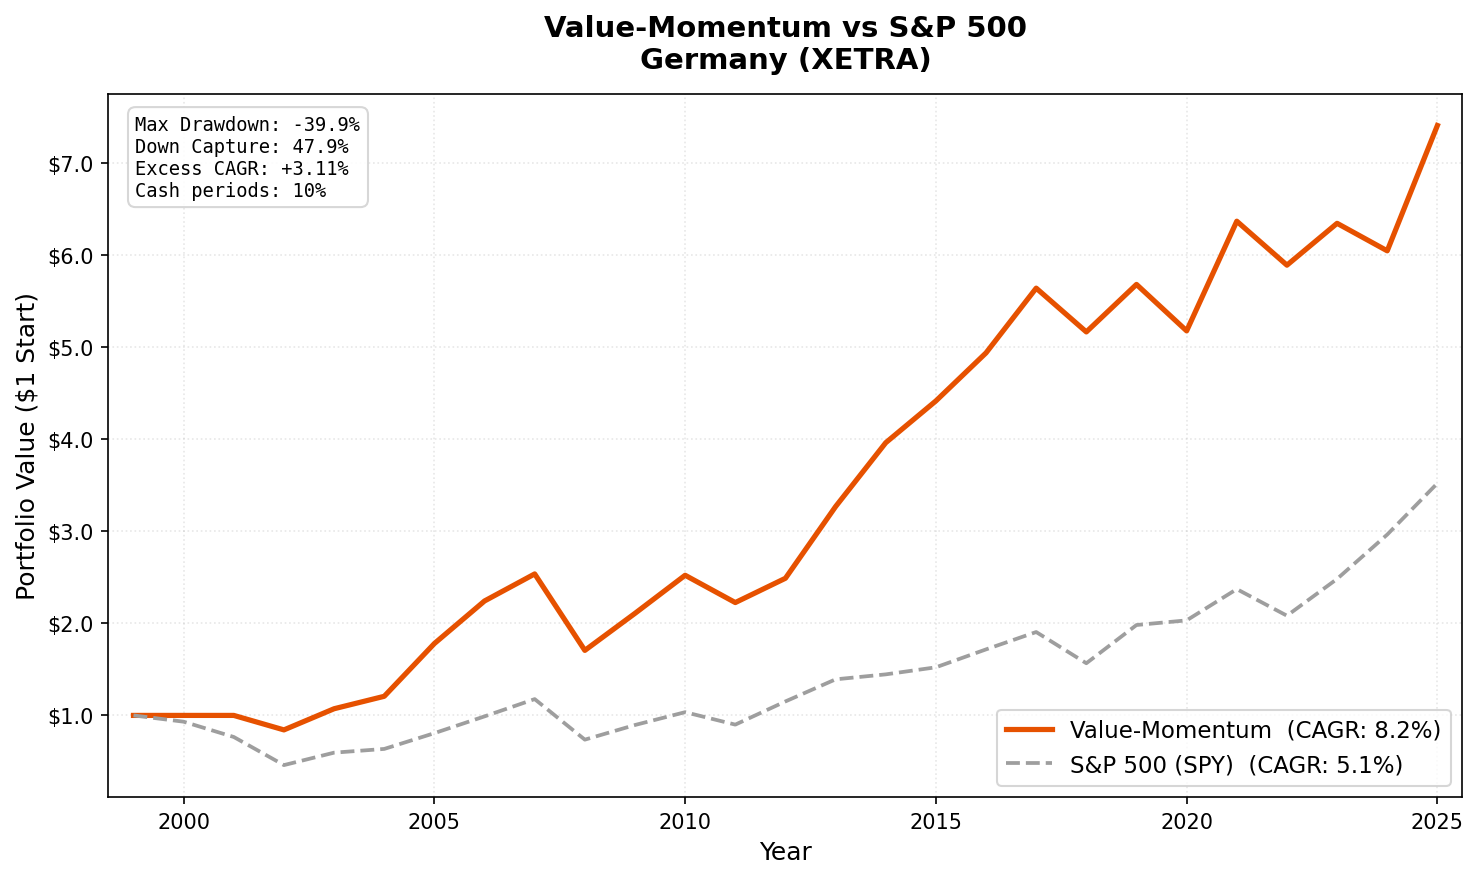
Full period summary (2002-2025):
| Metric | Value-Momentum | DAX (^GDAXI) |
|---|---|---|
| CAGR | 8.17% | 5.06% |
| Excess vs DAX | +3.11% | — |
| Max Drawdown | -39.90% | — |
| Sharpe Ratio | 0.387 | — |
| Sortino Ratio | 0.661 | — |
| Up Capture | 89.19% | 100% |
| Down Capture | 47.86% | 100% |
| Beta | 0.686 | 1.0 |
| Alpha | 4.07% | — |
| Win Rate | 56.86% | — |
| Cash Periods | 5 of 51 | — |
| Avg Stocks | 28.0 | — |
The +3.11% excess over the DAX shows the value-momentum screen adds real alpha in this market. Down capture of 47.86% is among the lowest in the study: when the DAX fell, this portfolio absorbed less than half the loss. The steady accumulation of alpha across most periods makes it a useful component of a multi-exchange allocation.
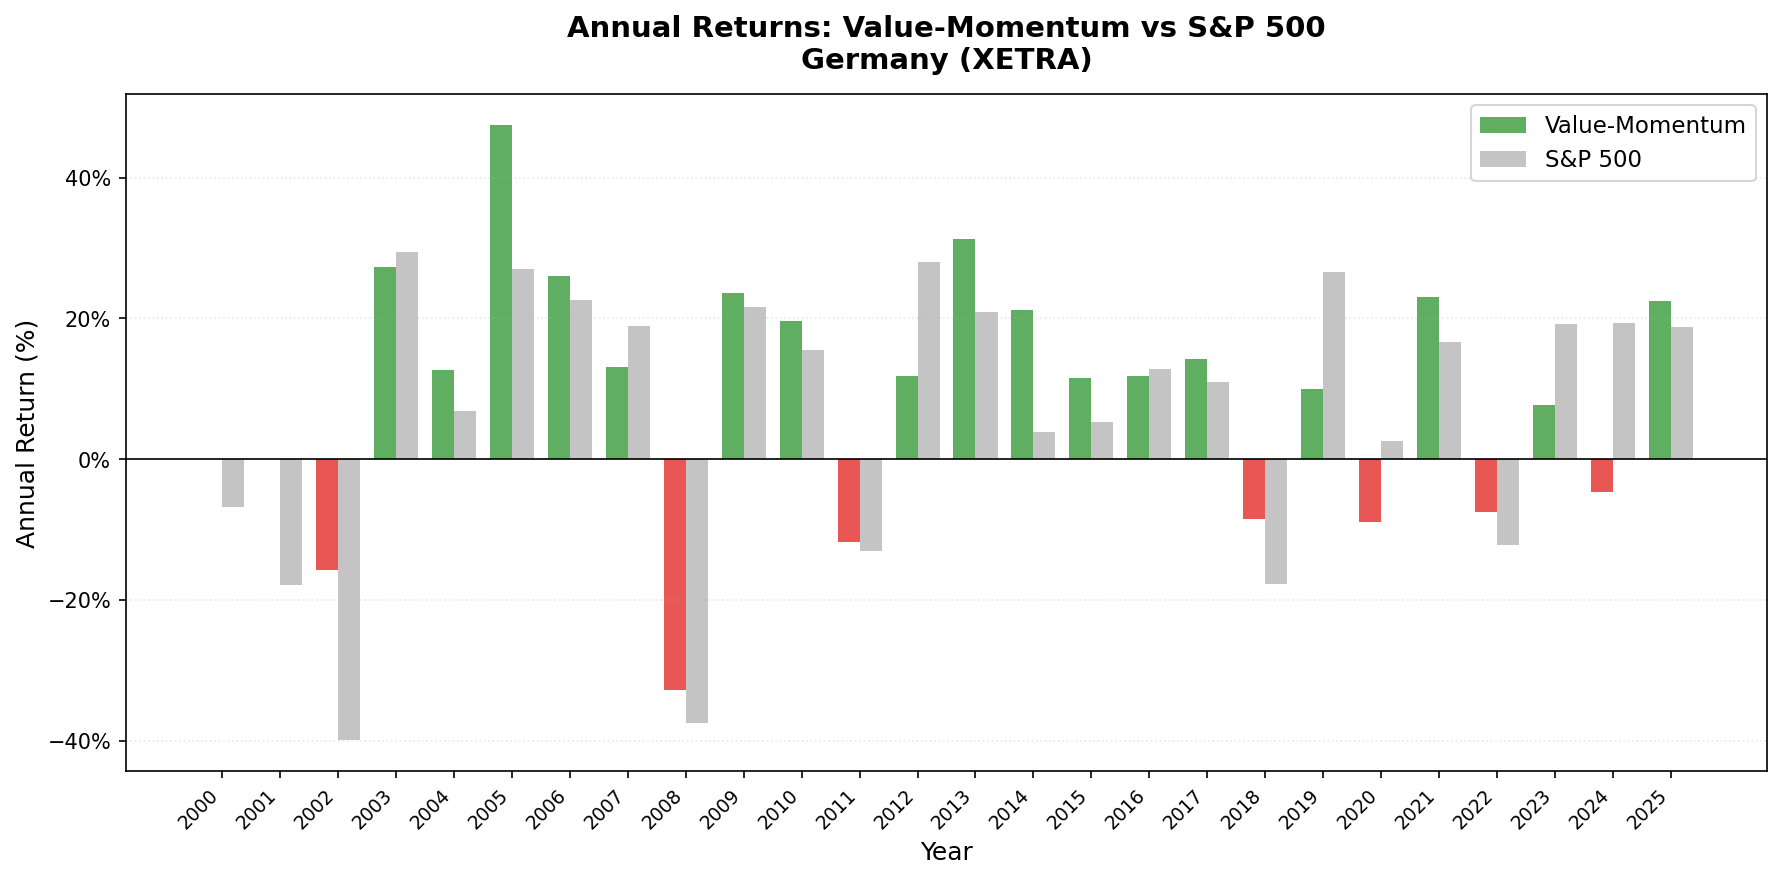
Year-by-year results:
| Year | Value-Momentum | DAX | Notes |
|---|---|---|---|
| 2000 | 0.00% | -6.83% | Cash |
| 2001 | 0.00% | -17.84% | Cash |
| 2002 | -15.74% | -39.92% | First invested year, fell less than DAX |
| 2003 | +27.28% | +29.42% | |
| 2004 | +12.62% | +6.79% | |
| 2005 | +47.50% | +26.99% | Best year |
| 2006 | +25.96% | +22.59% | |
| 2007 | +13.10% | +18.98% | |
| 2008 | -32.75% | -37.44% | Lost less than the DAX |
| 2009 | +23.59% | +21.62% | |
| 2010 | +19.63% | +15.57% | |
| 2011 | -11.76% | -13.08% | Eurozone sovereign debt crisis |
| 2012 | +11.86% | +28.03% | |
| 2013 | +31.28% | +20.84% | |
| 2014 | +21.23% | +3.88% | |
| 2015 | +11.46% | +5.31% | |
| 2016 | +11.82% | +12.79% | |
| 2017 | +14.24% | +10.98% | |
| 2018 | -8.43% | -17.80% | Lost less than DAX |
| 2019 | +9.99% | +26.52% | |
| 2020 | -8.88% | +2.55% | COVID impact |
| 2021 | +23.01% | +16.71% | |
| 2022 | -7.50% | -12.18% | Outperformed during rate shock |
| 2023 | +7.72% | +19.19% | |
| 2024 | -4.71% | +19.41% | |
| 2025 | +22.52% | +18.80% | YTD |
Key Observations
Germany's Mittelstand fits the value-momentum screen. Germany's economy is built on mid-cap industrial companies: precision engineering, automotive suppliers, specialty chemicals, healthcare equipment. These businesses trade at reasonable P/E ratios, maintain strong ROE through operational excellence, and keep leverage low. The value-momentum screen naturally gravitates toward this profile. The 2005 result (+47.50%) and the steady mid-teens returns from 2013-2015 (+31.28%, +21.23%, +11.46%) reflect periods when Germany's industrial base was firing on all cylinders.
2008: -32.75%. The P/E < 20 filter kept the portfolio out of the overpriced financial stocks that suffered worst. German industrial companies, while cyclical, had more conservative balance sheets. The D/E < 1.0 filter reinforced this. Still, the -39.90% max drawdown shows the strategy took heavy losses during the crisis.
2022: -7.50%. Germany's value portfolio of industrials and consumer companies absorbed the rate shock with a modest loss. This was one of the strategy's better defensive showings.
Limitations
Returns are in EUR. The euro has fluctuated against the US dollar over this period, ranging from rough parity to $1.60. International investors face currency risk, though EUR/USD has been more stable than most emerging market currencies.
+3.11% excess vs the DAX is solid but not spectacular. After transaction costs, some of this excess narrows. The case for Germany is a combination of reasonable alpha and a market structure that suits the value-momentum screen.
Win rate is 56.86%. The portfolio outperforms the DAX more often than not, with down capture of 47.86% adding meaningful asymmetry.
5 cash periods. All in 2000-2001 and a few scattered later periods. Data coverage is solid from 2002 onward.
Eurozone integration risk. Germany's economy is deeply embedded in the eurozone. ECB policy, southern European sovereign risk, and EU regulatory changes all affect the portfolio. The 2011 eurozone crisis showed this clearly (-11.76%).
Takeaway
Value-momentum on XETRA produced 8.17% CAGR with +3.11% excess over the DAX. Germany's industrial economy generates a natural supply of the companies this screen selects: profitable mid-caps with reasonable valuations and conservative balance sheets. The 47.86% down capture vs DAX means the strategy absorbs less than half of local index drawdowns, making it a useful defensive component of a multi-exchange portfolio.
Part of a Series
Data: Ceta Research. FMP financial data warehouse, 2000-2025.
Past performance does not guarantee future results. This is research content, not investment advice.