Value-Momentum on Hong Kong Stocks: 9.88% CAGR, +8.57% Excess Return vs Hang Seng
Value-momentum composite on HKSE from 2001 to 2025. 9.88% CAGR with +8.57% excess over Hang Seng. Deep drawdowns (-61.79%) but strong recoveries. Only 2 cash periods.

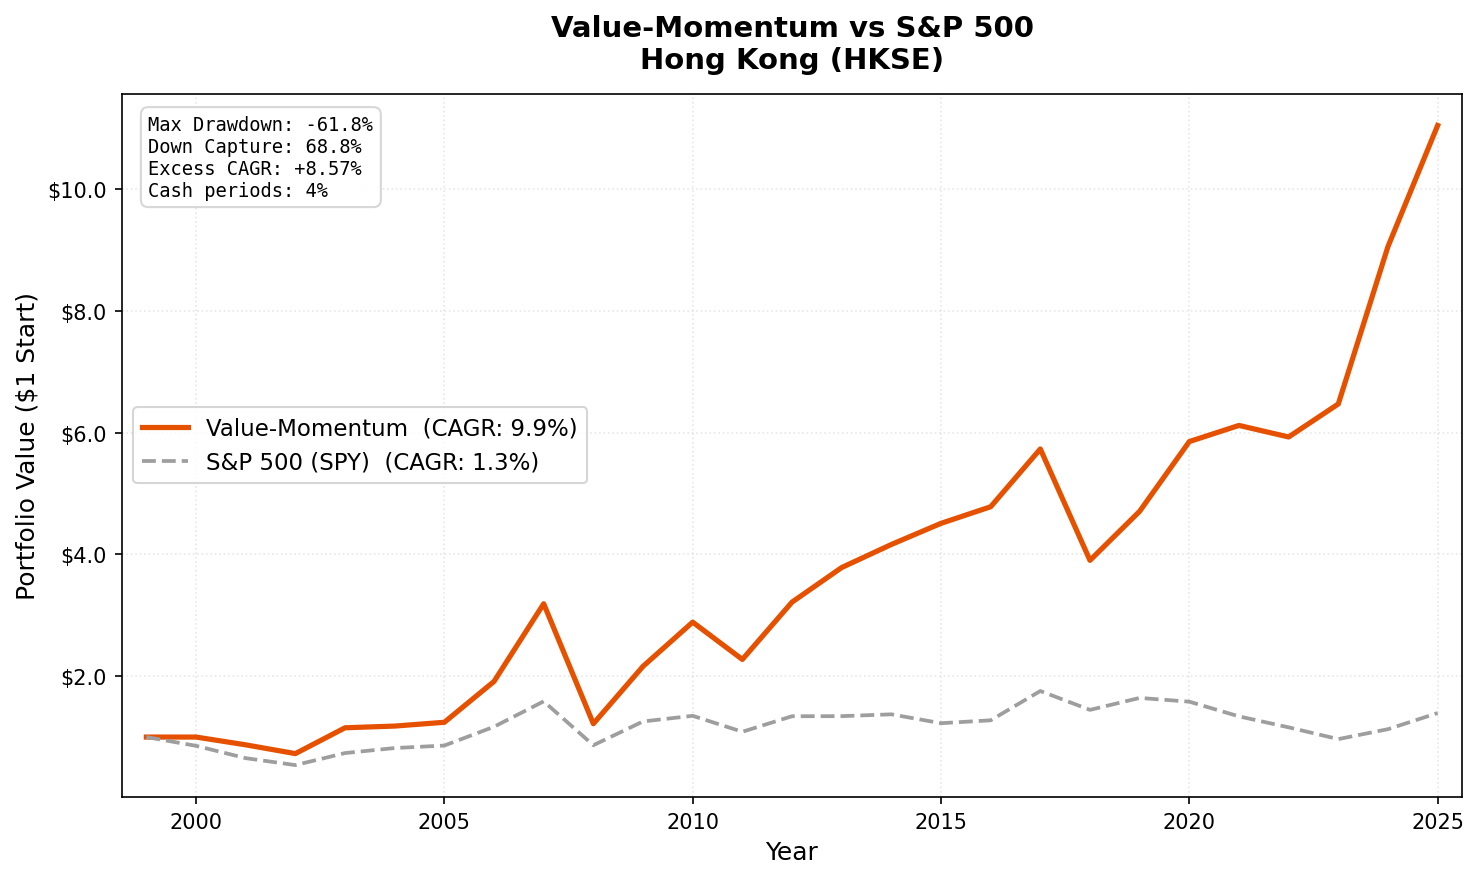
Hong Kong is a boom-bust market. The value-momentum composite captured that pattern with 9.88% CAGR from 2001 to 2025, generating +8.57% excess return over the Hang Seng Index. The path was rough: max drawdown hit -61.79% in 2008. The 2006-2007 boom delivered +54.00% and +66.71%. The 2024-2025 recovery added +39.95% and +21.96%.
Contents
This isn't a smooth compounder. It's a cyclical market that rewards patience and punishes weak hands. But measured against its local benchmark, the alpha is substantial.
Data: FMP financial data warehouse, 2000–2025. Updated May 2026.
Method
| Parameter | Value |
|---|---|
| Universe | HKSE (Hong Kong Stock Exchange) |
| Filters | P/E 0-20, ROE > 10%, D/E < 1.0 |
| Ranking | 12-month momentum, composite percentile |
| Rebalancing | Semi-annual (January, July) |
| Holding period | 6 months |
| Max positions | 30 stocks, equal weight |
| Cash rule | Fewer than 10 qualifying stocks |
| Market cap | > HK$2B (~$256M USD) |
| Data source | FMP via Ceta Research warehouse |
| Execution | Next-day close (MOC execution model) |
| Transaction costs | Size-tiered (0.1-0.5% one-way) |
| Benchmark | Hang Seng Index (^HSI) |
| Period | 2000-2025 (effective: 2001-2025) |
Based on Asness, Moskowitz, and Pedersen (2013). For the full methodology, see our US flagship post.
The Screen
-- Value-Momentum Hong Kong (HKSE) Screen
-- Run at: cetaresearch.com/data-explorer?q=7_dr5lIX84

SELECT
    k.symbol,
    p.companyName,
    f.priceToEarningsRatioTTM as pe_ratio,
    k.returnOnEquityTTM * 100 as roe_pct,
    f.debtToEquityRatioTTM as debt_to_equity,
    k.marketCap / 1e9 as market_cap_billions
FROM key_metrics_ttm k
JOIN financial_ratios_ttm f ON k.symbol = f.symbol
JOIN profile p ON k.symbol = p.symbol
WHERE f.priceToEarningsRatioTTM > 0
    AND f.priceToEarningsRatioTTM < 20
    AND k.returnOnEquityTTM > 0.10
    AND f.debtToEquityRatioTTM >= 0
    AND f.debtToEquityRatioTTM < 1.0
    AND k.marketCap > 2e9
    AND p.exchange IN ('HKSE')
ORDER BY f.priceToEarningsRatioTTM ASC
LIMIT 100
What We Found
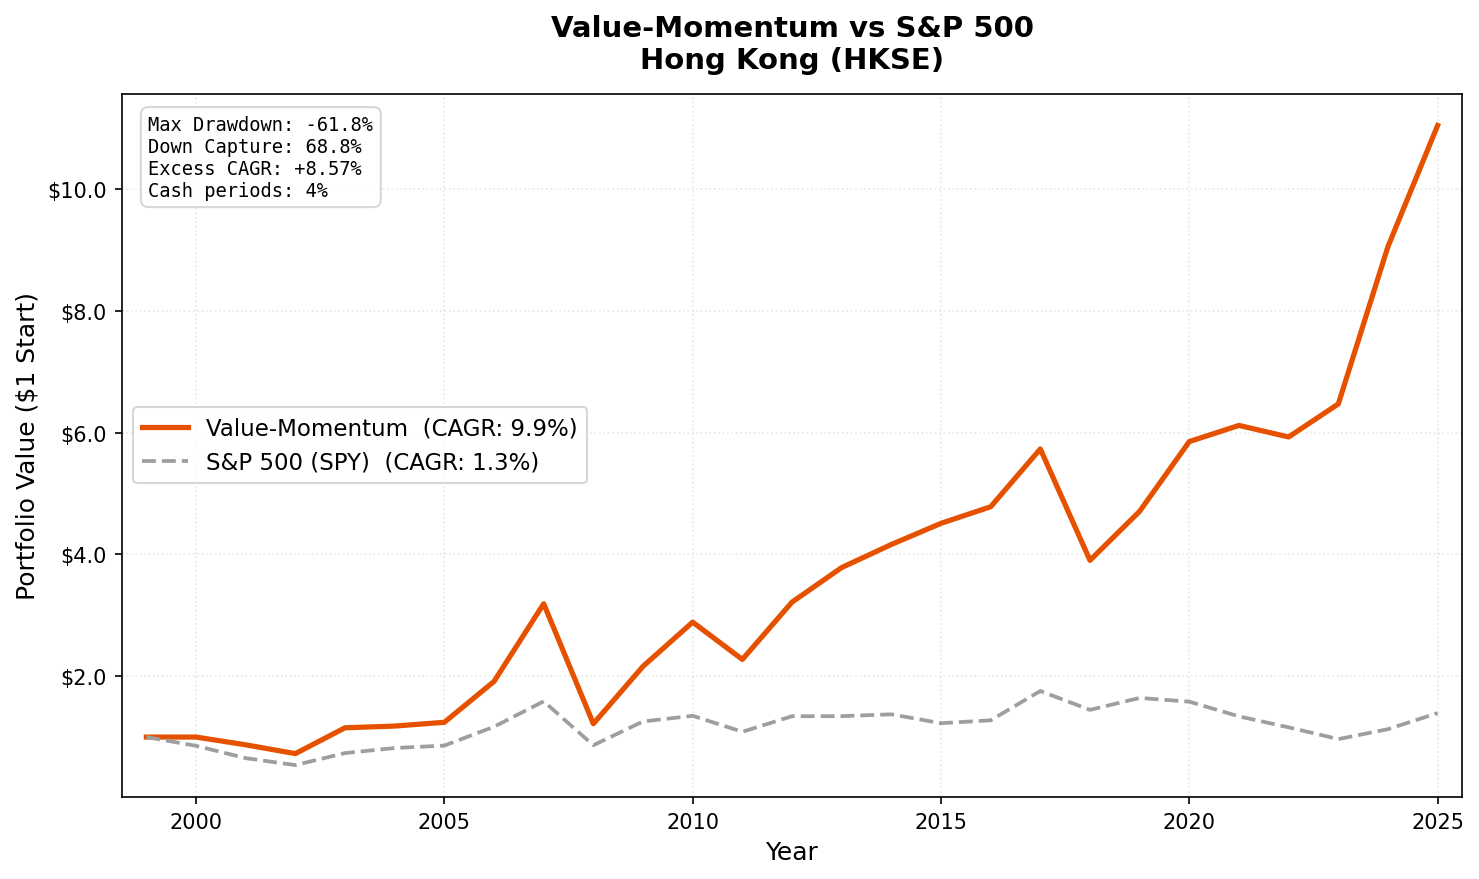
Full period summary (2001-2025):
| Metric | Value-Momentum | Hang Seng (^HSI) |
|---|---|---|
| CAGR | 9.88% | 1.31% |
| Total Return | 1,005% | — |
| Max Drawdown | -61.79% | — |
| Volatility | 25.51% | — |
| Sharpe Ratio | 0.270 | — |
| Sortino Ratio | 0.464 | — |
| Excess vs Hang Seng | +8.57% | — |
| Up Capture | 149.15% | 100% |
| Down Capture | 68.78% | 100% |
| Beta | 1.071 | 1.0 |
| Alpha | 8.69% | — |
| Win Rate | 70.59% | — |
| Cash Periods | 2 of 51 | — |
| Avg Stocks | 25.0 | — |
Only 2 cash periods. Hong Kong's exchange is deep enough that the screen almost always finds 10+ qualifying stocks. The +8.57% excess return over the Hang Seng is the largest alpha figure in the study, reflecting how poorly the broad Hong Kong market has performed over this period while value-momentum names picked up the slack.
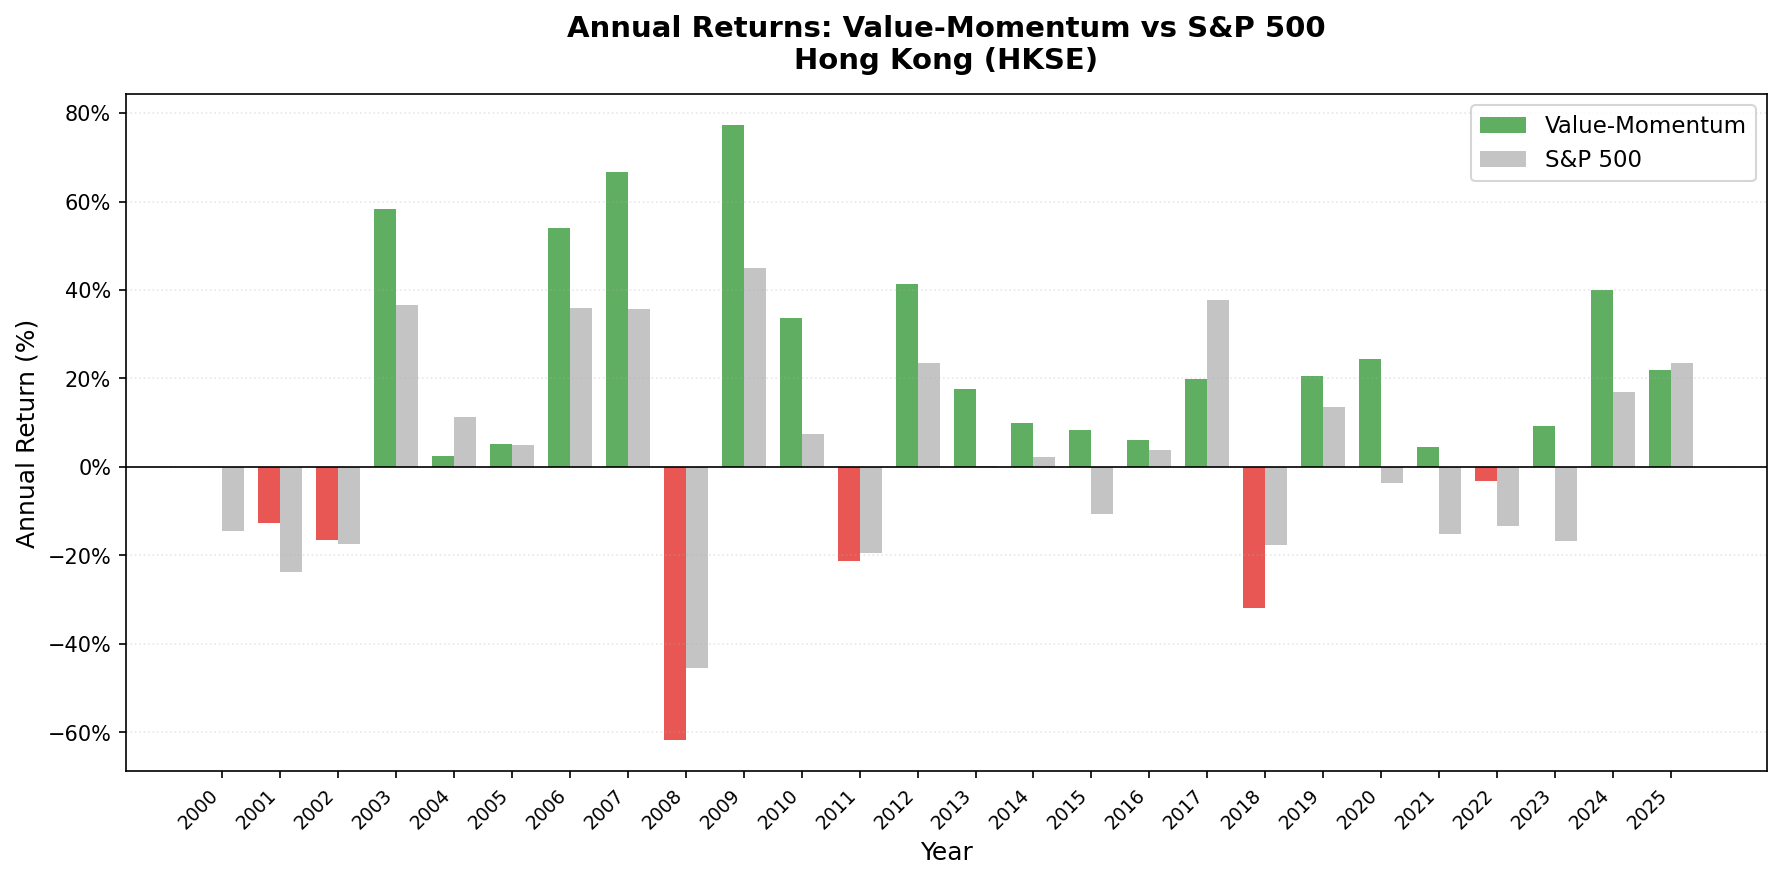
Year-by-year results:
| Year | Value-Momentum | Hang Seng | Notes |
|---|---|---|---|
| 2000 | 0.00% | -14.39% | Cash |
| 2001 | -12.77% | -23.67% | |
| 2002 | -16.55% | -17.49% | |
| 2003 | +58.33% | +36.69% | |
| 2004 | +2.43% | +11.22% | |
| 2005 | +5.27% | +4.97% | |
| 2006 | +54.00% | +35.90% | China boom spills into HK |
| 2007 | +66.71% | +35.70% | Peak euphoria |
| 2008 | -61.79% | -45.42% | Max drawdown |
| 2009 | +77.35% | +45.07% | Recovery |
| 2010 | +33.59% | +7.39% | |
| 2011 | -21.22% | -19.45% | |
| 2012 | +41.38% | +23.49% | |
| 2013 | +17.67% | +0.12% | |
| 2014 | +10.01% | +2.22% | |
| 2015 | +8.34% | -10.61% | |
| 2016 | +6.04% | +3.86% | |
| 2017 | +19.85% | +37.76% | |
| 2018 | -31.92% | -17.65% | Trade war fears |
| 2019 | +20.66% | +13.58% | |
| 2020 | +24.32% | -3.75% | COVID divergence |
| 2021 | +4.53% | -15.28% | Regulatory crackdown |
| 2022 | -3.10% | -13.45% | |
| 2023 | +9.15% | -16.66% | |
| 2024 | +39.95% | +16.89% | Stimulus rally |
| 2025 | +21.96% | +23.43% | YTD |
Key Observations
The 2006-2008 cycle tells the whole story. +54.00%, +66.71%, -61.79%. Hong Kong's market is a leveraged play on China's economy. During the mid-2000s boom, mainland capital flooded into Hong Kong-listed value stocks. Momentum concentrated the portfolio in exactly the names benefiting most. Then the global financial crisis wiped out those gains in a single year. A $10,000 investment grew to roughly $27,000 by end of 2007 and fell back to $10,000 by end of 2008.
+8.57% excess over the Hang Seng is the real story. Measured against its local benchmark, value-momentum on HKSE generated the largest alpha figure in the study. The Hang Seng's poor performance over this period, dragged down by property, financials, and tech regulatory crackdowns, means a disciplined value screen had a low bar to clear. But clearing it by 8.6 percentage points annually is still a strong result.
2024-2025 recovery is real. +39.95% in 2024 and +21.96% YTD in 2025. China's stimulus measures in late 2024 drove a re-rating of Hong Kong-listed value stocks. The strategy's momentum component captured the leaders of that rally. Whether this marks the start of a sustained recovery or another boom-bust cycle remains to be seen.
Limitations
-61.79% max drawdown. This is comparable to India's drawdown and is among the deepest of any exchange in the study. Hong Kong's leverage to China macro makes deep drawdowns a recurring feature, not a one-time event. 2018 saw -31.92% on trade war fears alone.
The drawdown path is violent. Hong Kong's value stocks are China-exposed cyclicals. The value filter doesn't provide the same crisis protection here that it does in South Africa or Canada.
Win rate above 50%. At 70.59%, the portfolio wins most semi-annual periods. Combined with the +8.57% annual excess, this is the cleanest within-market alpha in the study.
China regulatory risk. The 2021 regulatory crackdown on tech and education companies froze the market. Value stocks with low P/E weren't directly targeted, but the broader sentiment damage limited returns to just +4.53%.
Takeaway
Value-momentum on HKSE produced 9.88% CAGR with +8.57% excess over the Hang Seng. The strategy works in Hong Kong, but the ride is violent. Deep drawdowns, boom-bust cycles, and high concentration in China-exposed cyclicals make this a position for investors who understand what they're buying: leveraged exposure to China's economic cycle, filtered through a value screen.
The 2024-2025 recovery shows the upside. The 2008 crash shows the cost.
Part of a Series
Data: Ceta Research. FMP financial data warehouse, 2000-2025.
Past performance does not guarantee future results. This is research content, not investment advice.