Value-Momentum on Swedish Stocks: 9.93% CAGR, +7.01% Excess Return vs OMX Stockholm 30
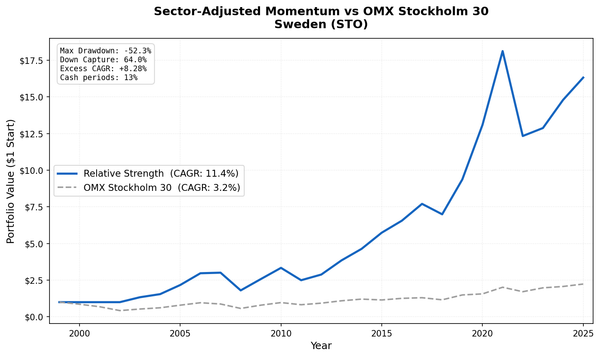
Value-momentum composite on Stockholm Exchange from 2003 to 2025. 9.93% CAGR with +7.01% excess return vs the OMX30, 52% down capture, and a 0.753 Sortino ratio.

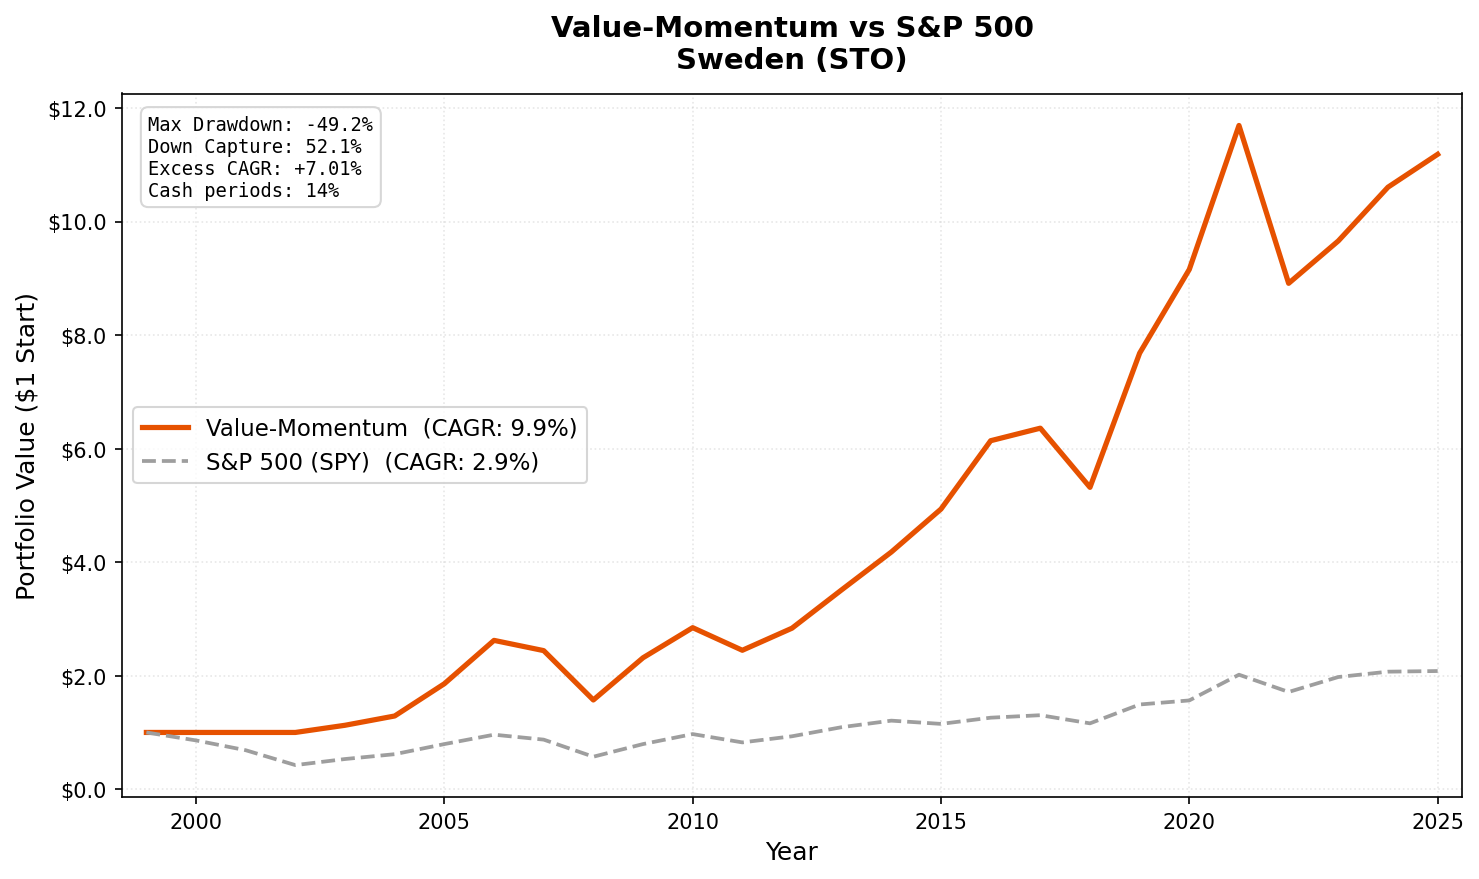
Sweden's industrial base is a natural fit for value-momentum screening. Companies like Atlas Copco, Sandvik, and Volvo are the kind of businesses that show up in value screens: cyclical earnings, reasonable leverage, and strong returns on equity when the cycle cooperates. The momentum overlay captures the ones currently in an earnings upcycle.
Contents
9.93% CAGR from 2003 to 2025. 7.01% excess over the OMX Stockholm 30. The Sortino ratio of 0.753, which adjusts for downside risk only, is among the highest of any exchange in the study.
Data: FMP financial data warehouse, 2000–2025. Updated May 2026.
Method
| Parameter | Value |
|---|---|
| Universe | STO (Stockholm Stock Exchange) |
| Filters | P/E 0-20, ROE > 10%, D/E < 1.0 |
| Ranking | 12-month momentum, composite percentile |
| Rebalancing | Semi-annual (January, July) |
| Holding period | 6 months |
| Max positions | 30 stocks, equal weight |
| Cash rule | Fewer than 10 qualifying stocks |
| Market cap | > 5B SEK (~$460M USD) |
| Data source | FMP via Ceta Research warehouse |
| Execution | Next-day close (MOC execution model) |
| Transaction costs | Size-tiered (0.1-0.5% one-way) |
| Benchmark | OMX Stockholm 30 (^OMXS30) |
| Period | 2000-2025 (effective: 2003-2025) |
Based on Asness, Moskowitz, and Pedersen (2013). For the full methodology, see our US flagship post.
The Screen
-- Value-Momentum Sweden (STO) Screen
-- Run at: cetaresearch.com/data-explorer?q=iqWAp44FEy

SELECT
    k.symbol,
    p.companyName,
    f.priceToEarningsRatioTTM as pe_ratio,
    k.returnOnEquityTTM * 100 as roe_pct,
    f.debtToEquityRatioTTM as debt_to_equity,
    k.marketCap / 1e9 as market_cap_billions
FROM key_metrics_ttm k
JOIN financial_ratios_ttm f ON k.symbol = f.symbol
JOIN profile p ON k.symbol = p.symbol
WHERE f.priceToEarningsRatioTTM > 0
    AND f.priceToEarningsRatioTTM < 20
    AND k.returnOnEquityTTM > 0.10
    AND f.debtToEquityRatioTTM >= 0
    AND f.debtToEquityRatioTTM < 1.0
    AND k.marketCap > 5e9
    AND p.exchange IN ('STO')
ORDER BY f.priceToEarningsRatioTTM ASC
LIMIT 100
What We Found
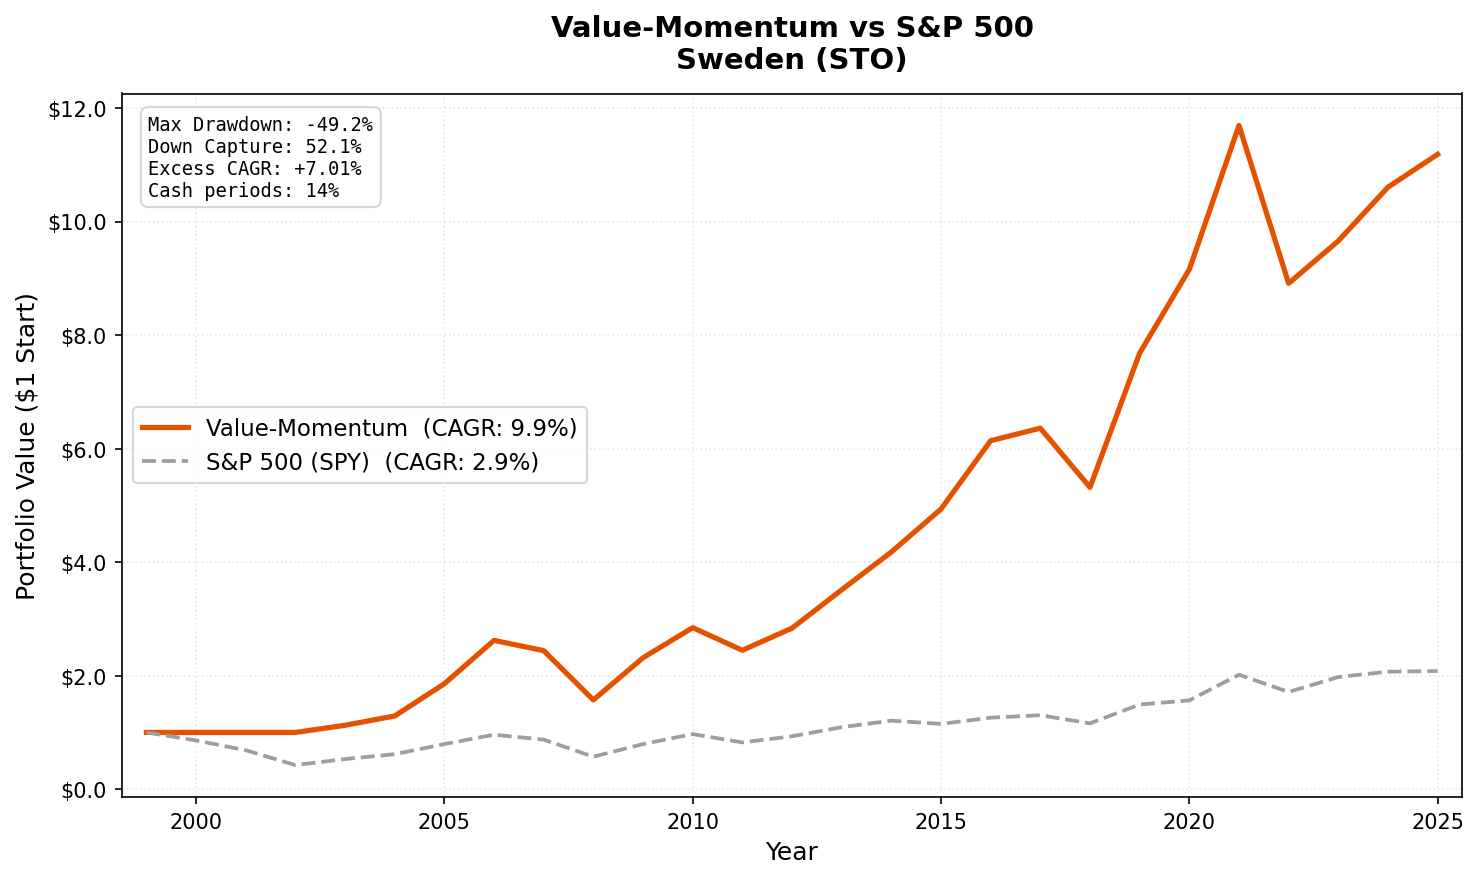
Full period summary (2003-2025):
| Metric | Value-Momentum | OMX Stockholm 30 (^OMXS30) |
|---|---|---|
| CAGR | 9.93% | 2.92% |
| Total Return | 1,018.41% | — |
| Max Drawdown | -49.23% | — |
| Volatility | 18.66% | — |
| Sharpe Ratio | 0.425 | — |
| Sortino Ratio | 0.753 | — |
| Up Capture | 121.98% | 100% |
| Down Capture | 52.15% | 100% |
| Beta | 0.838 | 1.0 |
| Alpha | 7.16% | — |
| Win Rate | 66.67% | — |
| Cash Periods | 7 of 51 | — |
| Avg Stocks | 27.0 | — |
The down capture of 52.15% is the highlight. When the OMX30 fell, this portfolio absorbed about half the decline. Combined with 121.98% up capture, the asymmetry is strong: the strategy participates more in rallies and cushions the falls.
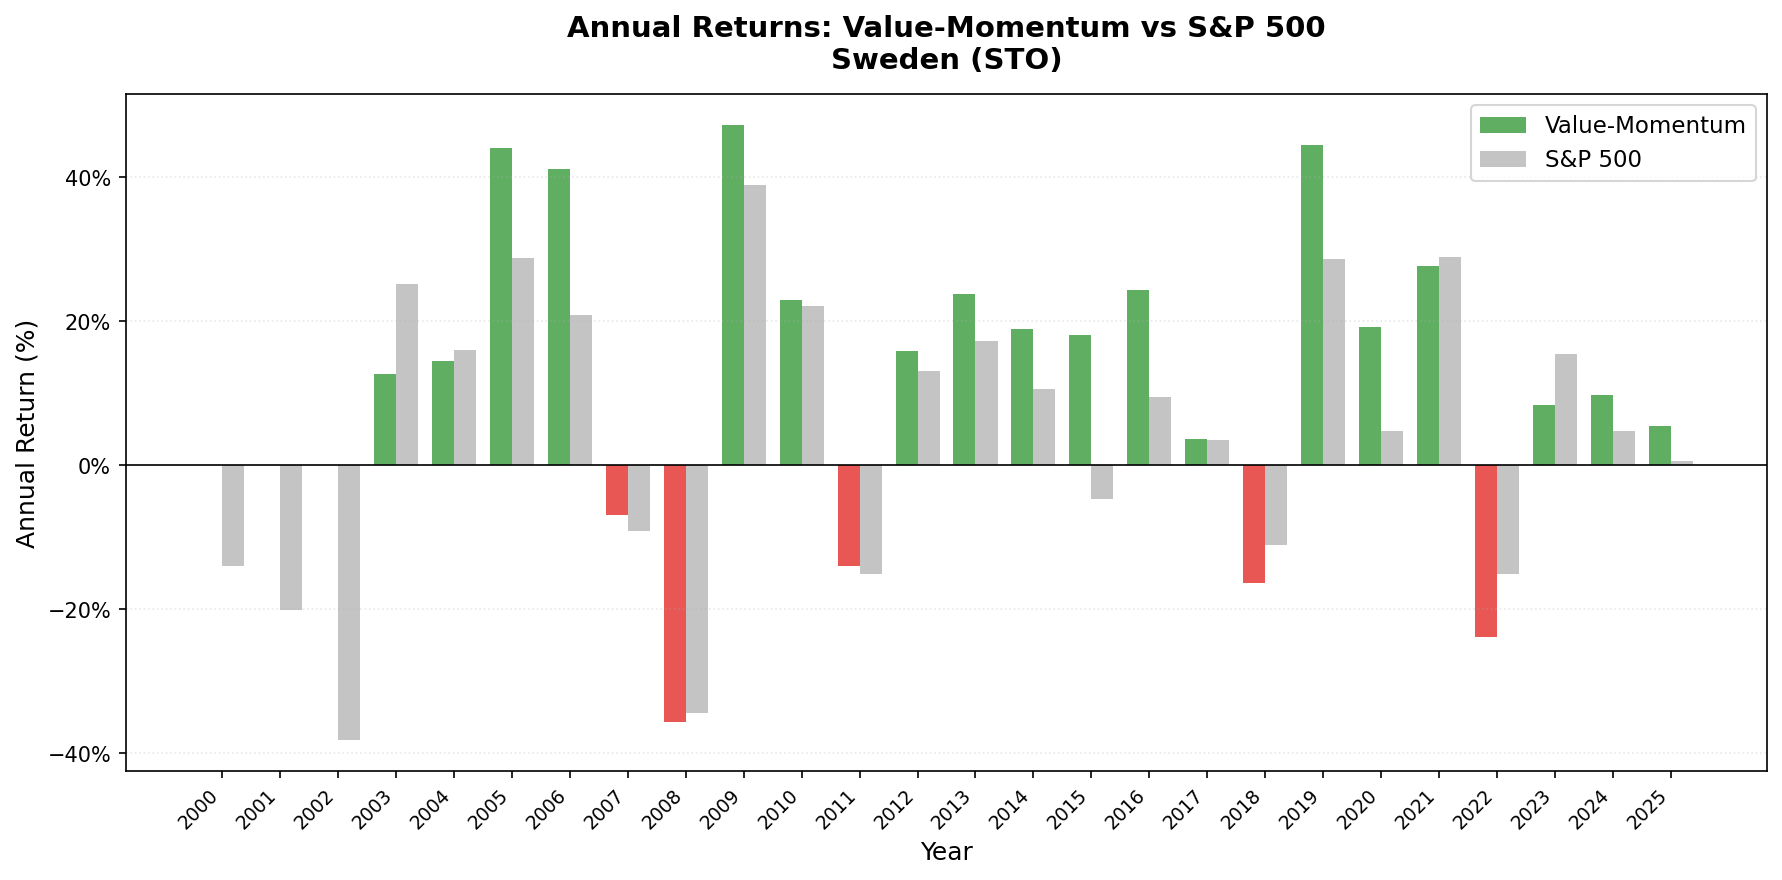
Year-by-year results:
| Year | Value-Momentum | OMX30 | Notes |
|---|---|---|---|
| 2000 | 0.00% | -14.04% | Cash |
| 2001 | 0.00% | -20.09% | Cash |
| 2002 | 0.00% | -38.16% | Cash |
| 2003 | +12.65% | +25.19% | First invested year |
| 2004 | +14.52% | +16.03% | |
| 2005 | +44.04% | +28.84% | |
| 2006 | +41.10% | +20.84% | |
| 2007 | -6.88% | -9.08% | Beat index in downturn |
| 2008 | -35.61% | -34.45% | |
| 2009 | +47.27% | +38.89% | |
| 2010 | +22.92% | +22.14% | |
| 2011 | -14.00% | -15.08% | Eurozone crisis spill |
| 2012 | +15.90% | +13.06% | |
| 2013 | +23.82% | +17.20% | |
| 2014 | +18.96% | +10.53% | |
| 2015 | +18.12% | -4.74% | OMX30 fell, portfolio +18% |
| 2016 | +24.39% | +9.50% | |
| 2017 | +3.60% | +3.47% | |
| 2018 | -16.39% | -11.01% | |
| 2019 | +44.46% | +28.65% | Best year |
| 2020 | +19.20% | +4.80% | |
| 2021 | +27.69% | +28.95% | Matched the index |
| 2022 | -23.78% | -15.07% | Worst relative year |
| 2023 | +8.38% | +15.38% | |
| 2024 | +9.80% | +4.76% | |
| 2025 | +5.46% | +0.54% | YTD |
Key Observations
Sweden's industrial base fits the value-momentum profile. The Stockholm exchange is weighted toward industrials, healthcare, and financial services. These sectors produce the kind of companies the screen targets: reasonable P/E ratios during cyclical troughs, strong ROE from efficient capital allocation, and manageable debt levels. The 2005-2006 period (+44.04%, +41.10%) and the 2019 result (+44.46%) coincide with Swedish industrial upcycles where momentum captured the leaders.
The 2019 result deserves attention. +44.46% was the best single year. Swedish krona weakness made Swedish exporters more competitive, and the portfolio likely concentrated in industrials benefiting from strong order books. This was also a broad global recovery year after the 2018 selloff, and momentum naturally selected the companies bouncing hardest.
66.67% win rate and 52% down capture. The portfolio won two-thirds of semi-annual periods against the OMX30, and when it lost, it absorbed about half the decline. The combination of high win rate and low down capture is the strongest argument for this strategy in Sweden.
Limitations
Returns are in SEK. The Swedish krona has been volatile against the US dollar. International investors face currency risk. The 9.93% CAGR is a local-currency figure.
Eurozone correlation. Sweden isn't in the eurozone but its economy is deeply integrated with the EU. European macro shocks (2011 sovereign debt crisis, 2022 rate shock) pass through directly.
-49.23% max drawdown is severe. Even with 52% down capture overall, the 2008 crash and 2022 drawdown hit hard.
7 cash periods. Data coverage pre-2003 is sparse.
Takeaway
Value-momentum on Stockholm produced 9.93% CAGR with 7.16% annual alpha vs the OMX30 over 22 effective years. The 52% down capture and 66.67% win rate make the case: the strategy reliably beats the local index with less downside participation. Sweden's industrial economy produces a steady supply of the kind of companies this screen targets, reasonably priced, profitable, and low-leverage businesses in cyclical sectors.
Part of a Series
Data: Ceta Research. FMP financial data warehouse, 2000-2025.
Past performance does not guarantee future results. This is research content, not investment advice.