
52-Week Low Quality: 24-Year China Backtest (Shanghai, Shenzhen)


China's equity markets are retail-dominated, sentiment-driven, and structurally disconnected from the fundamentals of individual companies. That makes them a strange testing ground for a quality-filtered 52-week low screen. The result is better than you'd expect.
Contents
CAGR of 7.25% vs the SSE Composite's 3.74%. Excess return of +3.51% per year. Alpha of +3.91%. The strategy genuinely beats the local benchmark over 24 years, with a win rate above 50%. Here's how that works in a market where fundamentals supposedly don't matter.
Data: FMP financial data warehouse, 2000–2025. Updated May 2026 with next-day-close execution and data-quality guards.
Method
Data source: Ceta Research (FMP financial data warehouse) Universe: Shanghai (SHH) + Shenzhen (SHZ), market cap > ¥500M Period: 2002–2025 (95 quarters) Rebalancing: Quarterly (January, April, July, October), equal weight Max stocks: 30, minimum 5 to deploy capital Benchmark: SSE Composite (000001.SS) Cash rule: Hold cash if fewer than 5 stocks qualify Transaction costs: 0.1% per trade (one-way) Filing lag: 45-day lag on all fundamental data
Full methodology: backtests/METHODOLOGY.md
What We Found
| Metric | Portfolio | SSE Composite |
|---|---|---|
| CAGR | 7.25% | 3.74% |
| Total Return | 427.28% | 139.01% |
| Max Drawdown | -55.06% | -66.96% |
| Volatility (ann.) | 30.04% | 28.45% |
| Sharpe Ratio | 0.158 | 0.043 |
| Sortino Ratio | 0.328 | |
| Calmar Ratio | 0.132 | |
| Beta | 0.684 | 1.00 |
| Alpha | +3.91% | |
| Up Capture | 98.81% | |
| Down Capture | 76.7% | |
| Win Rate (vs bench) | 51.58% | |
| Cash Periods | 9/95 | |
| Avg Stocks (when invested) | 26.8 |
The alpha of +3.91% is the standout number. After adjusting for beta, the strategy generated meaningful excess return vs the SSE Composite over 24 years. The win rate of 51.58% means the portfolio beat the benchmark in more than half of all quarters.
The max drawdown of -55.06% is large in absolute terms but better than the SSE Composite's -66.96%. Both the portfolio and the benchmark run at similar volatility (30.04% vs 28.45%), but the portfolio's Sharpe of 0.158 vs the benchmark's 0.043 shows the quality filter is adding value per unit of risk.
The terminal wealth result: $10k grew to roughly $52,728 vs $23,901 in the SSE Composite. The strategy more than doubled the benchmark's terminal wealth.
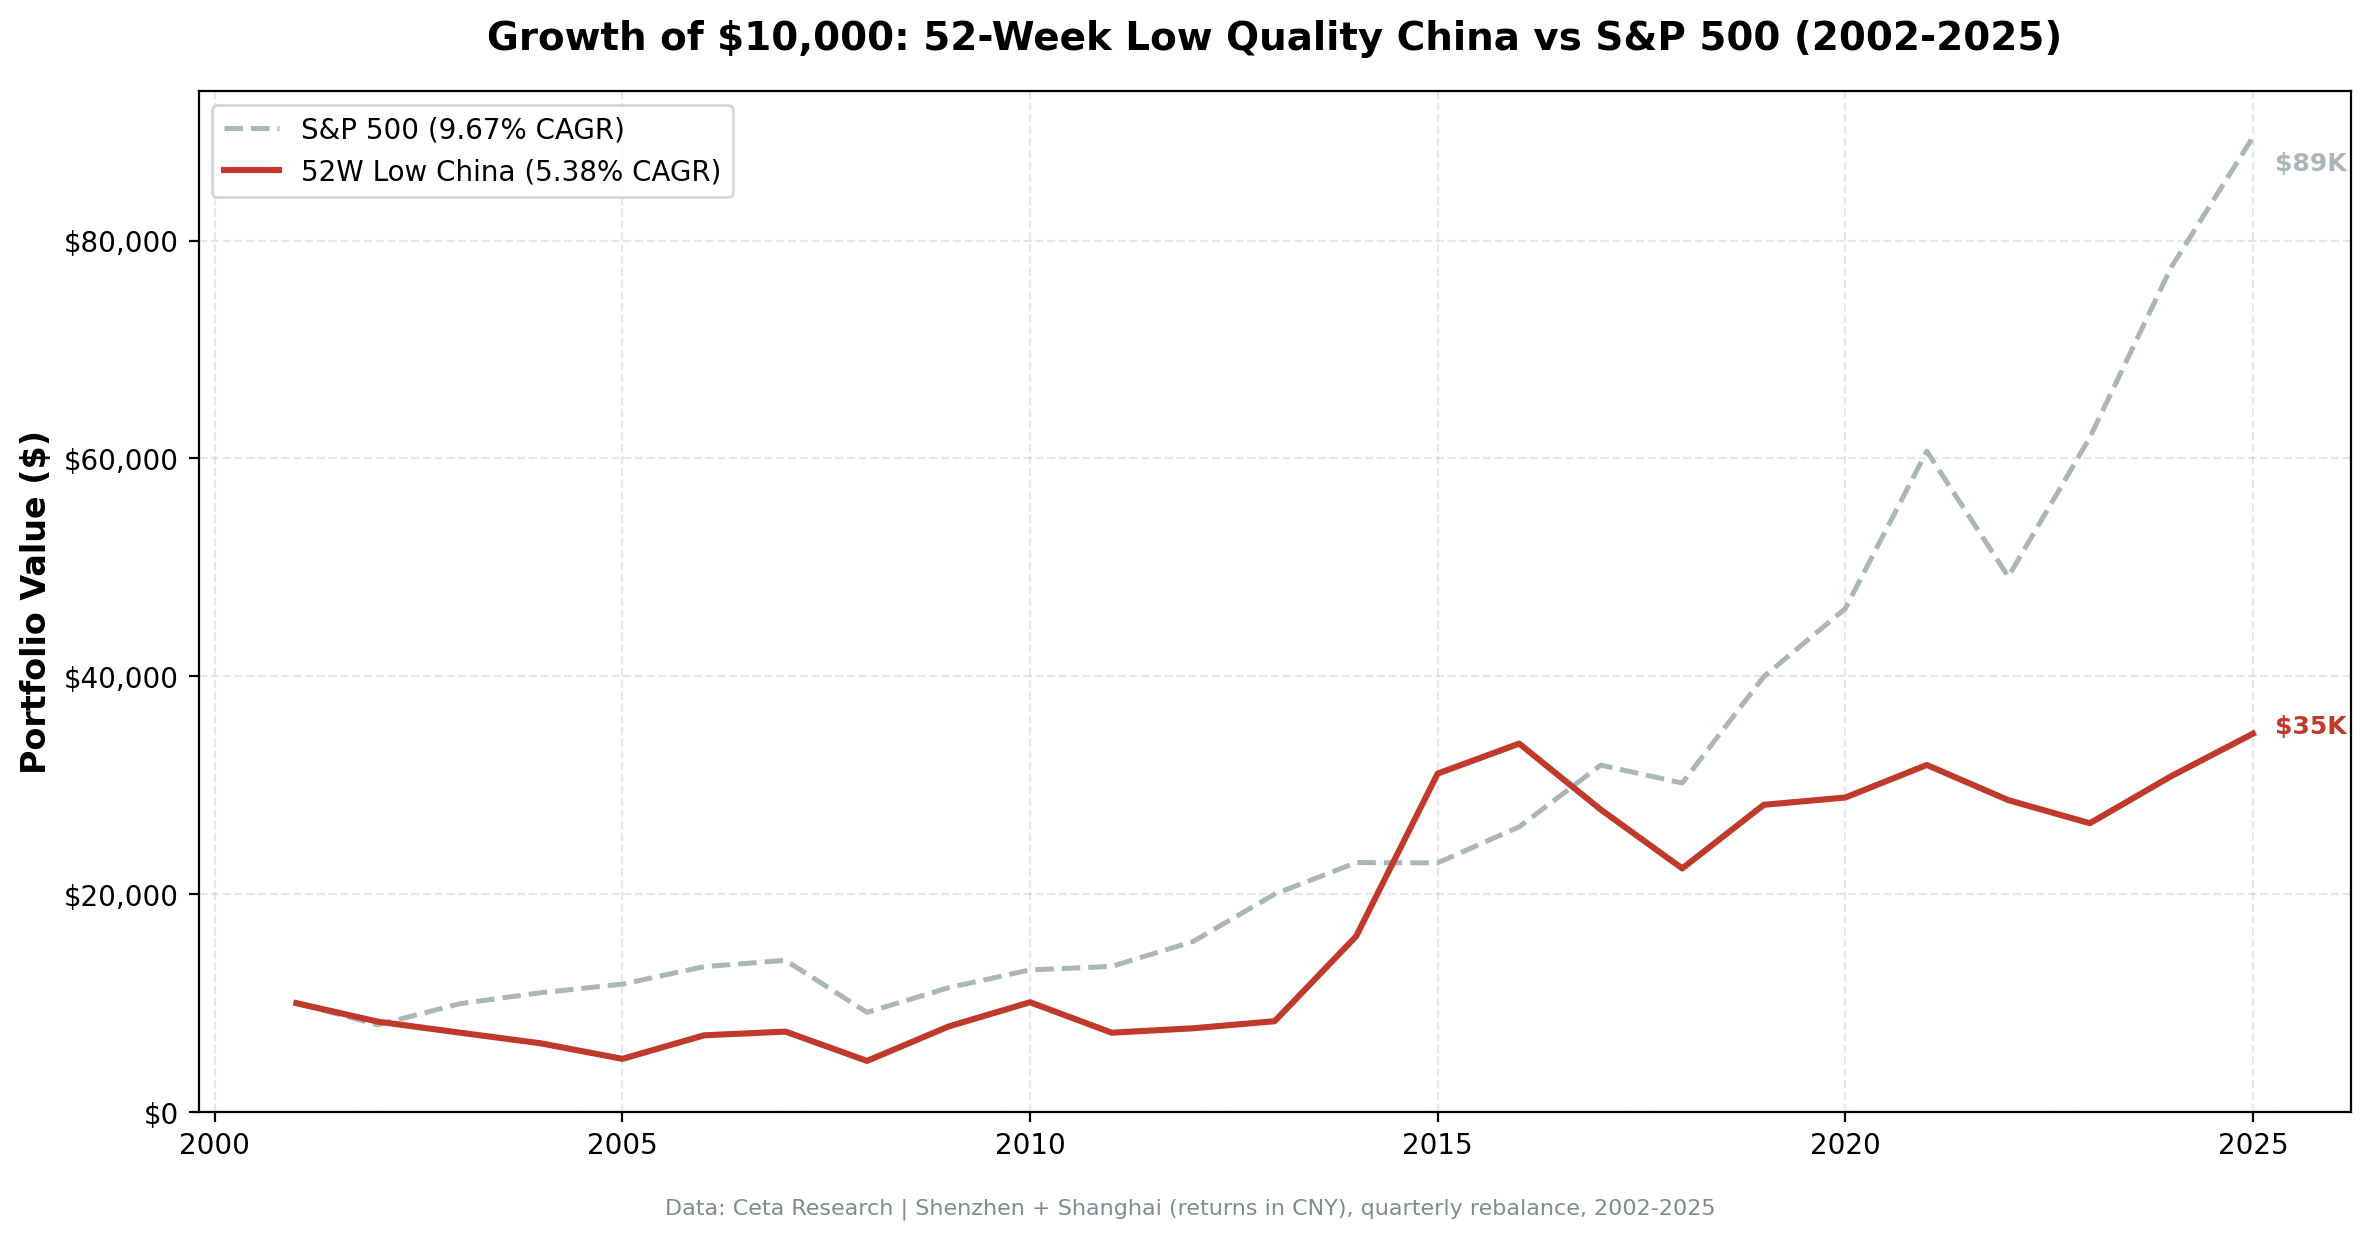
$10k invested in January 2002. China portfolio (blue) reaches roughly $52,728 vs SSE Composite (grey) $23,901 by December 2025.
Year-by-Year
| Year | Portfolio | SSE Composite | Excess |
|---|---|---|---|
| 2002 | -17.74% | -19.77% | +2.03% |
| 2003 | -10.08% | +14.88% | -24.96% |
| 2004 | -16.21% | -16.52% | +0.31% |
| 2005 | -19.44% | -6.75% | -12.69% |
| 2006 | +45.17% | +129.96% | -84.79% |
| 2007 | +5.00% | +94.16% | -89.16% |
| 2008 | -30.22% | -64.33% | +34.11% |
| 2009 | +98.00% | +72.47% | +25.52% |
| 2010 | +24.94% | -12.06% | +37.00% |
| 2011 | -27.61% | -23.95% | -3.66% |
| 2012 | +11.66% | +4.96% | +6.70% |
| 2013 | +12.63% | -7.36% | +19.99% |
| 2014 | +99.48% | +58.84% | +40.64% |
| 2015 | +120.63% | -1.62% | +122.25% |
| 2016 | +8.85% | -4.86% | +13.72% |
| 2017 | -14.27% | +6.77% | -21.04% |
| 2018 | -27.58% | -26.37% | -1.21% |
| 2019 | +25.04% | +25.15% | -0.11% |
| 2020 | +8.30% | +13.54% | -5.24% |
| 2021 | +2.10% | +3.69% | -1.59% |
| 2022 | -13.08% | -14.20% | +1.12% |
| 2023 | -6.48% | -4.95% | -1.54% |
| 2024 | +18.22% | +10.14% | +8.08% |
| 2025 | +11.54% | +20.58% | -9.04% |
The first four years of the backtest (2002-2005) were negative for both the portfolio and the SSE Composite. Chinese equities were in a prolonged bear market. The quality filter didn't save you from losses, but it kept pace with the benchmark during the worst of it.
The 2006-2007 period is where the SSE Composite massively outperformed. The benchmark returned +129.96% and +94.16% in those two years as the entire market surged. The portfolio captured +45.17% and +5.00%, lagging badly during the speculative bubble. Quality companies near 52-week lows didn't participate in the momentum-driven euphoria.
The strategy's real edge shows in the recoveries and crashes. In 2008, the portfolio fell -30.22% while the SSE Composite collapsed -64.33%. In 2009, the portfolio surged +98.00% vs the benchmark's +72.47%. The 2010 result (+24.94% vs -12.06%) and 2013 (+12.63% vs -7.36%) show the same pattern: quality stocks at lows recovering when the broader market stalled.
The 2014-2015 period is extraordinary. The portfolio returned +99.48% and +120.63% while the SSE Composite returned +58.84% and -1.62%. These are the years where the quality filter added the most value, identifying companies that participated in the rally and avoided the subsequent crash.
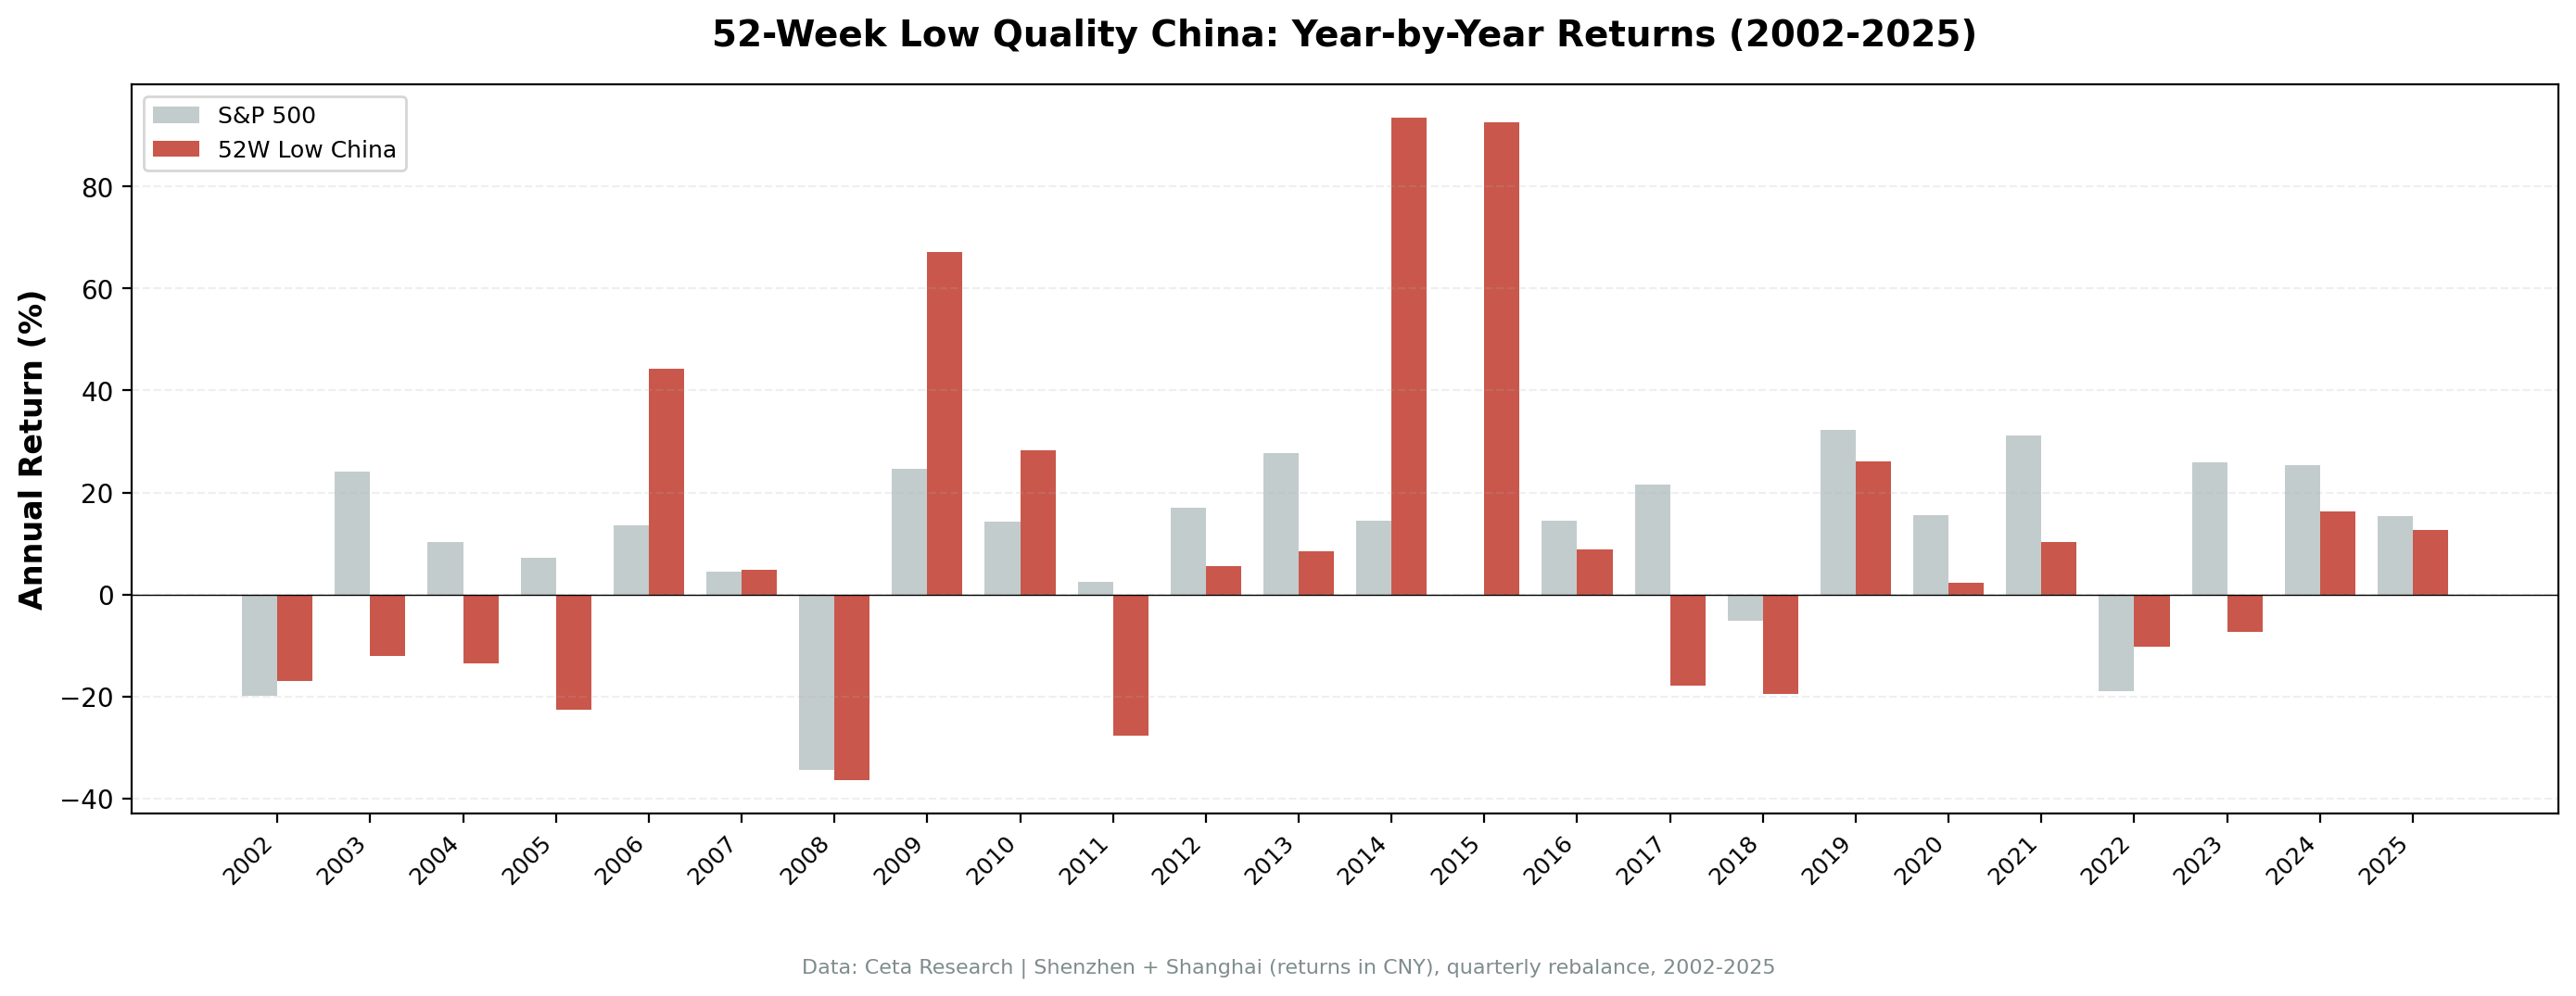
Year-by-year comparison. The strategy lags during speculative surges (2006-2007) but outperforms during crashes and recoveries.
China's Structural Anomalies
China's equity markets have characteristics that interact with this strategy in specific ways.
Retail dominance. Roughly 80% of daily trading volume on Shanghai and Shenzhen exchanges comes from retail investors. Institutional penetration is low compared to developed markets. Retail investors react to news events, government policy announcements, and sentiment cycles rather than fundamental analysis. A quality filter is therefore selecting companies that fundamentals say are good, but the market is pricing based on sentiment.
That dynamic creates the pattern visible in the data: large swings unconnected to fundamentals, but with quality companies recovering after panics. The 2009 return of +98.00% and 2014 return of +99.48% are both post-panic recovery events where quality prevailed.
Beta of 0.684 vs the local benchmark. The portfolio doesn't move in lockstep with the SSE Composite. The down-capture of 76.7% means the strategy falls less than the benchmark during selloffs, while the up-capture of 98.81% means it captures nearly all of the upside. That asymmetry is where the alpha comes from.
State intervention. Chinese regulators can and do intervene in equity markets. Trading halts, IPO suspensions, and direct government purchases create non-fundamental price dynamics. The 2015 circuit-breaker crisis (which produced a cash period in this backtest) is an example. The quality filter doesn't protect against regulatory events.
The quality filter in a state-dominated economy. Companies in state-controlled sectors can score well on Piotroski metrics due to implicit government support for their financials. Some of the "quality" identified by the F-score in China reflects government backstopping rather than genuine business strength. This means the filter may be noisier in China than in market economies.
The alpha of +3.91% is meaningful. After adjusting for beta, the strategy generated genuine excess return vs the SSE Composite. The Sharpe of 0.158 isn't impressive in absolute terms, but it's roughly 3.7x the benchmark's 0.043. In a market with 30% annualized volatility, any positive risk-adjusted return is notable. The quality filter is doing real work in China, not just leaning on luck.
Run It Yourself
WITH
inc AS (
    SELECT symbol, netIncome, grossProfit, revenue,
           ROW_NUMBER() OVER (PARTITION BY symbol ORDER BY dateEpoch DESC) AS rn
    FROM income_statement WHERE period = 'FY' AND netIncome IS NOT NULL
),
bal AS (
    SELECT symbol, totalAssets, totalCurrentAssets, totalCurrentLiabilities,
           longTermDebt, totalStockholdersEquity,
           ROW_NUMBER() OVER (PARTITION BY symbol ORDER BY dateEpoch DESC) AS rn
    FROM balance_sheet WHERE period = 'FY' AND totalAssets > 0
),
cf AS (
    SELECT symbol, operatingCashFlow,
           ROW_NUMBER() OVER (PARTITION BY symbol ORDER BY dateEpoch DESC) AS rn
    FROM cash_flow_statement WHERE period = 'FY' AND operatingCashFlow IS NOT NULL
),
piotroski AS (
    SELECT ic.symbol,
        CASE WHEN ic.netIncome > 0 THEN 1 ELSE 0 END
        + CASE WHEN cfc.operatingCashFlow > 0 THEN 1 ELSE 0 END
        + CASE WHEN (ic.netIncome/bc.totalAssets) > (ip.netIncome/bp.totalAssets) THEN 1 ELSE 0 END
        + CASE WHEN cfc.operatingCashFlow/bc.totalAssets > ic.netIncome/bc.totalAssets THEN 1 ELSE 0 END
        + CASE WHEN (COALESCE(bc.longTermDebt,0)/bc.totalAssets) < (COALESCE(bp.longTermDebt,0)/bp.totalAssets) THEN 1 ELSE 0 END
        + CASE WHEN (bc.totalCurrentAssets/bc.totalCurrentLiabilities) > (bp.totalCurrentAssets/bp.totalCurrentLiabilities) THEN 1 ELSE 0 END
        + CASE WHEN bc.totalStockholdersEquity >= bp.totalStockholdersEquity THEN 1 ELSE 0 END
        + CASE WHEN (ic.revenue/bc.totalAssets) > (ip.revenue/bp.totalAssets) THEN 1 ELSE 0 END
        + CASE WHEN (ic.grossProfit/ic.revenue) > (ip.grossProfit/ip.revenue) THEN 1 ELSE 0 END
        AS f_score
    FROM (SELECT * FROM inc WHERE rn=1) ic
    JOIN (SELECT * FROM inc WHERE rn=2) ip ON ic.symbol = ip.symbol
    JOIN (SELECT * FROM bal WHERE rn=1) bc ON ic.symbol = bc.symbol
    JOIN (SELECT * FROM bal WHERE rn=2) bp ON ic.symbol = bp.symbol
    JOIN (SELECT * FROM cf WHERE rn=1) cfc ON ic.symbol = cfc.symbol
),
prices_52w AS (
    SELECT symbol,
           LAST_VALUE(adjClose) OVER (PARTITION BY symbol ORDER BY dateEpoch ROWS BETWEEN UNBOUNDED PRECEDING AND UNBOUNDED FOLLOWING) AS current_price,
           MIN(adjClose) OVER (PARTITION BY symbol) AS low_52w
    FROM stock_eod
    WHERE CAST(date AS DATE) >= CURRENT_DATE - INTERVAL '365 days' AND adjClose > 0
)
SELECT pio.symbol, p.companyName, p.sector,
       pio.f_score,
       ROUND(ps.current_price, 2) AS current_price,
       ROUND(ps.low_52w, 2) AS low_52w,
       ROUND((ps.current_price - ps.low_52w)/ps.low_52w * 100, 1) AS pct_above_low,
       ROUND(k.marketCap/1e9, 2) AS mktcap_b
FROM piotroski pio
JOIN profile p ON pio.symbol = p.symbol
JOIN (SELECT symbol, MAX(current_price) AS current_price, MIN(low_52w) AS low_52w FROM prices_52w GROUP BY symbol) ps ON pio.symbol = ps.symbol
JOIN key_metrics_ttm k ON pio.symbol = k.symbol
WHERE p.exchange IN ('SHZ', 'SHH')
  AND k.marketCap > 500000000
  AND pio.f_score >= 7
  AND (ps.current_price - ps.low_52w)/ps.low_52w <= 0.15
  AND ps.current_price >= 1.0
ORDER BY (ps.current_price - ps.low_52w)/ps.low_52w ASC
LIMIT 30
Run this screen on Ceta Research →
Limitations
Retail market dynamics. Chinese equity markets trade on sentiment cycles that have little to do with company fundamentals. A quality filter identifies financially strong companies, but those companies still get caught in broad market selloffs driven by retail panic or government policy changes.
State sector noise in quality metrics. Some Chinese companies score well on Piotroski metrics because they benefit from implicit government support. The financial strength identified by the F-score may reflect state backing rather than genuine business quality. This makes the filter noisier in China than in market economies.
Volatility of 30.04%. Both the portfolio and the SSE Composite run at roughly 30% annualized volatility. A 55.06% max drawdown at some point in the 24-year history is a real investor test, even though the benchmark's -66.96% drawdown was worse.
Currency. Returns and benchmark are both in CNY. International investors would need to account for CNY/USD fluctuations separately.
Win rate of 51.58%. The strategy beats the SSE Composite in slightly more than half of all quarters. That's a meaningful improvement over the sub-40% win rate against SPY, but it still means extended stretches of underperformance are common.
Regulatory risk. Chinese market interventions, trading halts, and sudden regulatory changes are a real and unquantifiable risk. The 2015 circuit-breaker episode is a mild example. More severe interventions are possible and can't be backtested.
Data: Ceta Research (FMP financial data warehouse), 2002–2025. Full methodology: backtests/METHODOLOGY.md. Backtest code: backtests/52-week-low/. Past performance does not guarantee future results. Educational content only, not investment advice.


