
Small-Cap Value Across 14 Exchanges: All 14 Beat Their Local Benchmark
We ran the same small-cap value screen across 14 stock exchanges and 25 years of data. All 14 beat their local benchmark. UK produced the best risk-adjusted result (0.750 Sharpe, -10.89% MaxDD). India led on absolute return (20.89% CAGR).


We ran the same small-cap value screen on 14 stock exchanges covering 25 years of data. All fourteen beat their local benchmark. The signal works everywhere.
Contents
- Method
- The Results
- Comparison Charts
- Risk-Adjusted Leaders: UK and Taiwan
- Absolute Return Leaders: India and the US
- The Broad Middle: 8 Exchanges Between +3% and +10%
- The Weakest Link: Hong Kong
- Why It Works Globally
- Limitations
- Run It Yourself
- Part of a Series
- Takeaway
- References
That's a stronger result than most factor strategies produce. Most global comparisons we've run show five or six exchanges beating their benchmark, with the rest trailing. Here, every single market, from India to Hong Kong, generated positive excess returns over the local index.
The small-cap value intersection, cheap small stocks with quality controls, remains one of the most durable return drivers in equity markets.
Data: FMP financial data warehouse, 2000–2025. Updated March 2026.
Method
Data source: Ceta Research (FMP financial data warehouse) Period: 2000-2025 (25 annual periods) Signal: Small-cap stocks ranked by lowest Price-to-Book ratio Quality filters: P/B between 0 and 1.5, ROE > 5%, D/E < 2.5 Size filter: Market cap between 5% and 200% of each exchange's local threshold Selection: Top 30 by P/B ascending, equal weight Rebalance: Annual, every July (45-day filing lag) Execution: Next-day close (MOC) Cash rule: Hold cash if fewer than 10 stocks qualify Benchmark: Local index per exchange (see results table)
The same screen ran identically on each exchange. Same filters, same position count, same rebalance frequency. Small-cap bounds differ by exchange because a $50M company means different things in Zurich and Mumbai. We calibrated each exchange separately using local market cap distributions.
Full methodology: METHODOLOGY.md
The Results
| Exchange | CAGR | Benchmark | Bench CAGR | Excess | Sharpe | Max DD | Cash% | Avg Stk |
|---|---|---|---|---|---|---|---|---|
| India (NSE) | 20.89% | Sensex | 12.06% | +8.83% | 0.334 | -45.03% | 16% | 24.3 |
| US (NYSE+NASDAQ+AMEX) | 18.10% | S&P 500 | 7.85% | +10.25% | 0.641 | -28.29% | 0% | 15.4 |
| UK (LSE) | 15.44% | FTSE 100 | 1.23% | +14.21% | 0.750 | -10.89% | 0% | 14.1 |
| Canada (TSX) | 13.21% | TSX Composite | 3.95% | +9.26% | 0.390 | -48.13% | 0% | 24.0 |
| Taiwan (TAI) | 12.63% | TAIEX | 4.09% | +8.54% | 0.511 | -11.38% | 20% | 27.9 |
| South Africa (JNB) | 12.80% | S&P 500 | 7.85% | +4.95% | 0.163 | -35.28% | 12% | 23.4 |
| China (SHZ+SHH) | 12.62% | SSE Composite | 2.43% | +10.19% | 0.238 | -57.63% | 0% | 15.4 |
| Thailand (SET) | 12.25% | SET Index | 5.13% | +7.11% | 0.387 | -23.54% | 8% | 18.7 |
| Sweden (STO) | 11.70% | OMX Stockholm 30 | 2.55% | +9.15% | 0.391 | -40.95% | 12% | 23.6 |
| Germany (XETRA) | 11.42% | DAX | 5.04% | +6.38% | 0.394 | -41.21% | 12% | 24.4 |
| Korea (KSC) | 9.25% | KOSPI | 5.35% | +3.90% | 0.272 | -24.65% | 28% | 28.8 |
| Japan (JPX) | 8.13% | Nikkei 225 | 3.31% | +4.82% | 0.364 | -43.35% | 16% | 27.6 |
| Switzerland (SIX) | 8.02% | SMI | 1.74% | +6.28% | 0.433 | -41.09% | 12% | 23.1 |
| Hong Kong (HKSE) | 4.16% | Hang Seng | 1.64% | +2.52% | 0.031 | -68.68% | 0% | 13.8 |
Returns in local currency. Each exchange benchmarked against its local index. South Africa falls back to S&P 500 because JSE All Share (^J203.JO) lacks price data. SPY baseline: 7.85% CAGR.
Comparison Charts
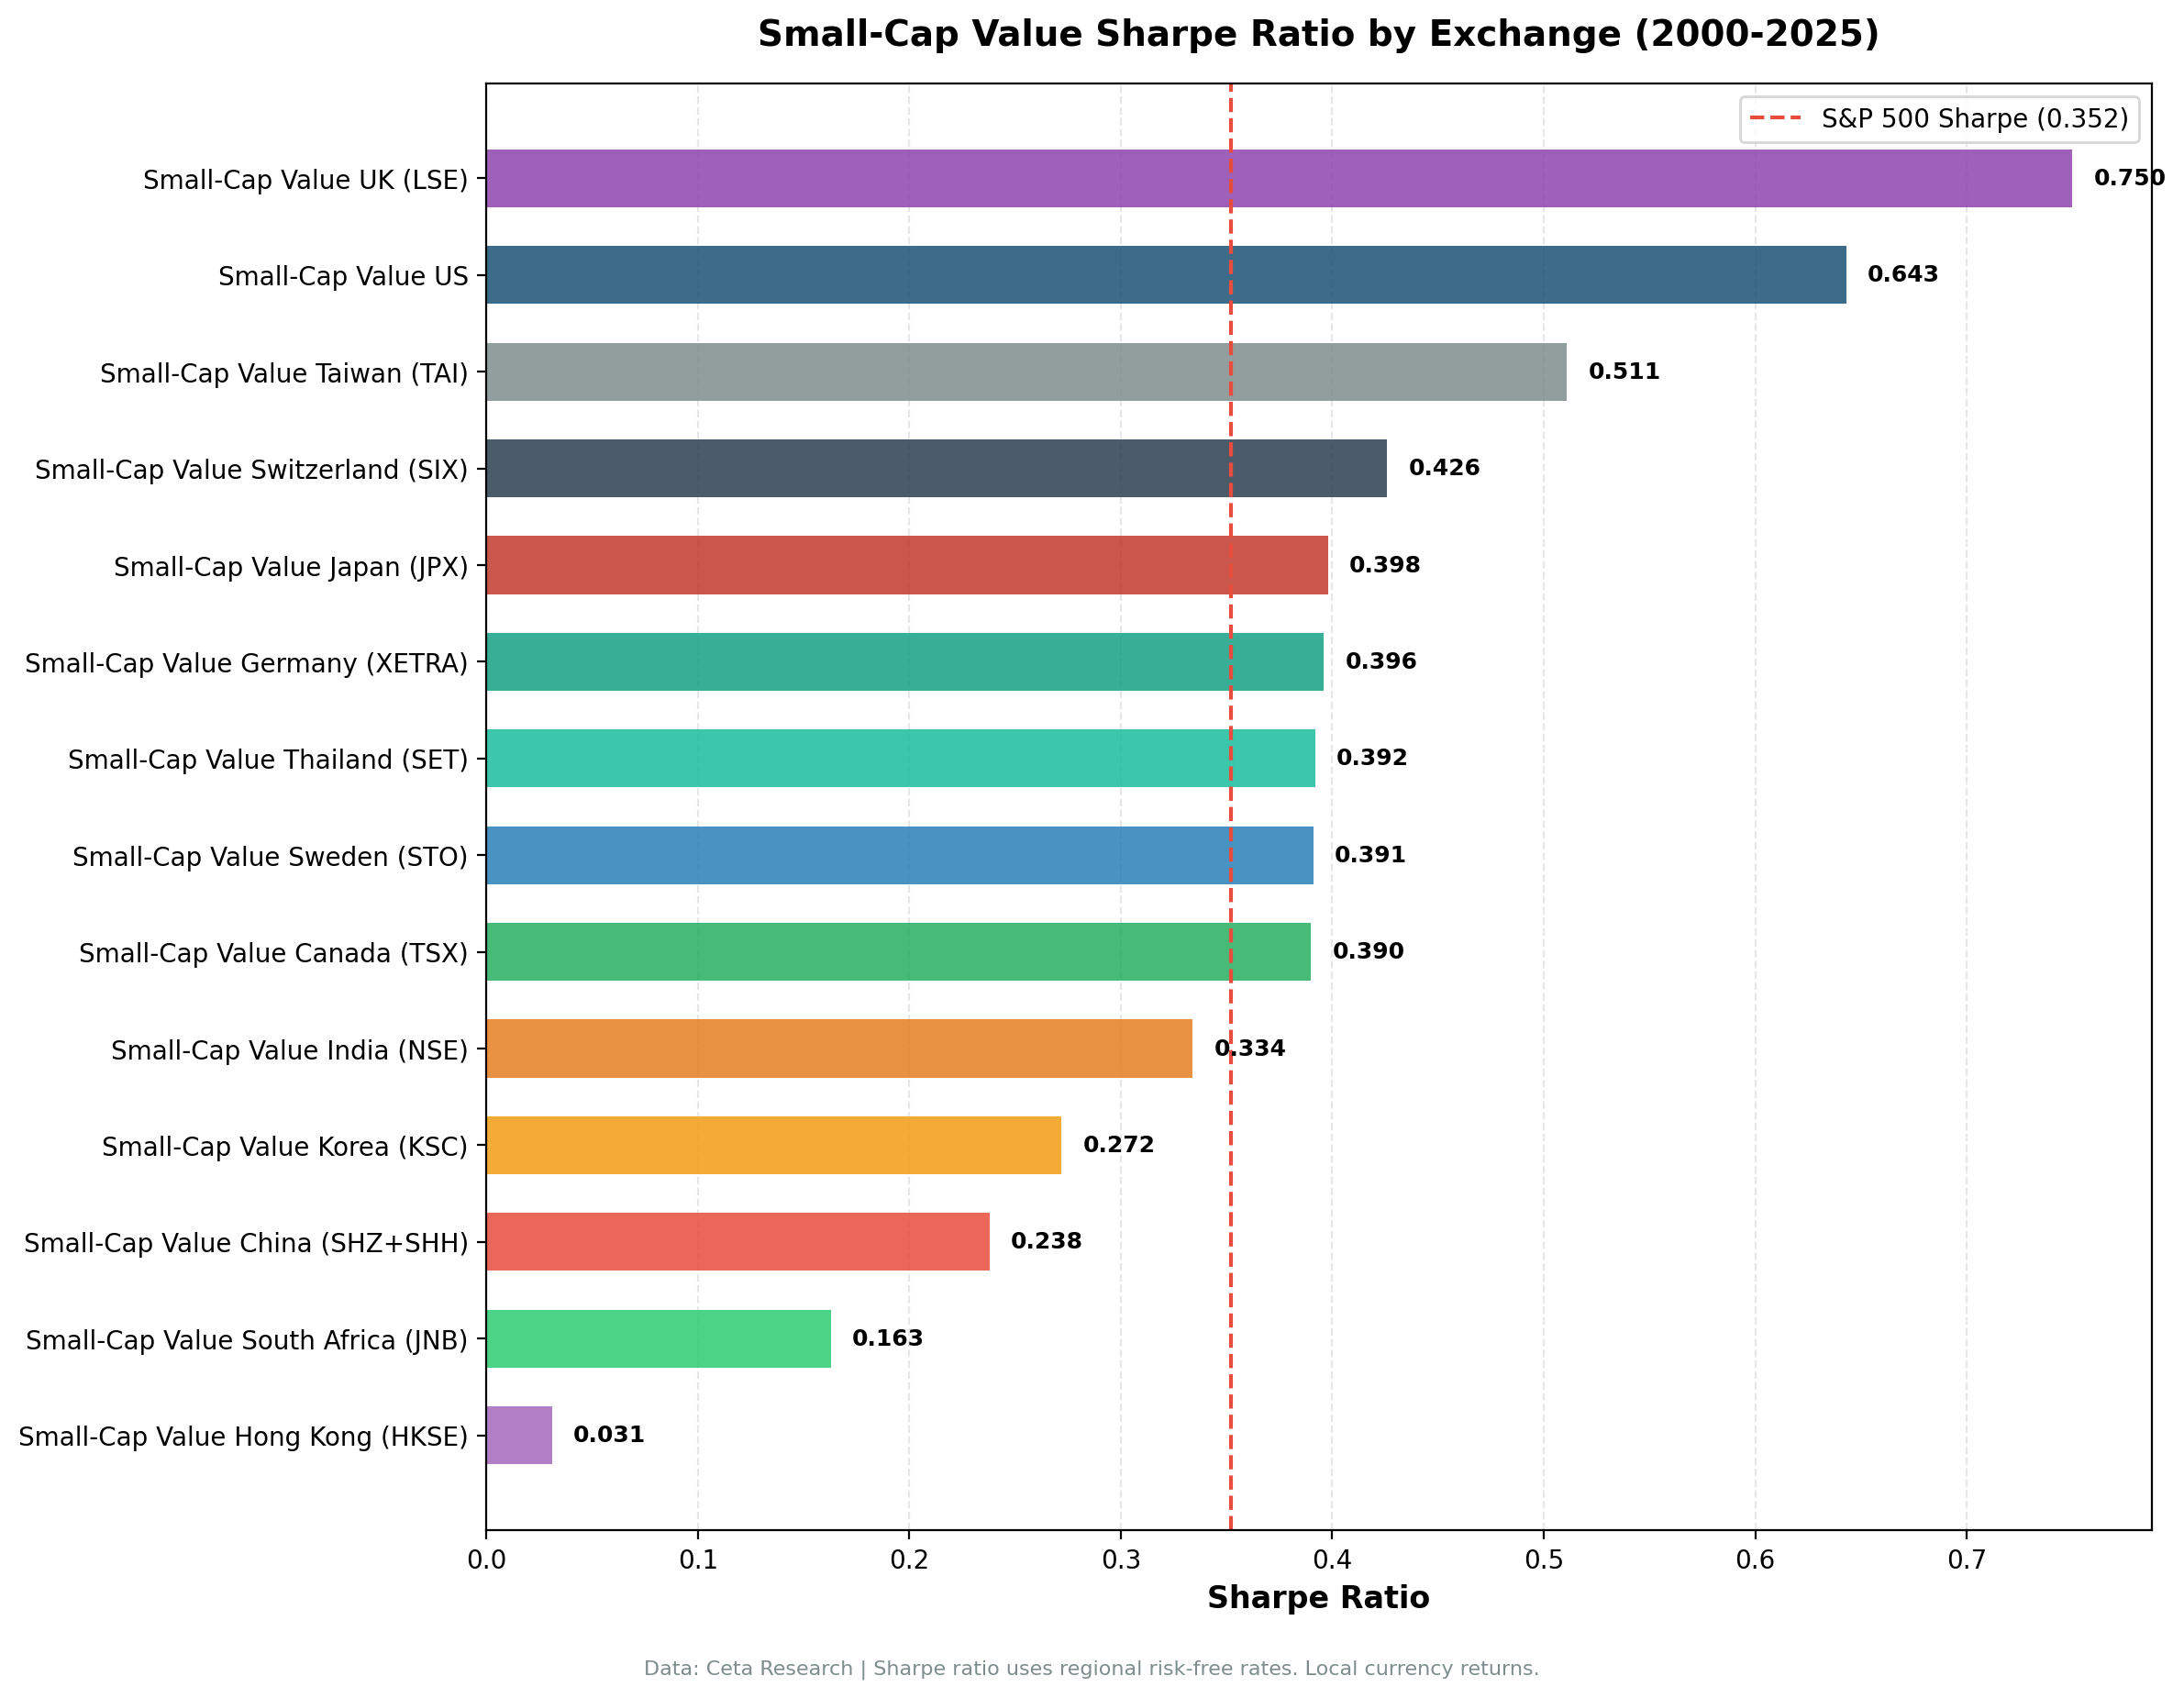
Risk-Adjusted Leaders: UK and Taiwan
The headline CAGR numbers are India and the US. The risk-adjusted numbers tell a different story.
UK (LSE): 0.750 Sharpe, -10.89% MaxDD. This is the best risk-adjusted result of any exchange we've tested across any strategy. A 15.44% CAGR with only -10.89% drawdown means the portfolio barely fell during the 2008 crisis or COVID. The excess over FTSE 100 (+14.21%) is the largest of any exchange. UK small-cap value stocks tend to be industrial companies, specialty retailers, and regional service businesses. They're genuinely cheap because nobody covers them. The LSE has thousands of listed companies below GBP 500M market cap, and most get zero analyst attention. That information vacuum creates persistent mispricing. Only three negative years in 25.
Taiwan (TAI): 0.511 Sharpe, -11.38% MaxDD. Taiwan is the most under-researched result in this dataset. A 12.63% CAGR with drawdown that shallow is a strong risk-adjusted profile. Taiwan's small-cap value universe is dominated by electronics component manufacturers, industrial suppliers, and specialty chemical companies. These businesses have real assets on their balance sheets (factories, equipment, inventory), which makes book value a meaningful anchor. The 20% cash periods reflect Taiwan's narrower qualifying universe, but when the strategy found stocks, they performed well.
Both markets share a structural advantage: deep small-cap universes with thin coverage. Institutional capital in the UK and Taiwan concentrates on large caps. The small end of the market is left to local investors and the occasional specialist fund.
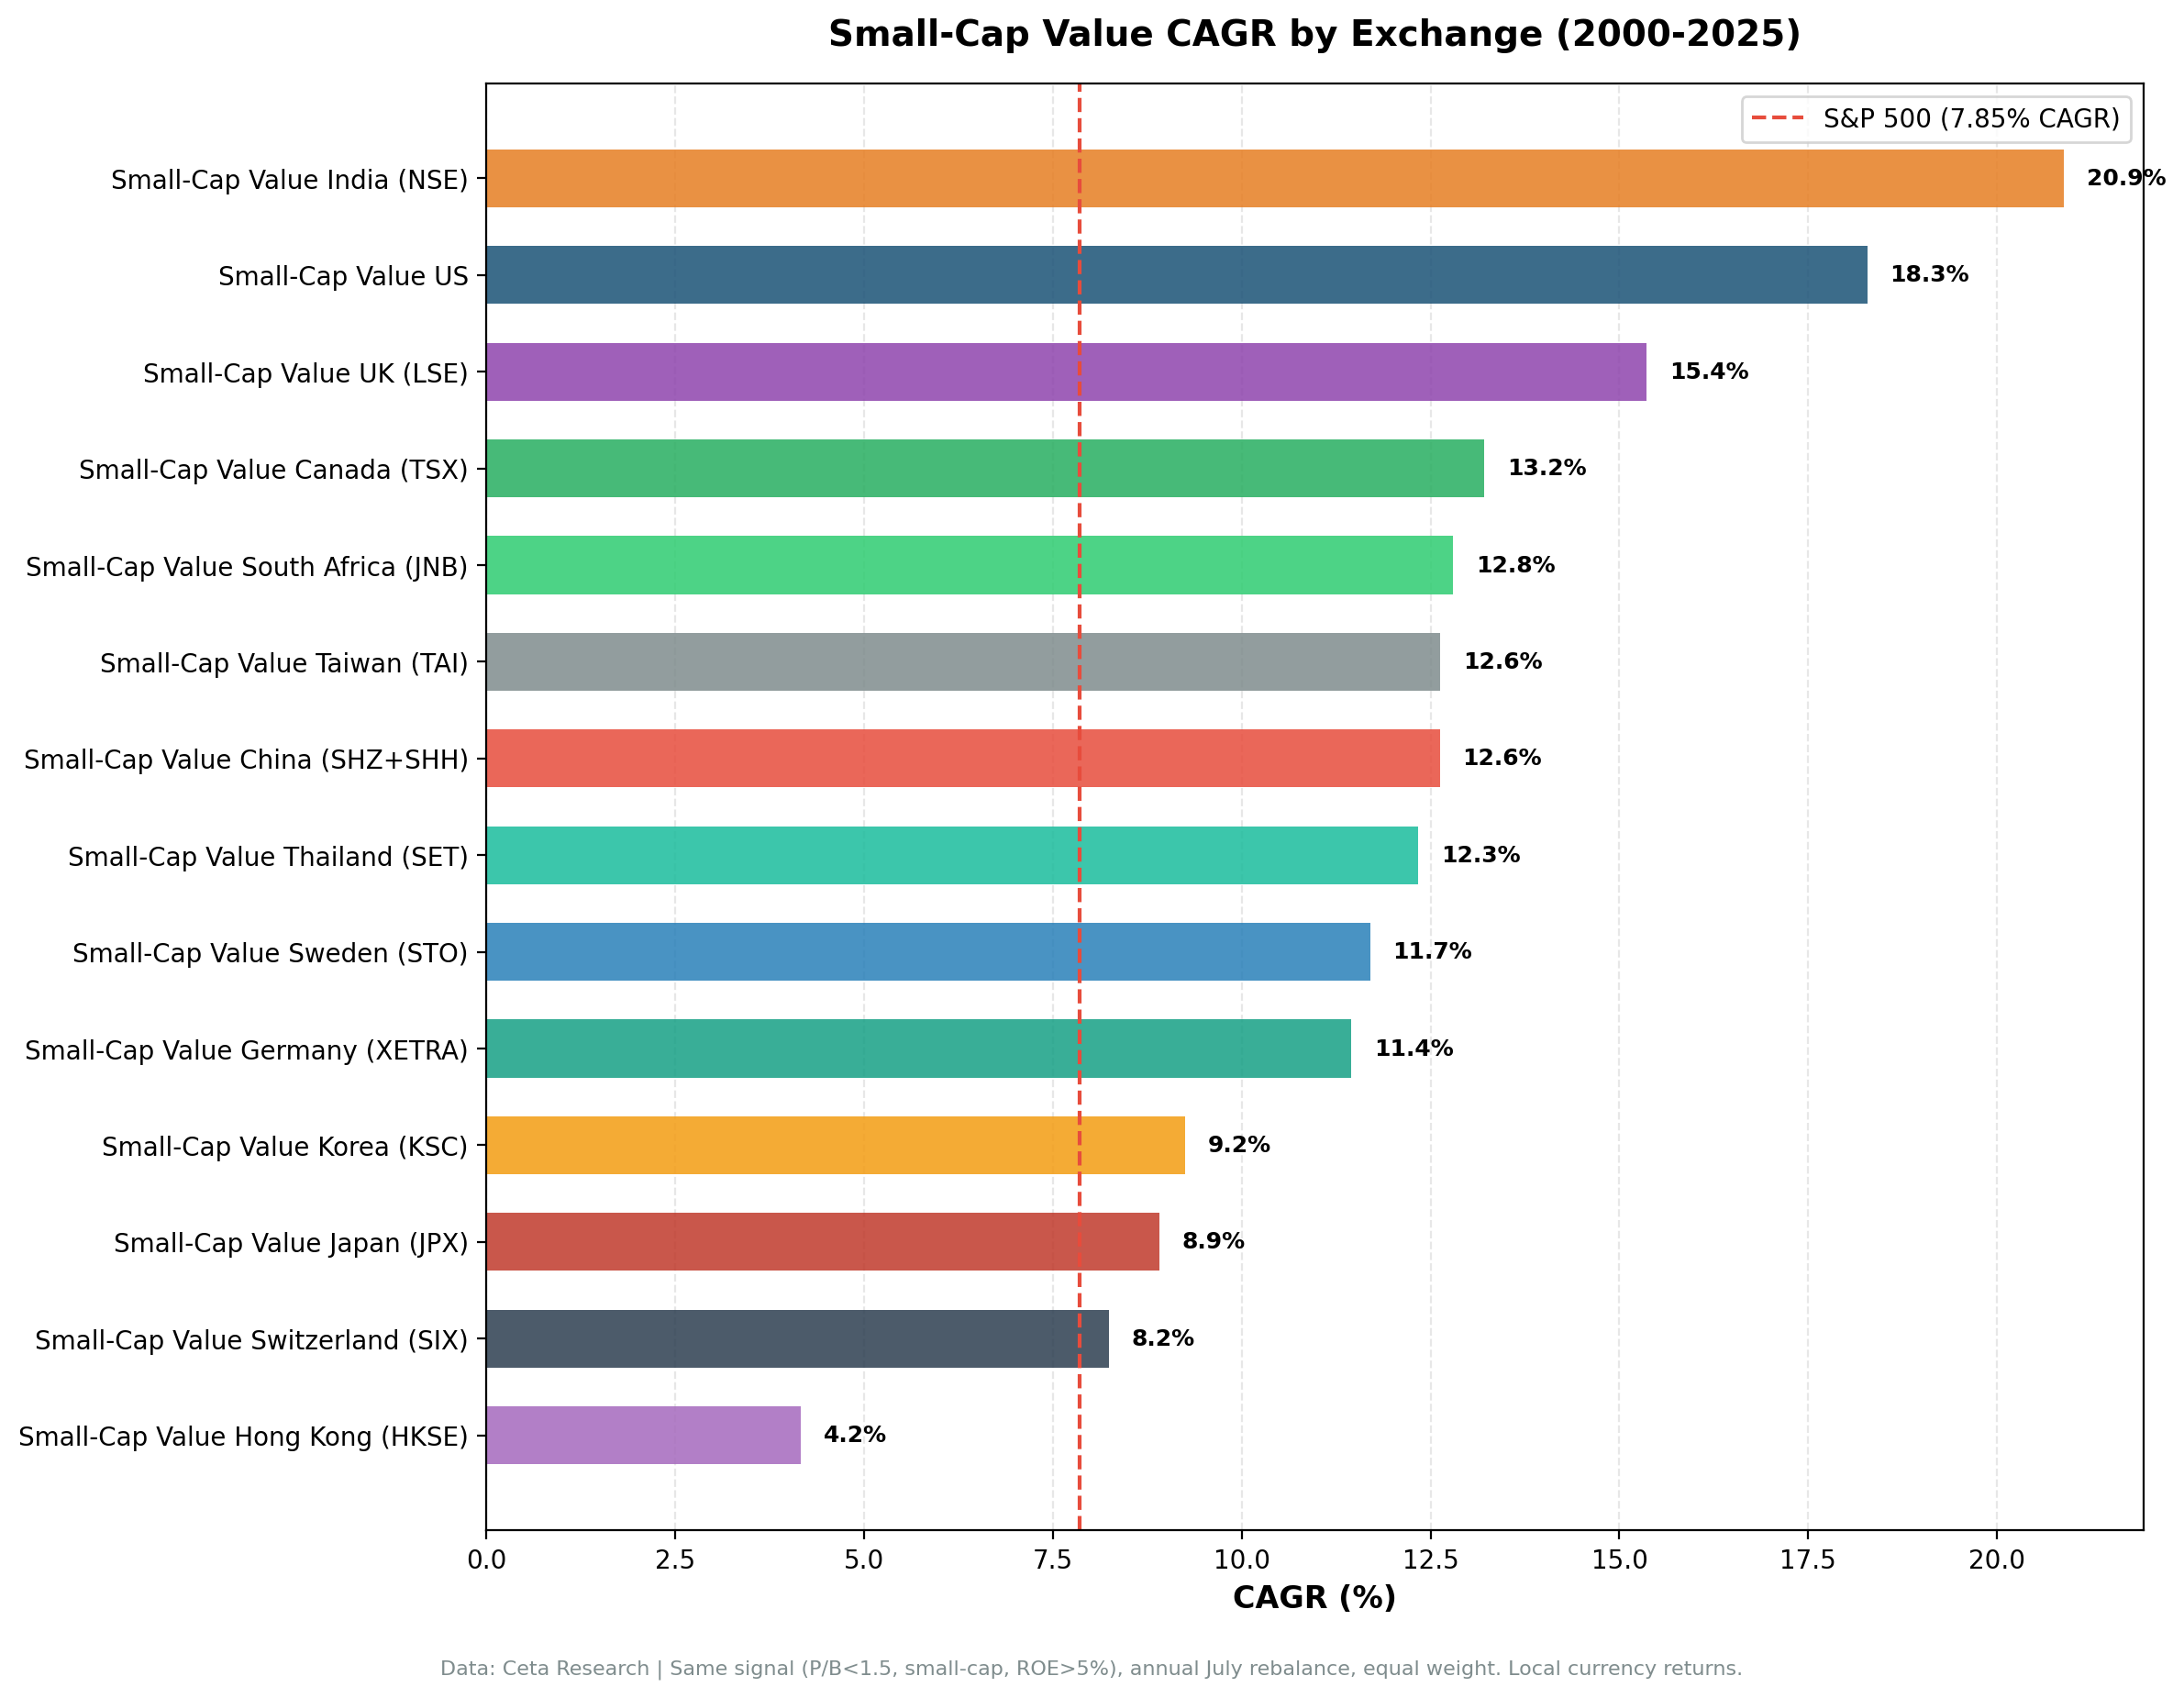
Absolute Return Leaders: India and the US
India (NSE): 20.89% CAGR, +8.83% excess vs Sensex. India posted the highest absolute return of any exchange. The NSE universe is massive, over 2,000 listed companies, and the small-cap segment is enormous. Domestic growth, rising consumption, and a steady pipeline of companies transitioning from micro-cap to small-cap created a constant supply of cheap, growing businesses. The -45.03% drawdown was significant, but the compounding was relentless. The Sensex itself returned 12.06% CAGR over this period, and the strategy beat it by nearly 9 points annually.
US (NYSE+NASDAQ+AMEX): 18.10% CAGR, +10.25% excess vs S&P 500. The US result is the strongest in developed markets by a wide margin. The 0.641 Sharpe ratio is the second-highest overall. Zero cash periods. The strategy found qualifying stocks in every single year. US small-cap value has been documented since Fama and French (1992), and the premium has persisted even as the broad small-cap premium faded. Israel and Moskowitz (2013) showed the pure size effect largely disappeared post-1980, but the interaction of size and value survived. Our 25-year backtest confirms that finding with live data.
What separates the US from other developed markets is the depth of the small-cap universe. There are thousands of listed companies below $2B market cap across NYSE, NASDAQ, and AMEX. The strategy always had material to work with.
The Broad Middle: 8 Exchanges Between +3% and +10%
Eight exchanges generated excess returns between +3% and +10% over their local benchmarks. This cluster includes both emerging markets (South Africa, Thailand, China) and developed markets (Germany, Sweden, Canada, Japan, Switzerland).
Canada (TSX): 13.21% CAGR, +9.26% excess vs TSX Composite, -48.13% MaxDD. The highest CAGR in this group, but also the deepest drawdown among outperformers. Canada's small-cap value universe is resource-heavy: junior miners, energy exploration companies, and agricultural businesses. When commodities boom, these stocks compound aggressively. When they bust, the drawdowns are severe. The -48.13% MaxDD came during the 2008 commodity collapse.
Germany (XETRA): 11.42% CAGR, +6.38% excess vs DAX. German Mittelstand companies, family-owned manufacturers and industrial suppliers, dominate the small-cap value segment. These businesses trade at low P/B ratios because they prioritize retained earnings over shareholder distributions.
China (SHZ+SHH): 12.62% CAGR, +10.19% excess vs SSE Composite, -57.63% MaxDD. China produced strong excess returns over its local benchmark. The -57.63% MaxDD reflects the A-share bust cycles of 2008 and 2015. Chinese small-cap value works because the domestic retail investor base creates persistent mispricing, but the ride is brutal.
Thailand (SET): 12.25% CAGR, +7.11% excess vs SET Index. Thailand's small-cap value universe includes manufacturers, exporters, and domestic consumer businesses trading at depressed valuations relative to their book value and profitability.
Japan (JPX): 8.13% CAGR, +4.82% excess vs Nikkei 225. Japan is interesting because the pure small-cap premium is dead there (our growth-04 small-cap screen produced -1.11% CAGR on JPX). But small-cap value works. The difference is the value filter. Japanese small-caps without quality screens are a graveyard of zombie companies. Add the P/B and ROE filters and you get the survivors: profitable manufacturers trading below book because of Japan's structural valuation discount.
Switzerland (SIX): 8.02% CAGR, +6.28% excess vs SMI. The SMI returned only 1.74% CAGR over this period, so even Switzerland's modest absolute return translates to meaningful excess. Swiss small-cap value is a concentrated universe of precision manufacturers and specialty service companies. Consistent but unspectacular in absolute terms.
Korea (KSC): 9.25% CAGR, +3.90% excess vs KOSPI, 28% cash periods. Korea had the highest cash rate in the dataset. The screen couldn't find 10 qualifying stocks in 7 of 25 periods, all concentrated in the early 2000s when Korean financial data coverage was sparse. From 2007 onward, the strategy was fully invested and beat KOSPI consistently.
The Weakest Link: Hong Kong
Hong Kong (HKSE): 4.16% CAGR, +2.52% excess vs Hang Seng, -68.68% MaxDD.
Hong Kong produced the weakest excess return of any exchange, but it still beat the Hang Seng (1.64% CAGR). The -68.68% max drawdown is the worst in the dataset by a wide margin. The Sharpe of 0.031 confirms there was almost no compensation for the risk.
Two distinct crises compounded into near-permanent capital destruction. The first was the 2008 global financial crisis, which hit Hong Kong's property-heavy small-cap universe hard. The second was the 2019-2020 political crisis, followed by COVID lockdowns and the regulatory crackdown on Chinese-linked businesses. Small companies with Hong Kong operations, thin margins, and real asset exposure were precisely the wrong stocks to own through that period.
The strategy technically worked (positive excess over the local benchmark), but the absolute return of 4.16% CAGR with -68.68% drawdown is not a compelling risk-return profile. Hong Kong's weakness is specific to its political and economic trajectory over this period, not evidence against the small-cap value signal itself.
Why It Works Globally
The universal outperformance across 14 exchanges isn't random. Two explanations, one behavioral and one rational, account for most of it.
Behavioral: neglect and information asymmetry. Small-cap stocks receive less analyst coverage than large caps. Cheap small-cap stocks receive almost none. A company with a $200M market cap, P/B below 1.5, and positive ROE is invisible to most institutional investors. Sell-side analysts won't cover it (too small). Index funds don't hold it (below index thresholds). Growth-oriented funds won't touch it (no revenue acceleration narrative). This neglect creates persistent mispricing that annual rebalancing can capture.
This effect operates in every market we tested. The UK has thousands of uncovered small caps. Japan has even more. India's small-cap universe is so large that professional coverage reaches maybe 10% of listed companies. The information vacuum is structural, not temporary.
Rational: genuine risk premium. Small value stocks carry real risks. They're illiquid. They have limited access to capital markets. Their business models are often operationally leveraged, meaning earnings swing hard with revenue. A -57.63% drawdown on Chinese small-cap value is not an accident. It's the risk that earned the 12.62% CAGR. Lakonishok, Shleifer, and Vishny (1994) argued that value stocks are genuinely riskier in bad states of the world, and investors who bear that risk earn a premium.
The quality filters (ROE > 5%, D/E < 2.5) are doing work here. Without them, the small-cap value universe includes a lot of cheap-for-a-reason companies: overleveraged, unprofitable, or in secular decline. The filters remove the worst traps and leave the genuinely undervalued survivors.
Limitations
Currency differences. All returns are in local currency. India's 20.89% CAGR in INR and the US's 18.10% in USD are not directly comparable. INR depreciated against USD over this period, which means an international investor converting Indian returns to USD would see a lower number. Excess returns vs. local benchmarks are more meaningful since both strategy and benchmark are in the same currency.
Different risk-free rates. Sharpe ratios use local risk-free rates, which vary substantially. South Africa's risk-free rate averaged around 9% over this period. Japan's was near zero. A 0.163 Sharpe in South Africa and a 0.364 Sharpe in Japan reflect different denominators, not just different return profiles.
Different market structures. Some exchanges have circuit breakers, short-selling restrictions, or foreign ownership limits that affect how strategies behave. The screen treats all exchanges identically, which is methodologically clean but doesn't capture these structural differences.
Transaction costs. Results use a size-tiered transaction cost model (0.3-0.5% per trade depending on market cap). Actual execution costs for some exchanges, particularly Korean or Thai small-caps, may be higher than modeled due to wider bid-ask spreads and thinner order books.
Cash periods affect comparability. Korea's 28% cash periods and Taiwan's 20% cash periods mean those strategies were partially in cash for significant stretches. That reduces both returns and drawdowns relative to fully-invested strategies like the US (0% cash).
Survivorship and data coverage. FMP data coverage varies by exchange and time period. Earlier years (2000-2005) may have thinner coverage for some emerging market exchanges, which could affect results in either direction.
Run It Yourself
Global screen (all 14 exchanges): cetaresearch.com/data-explorer
Full backtest code and data: github.com/ceta-research/backtests
Part of a Series
This is the global comparison post for the small-cap value strategy. Individual exchange deep dives:
- Small-Cap Value: US Stocks 18.10% CAGR, 0.641 Sharpe. Strongest developed market result.
- Small-Cap Value: India 20.89% CAGR, highest absolute return of any exchange.
- Small-Cap Value: UK 0.750 Sharpe, best risk-adjusted globally. Only -10.89% MaxDD.
- Small-Cap Value: Canada 13.21% CAGR, resource-heavy universe with deep drawdowns.
- Small-Cap Value: Taiwan 12.63% CAGR, 0.511 Sharpe. Under-researched.
Takeaway
The small-cap value premium is one of the most robust findings in quantitative finance. Fama and French identified it in 1992. Israel and Moskowitz showed the pure size premium faded but the size-value interaction survived. Our 25-year backtest across 14 exchanges confirms both findings with live data.
All fourteen exchanges beat their local benchmark. The UK produced the best risk-adjusted result we've seen in any strategy we've tested (+14.21% excess vs FTSE 100). India produced the highest absolute return. The US, where the factor was first documented, still generated +10.25% excess returns three decades after publication.
The signal isn't complicated: buy cheap small stocks with basic quality controls. The execution is where it gets hard. Small-cap stocks are illiquid, volatile, and prone to severe drawdowns. China's -57.63% MaxDD and Canada's -48.13% MaxDD are real. Hong Kong's -68.68% MaxDD is brutal even though it technically beat the Hang Seng.
But the breadth of outperformance, across developed and emerging markets, across different economic structures and regulatory regimes, is as close to a universal equity factor as the data supports. Even Hong Kong, the weakest link, generated positive excess over its local index.
References
- Fama, E. F., & French, K. R. (1992). The cross-section of expected stock returns. The Journal of Finance, 47(2), 427-465.
- Fama, E. F., & French, K. R. (1993). Common risk factors in the returns on stocks and bonds. Journal of Financial Economics, 33(1), 3-56.
- Israel, R., & Moskowitz, T. J. (2013). The role of shorting, firm size, and time on market anomalies. Journal of Financial Economics, 108(2), 275-301.
- Lakonishok, J., Shleifer, A., & Vishny, R. W. (1994). Contrarian investment, extrapolation, and risk. The Journal of Finance, 49(5), 1541-1578.
Data: Ceta Research (FMP financial data warehouse, 2000-2025). Returns in local currency. All results gross of transaction costs. Past performance does not guarantee future results. This is educational content, not investment advice.


