52-Week Low Quality: 24-Year Hong Kong Backtest (HKSE)

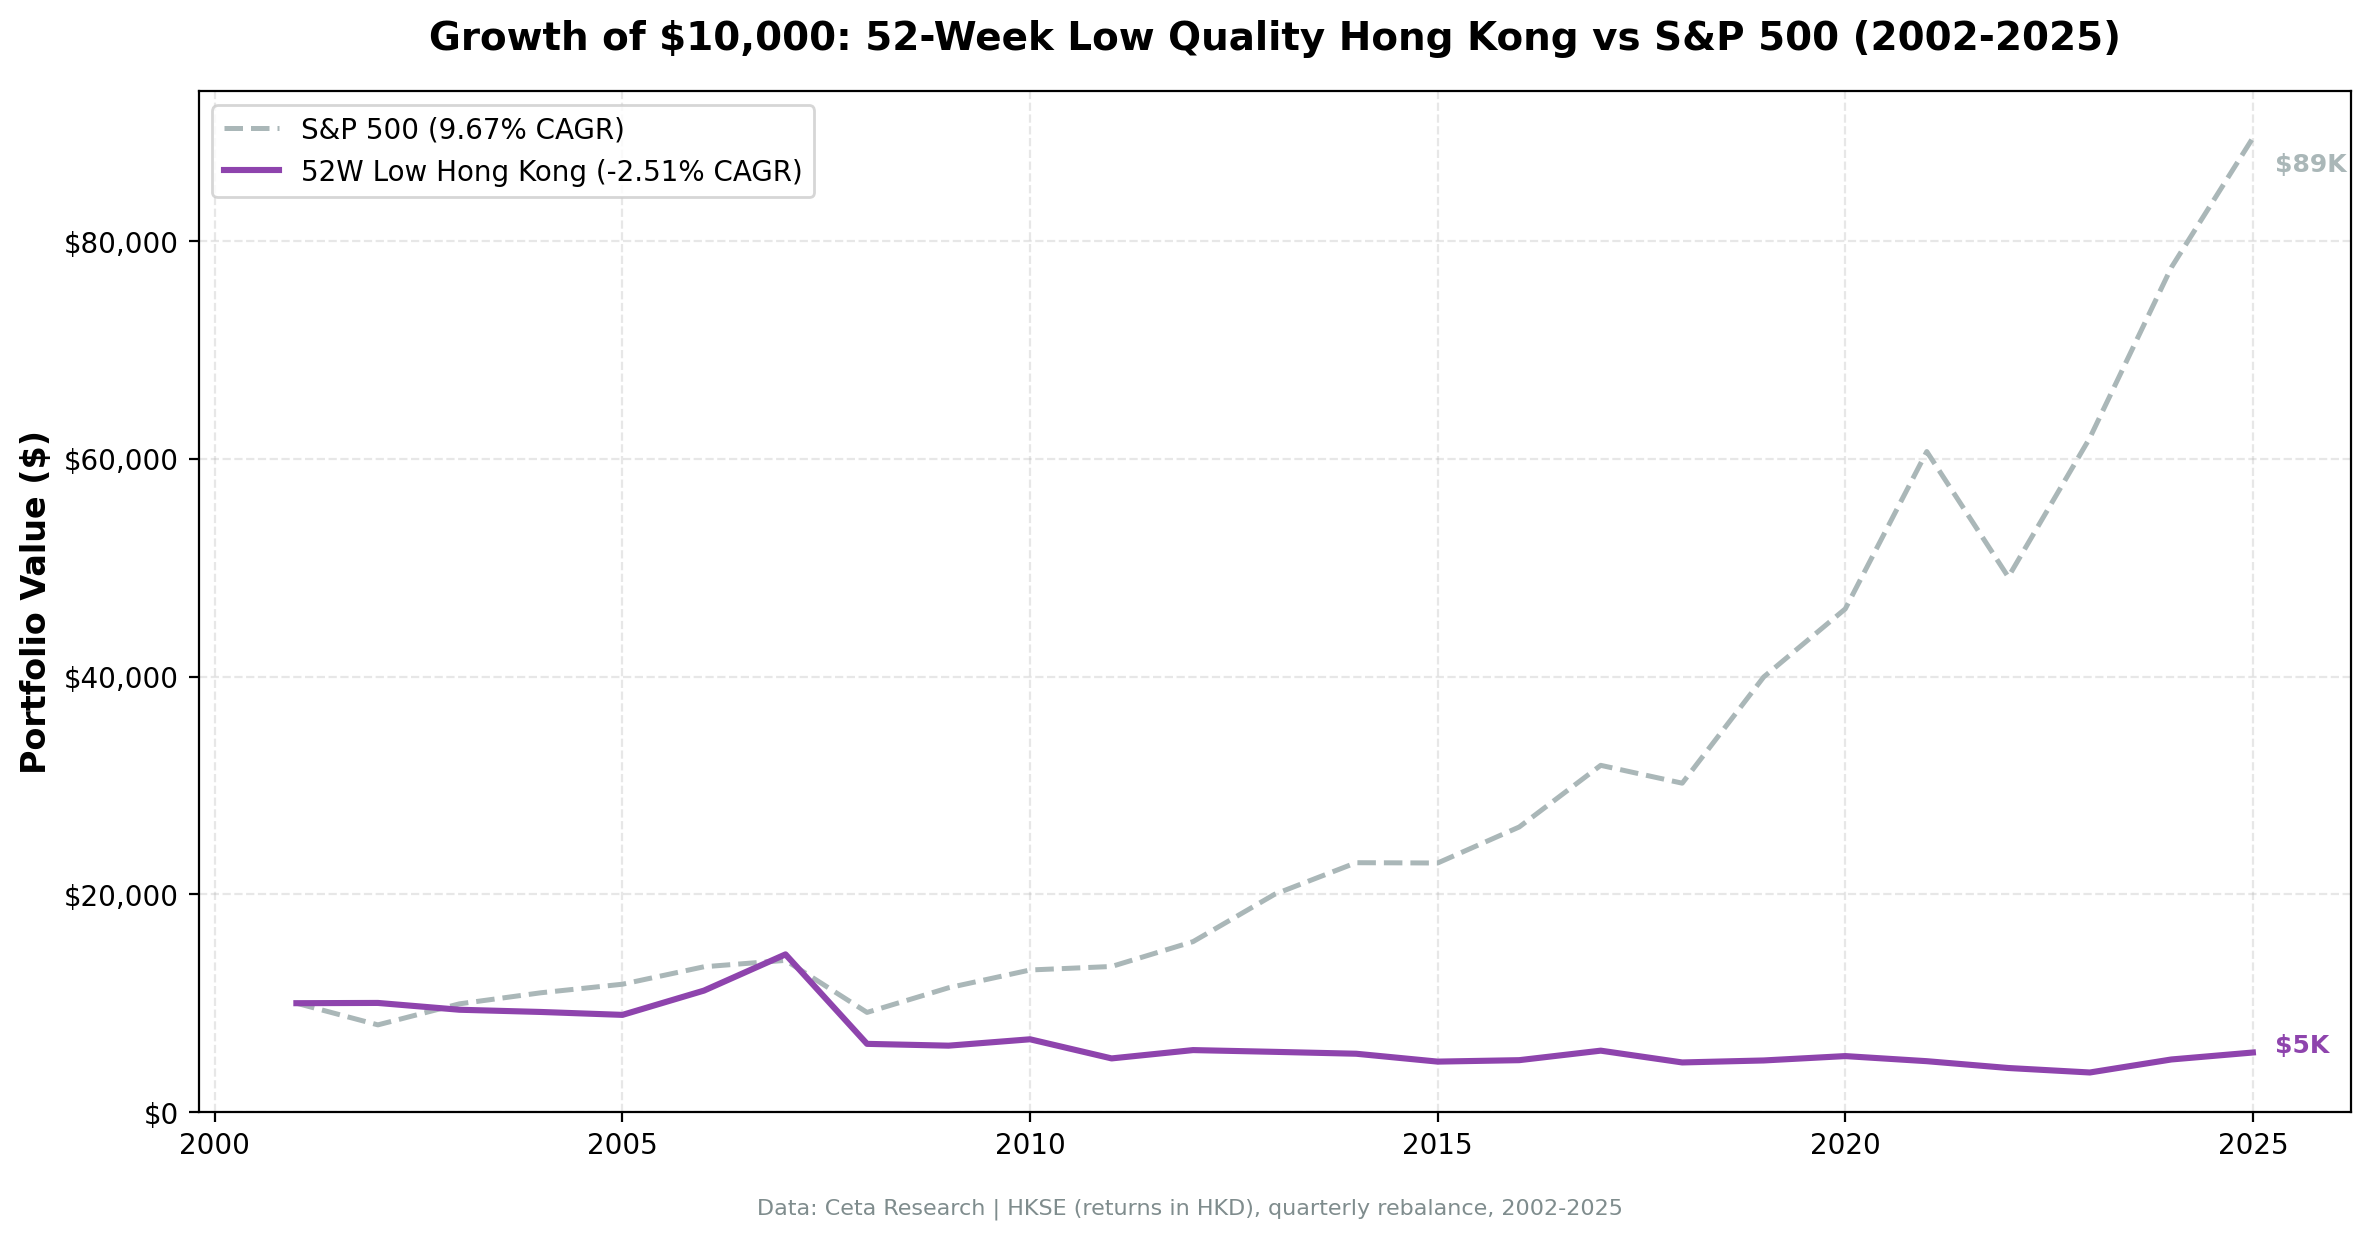
A $10,000 investment in 2002 following this strategy on the Hong Kong Stock Exchange was worth $5,472 by end of 2025. That's a 45% nominal loss over 24 years, not accounting for inflation.
Contents
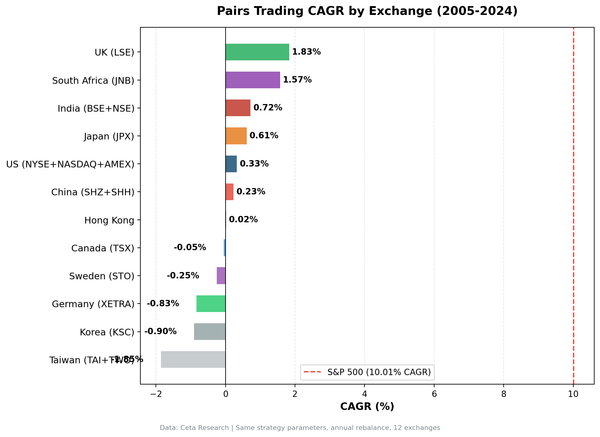
This is the worst result across every exchange we tested. And the reasons explain something specific: a quality filter built around financial statements can't protect you from geopolitical risk.
Method
Each quarter (January, April, July, October), screen for stocks within 15% of their 52-week low. Require a Piotroski F-score of 7 or higher, the stock must show improving profitability, leverage, and operating efficiency. Hold up to 30 stocks equal-weight. Minimum 5 qualifying names to deploy capital. Sit in cash otherwise. Transaction costs: 0.1% per trade. Filing lag: 45 days.
Benchmark: SPY, 9.67% CAGR over 2002–2025.
What We Found
| Metric | 52-Low Quality (HKSE) | SPY |
|---|---|---|
| CAGR | -2.51% | 9.67% |
| Total Return | -45.28% | 789.42% |
| Excess Return vs SPY | -12.17% | — |
| Max Drawdown | -79.81% | -45.53% |
| Sharpe Ratio | -0.260 | 0.461 |
| Sortino Ratio | -0.354 | — |
| Calmar Ratio | -0.031 | — |
| Volatility | 21.2% | — |
| Up-Capture | 50.46% | — |
| Down-Capture | 115.82% | — |
| Beta | 0.730 | — |
| Alpha | -10.37% | — |
| Win Rate vs SPY | 35.79% | — |
| Cash Periods | 14/95 quarters | — |
| Avg Stocks (when invested) | 23.3 | — |
| $10k → | $5,472 | $89,485 |
The down-capture of 115.82% is the number that defines this result. When SPY falls, this portfolio falls faster. When SPY rises, the portfolio captures only half of the gain (50.46% up-capture). That's the worst possible combination. An alpha of -10.37% means you were losing nearly 10 percentage points per year relative to SPY on a risk-adjusted basis.
The max drawdown of -79.81% isn't a theoretical figure. The portfolio actually lost nearly 80% of its peak value across the worst stretch of this test.
Year-by-Year
| Year | Portfolio | SPY |
|---|---|---|
| 2002 | +0.23% | -19.92% |
| 2003 | -6.24% | +24.12% |
| 2004 | +11.84% | +10.24% |
| 2005 | -2.91% | +7.17% |
| 2006 | +24.99% | +13.65% |
| 2007 | +29.82% | +4.40% |
| 2008 | -56.75% | -34.31% |
| 2009 | -2.65% | +24.73% |
| 2010 | +14.22% | +12.84% |
| 2011 | -26.28% | +2.46% |
| 2012 | +5.88% | +13.61% |
| 2013 | +1.44% | +29.64% |
| 2014 | -3.17% | +11.76% |
| 2015 | -12.84% | -0.12% |
| 2016 | +4.92% | +9.54% |
| 2017 | +18.63% | +19.42% |
| 2018 | -19.21% | -5.15% |
| 2019 | -8.44% | +32.31% |
| 2020 | -11.33% | +16.26% |
| 2021 | -9.12% | +26.89% |
| 2022 | -3.44% | -18.99% |
| 2023 | -10.18% | +26.03% |
| 2024 | +32.90% | +25.28% |
| 2025 | +2.11% | +3.11% |
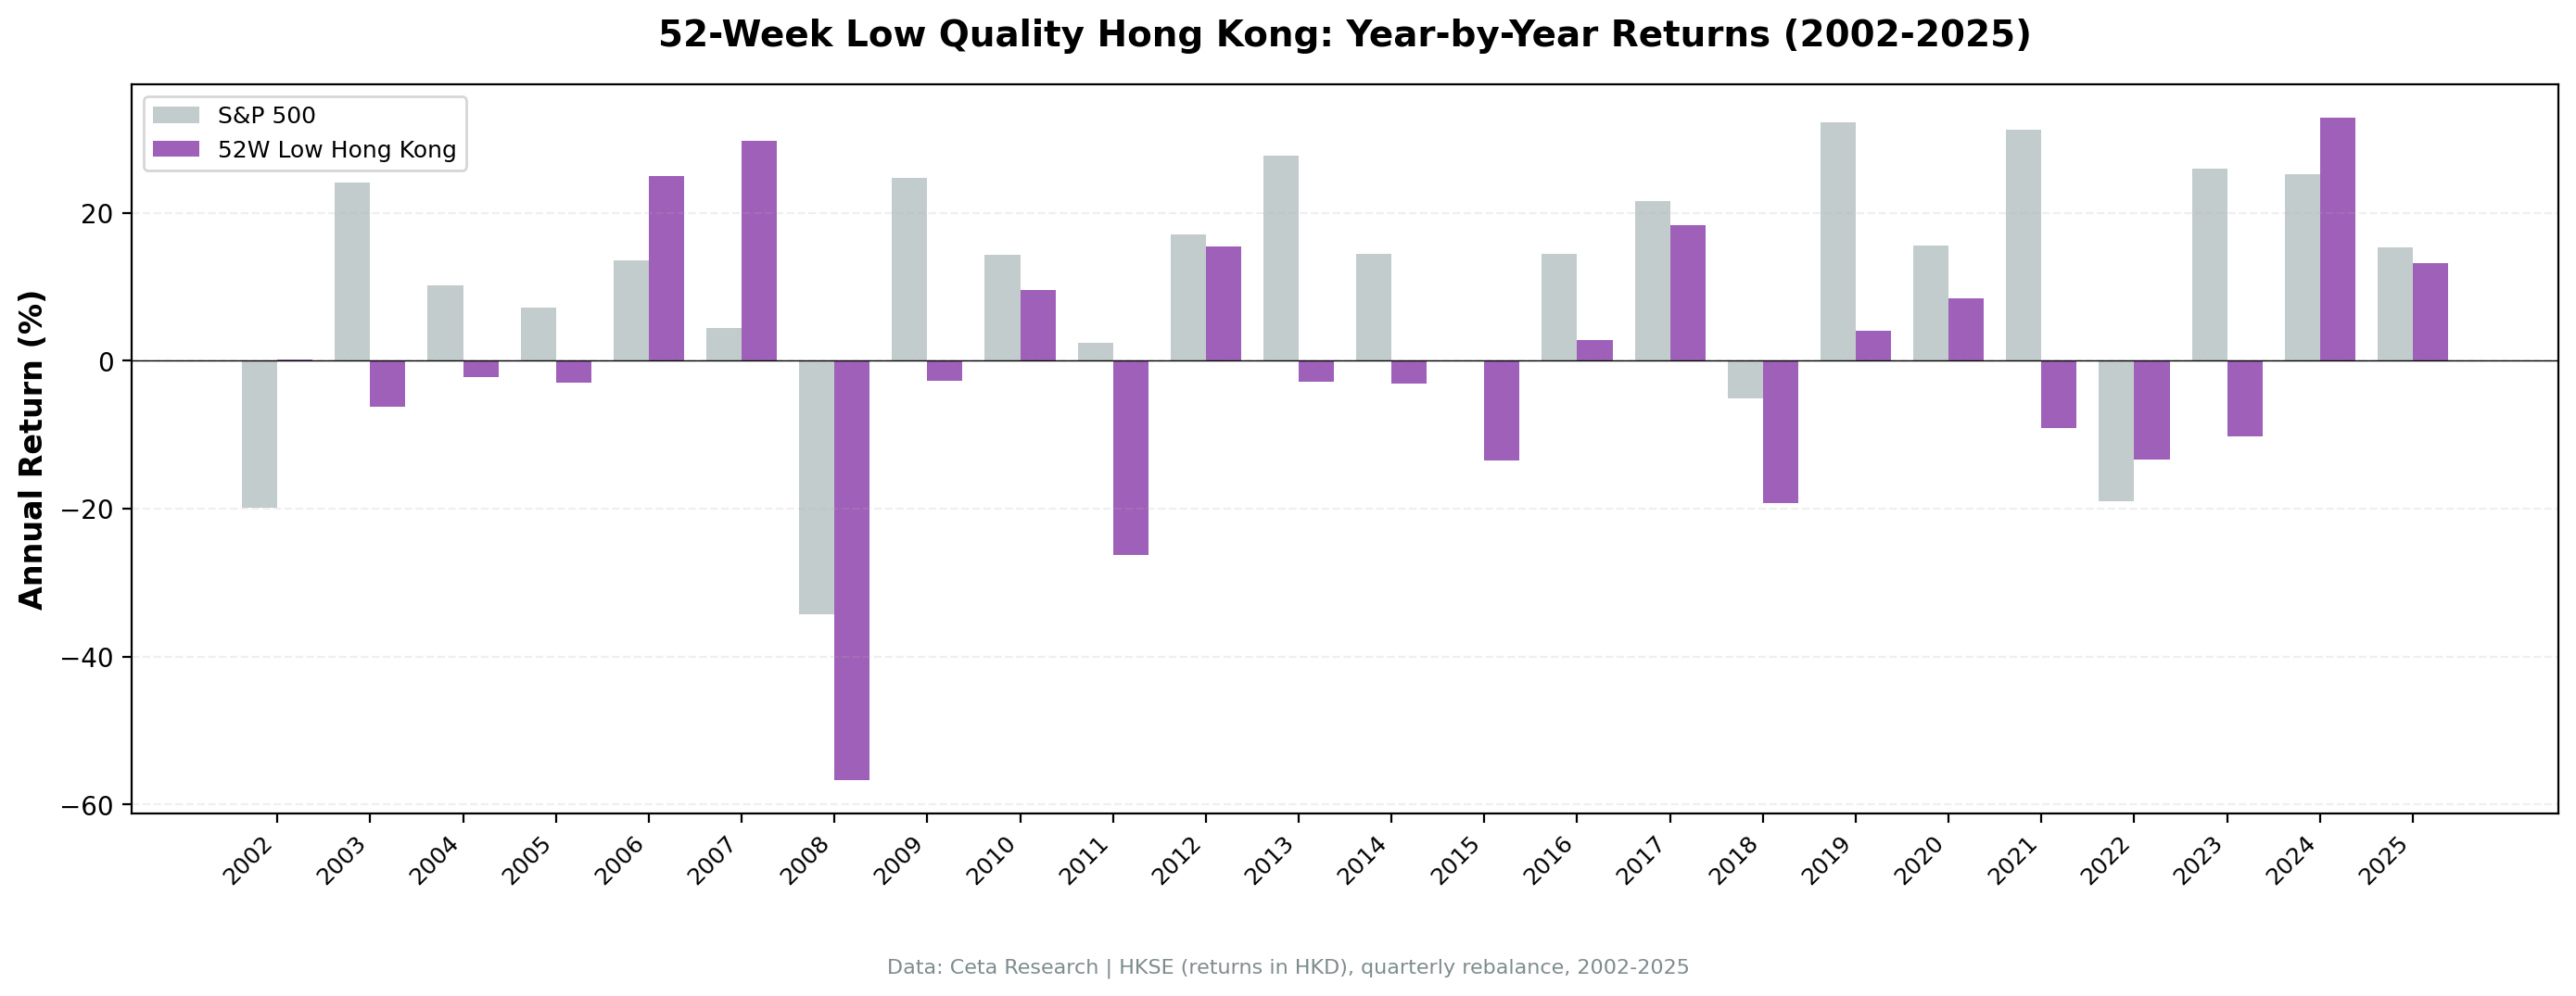
The early years looked fine. 2006 and 2007 delivered genuine outperformance as Hong Kong stocks rode the pre-crisis China growth wave. Then 2008 erased it all, with a -56.75% loss against SPY's -34.31%.
The failure to recover in 2009 (-2.65% vs SPY's +24.73%) is important. Mean-reversion strategies are supposed to benefit from post-crash bounces. They buy beaten-down stocks cheap. Hong Kong stocks near lows after 2008 were often cheap for real reasons. The Piotroski filter looked backward at financial statements. The economic disruption ahead wasn't in those statements yet.
Then came the second spiral: 2020–2023. The portfolio lost money in four of those five years. China regulatory crackdowns on tech and property sectors, the Evergrande crisis, COVID-related restrictions, and the erosion of Hong Kong's independent legal status all combined into a multi-year trend that showed up as persistent losses on this screen.
The one bright spot in recent history: 2024 returned +32.90%, outpacing SPY's +25.28%. But it arrived after five consecutive years of losses. By then the damage was done.
Why Hong Kong Breaks This Strategy
The Piotroski F-score checks nine items: positive net income, positive cash flow from operations, improving return on assets, improving cash flow quality, decreasing leverage, improving current ratio, no equity dilution, improving asset turnover, and improving gross margin. A score of 7+ means the company is passing most of these tests.
None of those tests can identify whether a company's primary customer is a property developer now drowning in debt. None of them flag whether a sector is about to be declared a "common prosperity" target by Beijing. None of them account for the risk that a stock exchange loses its reputation as a rule-of-law jurisdiction.
That's what happened in Hong Kong.
The companies that qualified for this screen in 2020 and 2021 often had solid F-scores. They were profitable, had improving margins, and weren't over-leveraged. But they were operating inside a macroeconomic and political environment that was structurally deteriorating. The 2021 loss of -9.12% came against SPY's +26.89% gain, a spread of 36 percentage points in a single year. That's not stock selection underperformance. That's market-level regime change.
Three distinct crashes compound to create the -79.81% max drawdown: 1. 2008 GFC (-56.75% in the portfolio) 2. The 2011 European sovereign debt crisis spillover (-26.28% that year) 3. The 2020–2023 China/HK policy and regulatory spiral
Each time, the portfolio was loaded with Piotroski-qualified stocks that looked financially healthy going in. Financial health doesn't equal price recovery when the macro environment is actively hostile.
The 115.82% down-capture is the residue of this pattern. In every SPY correction over the test period, Hong Kong value stocks amplified the decline. The 14/95 cash periods (15% of all quarters) mean the portfolio was mostly invested during these drawdowns. It didn't dodge them.
Part of a Series: Global | US | Switzerland | India | Germany | China | Canada
Run It Yourself
The live screen below shows current HKSE stocks within 15% of their 52-week low with Piotroski F-score ≥ 7.
WITH
inc AS (
 SELECT symbol, netIncome, grossProfit, revenue,
 ROW_NUMBER() OVER (PARTITION BY symbol ORDER BY dateEpoch DESC) AS rn
 FROM income_statement WHERE period = 'FY' AND netIncome IS NOT NULL
),
bal AS (
 SELECT symbol, totalAssets, totalCurrentAssets, totalCurrentLiabilities,
 longTermDebt, totalStockholdersEquity,
 ROW_NUMBER() OVER (PARTITION BY symbol ORDER BY dateEpoch DESC) AS rn
 FROM balance_sheet WHERE period = 'FY' AND totalAssets > 0
),
cf AS (
 SELECT symbol, operatingCashFlow,
 ROW_NUMBER() OVER (PARTITION BY symbol ORDER BY dateEpoch DESC) AS rn
 FROM cash_flow_statement WHERE period = 'FY' AND operatingCashFlow IS NOT NULL
),
piotroski AS (
 SELECT ic.symbol,
 CASE WHEN ic.netIncome > 0 THEN 1 ELSE 0 END
 + CASE WHEN cfc.operatingCashFlow > 0 THEN 1 ELSE 0 END
 + CASE WHEN (ic.netIncome/bc.totalAssets) > (ip.netIncome/bp.totalAssets) THEN 1 ELSE 0 END
 + CASE WHEN cfc.operatingCashFlow/bc.totalAssets > ic.netIncome/bc.totalAssets THEN 1 ELSE 0 END
 + CASE WHEN (COALESCE(bc.longTermDebt,0)/bc.totalAssets) < (COALESCE(bp.longTermDebt,0)/bp.totalAssets) THEN 1 ELSE 0 END
 + CASE WHEN (bc.totalCurrentAssets/bc.totalCurrentLiabilities) > (bp.totalCurrentAssets/bp.totalCurrentLiabilities) THEN 1 ELSE 0 END
 + CASE WHEN bc.totalStockholdersEquity >= bp.totalStockholdersEquity THEN 1 ELSE 0 END
 + CASE WHEN (ic.revenue/bc.totalAssets) > (ip.revenue/bp.totalAssets) THEN 1 ELSE 0 END
 + CASE WHEN (ic.grossProfit/ic.revenue) > (ip.grossProfit/ip.revenue) THEN 1 ELSE 0 END
 AS f_score
 FROM (SELECT * FROM inc WHERE rn=1) ic
 JOIN (SELECT * FROM inc WHERE rn=2) ip ON ic.symbol = ip.symbol
 JOIN (SELECT * FROM bal WHERE rn=1) bc ON ic.symbol = bc.symbol
 JOIN (SELECT * FROM bal WHERE rn=2) bp ON ic.symbol = bp.symbol
 JOIN (SELECT * FROM cf WHERE rn=1) cfc ON ic.symbol = cfc.symbol
),
prices_52w AS (
 SELECT symbol,
 LAST_VALUE(adjClose) OVER (PARTITION BY symbol ORDER BY dateEpoch ROWS BETWEEN UNBOUNDED PRECEDING AND UNBOUNDED FOLLOWING) AS current_price,
 MIN(adjClose) OVER (PARTITION BY symbol) AS low_52w
 FROM stock_eod
 WHERE date >= CURRENT_DATE - INTERVAL '365 days' AND adjClose > 0
),
price_summary AS (
 SELECT symbol, MAX(current_price) AS current_price, MIN(low_52w) AS low_52w
 FROM prices_52w GROUP BY symbol
)
SELECT pio.symbol, p.companyName, p.sector,
 pio.f_score,
 ROUND(ps.current_price, 2) AS current_price,
 ROUND(ps.low_52w, 2) AS low_52w,
 ROUND((ps.current_price - ps.low_52w)/ps.low_52w * 100, 1) AS pct_above_low,
 ROUND(k.marketCap/1e9, 2) AS mktcap_b
FROM piotroski pio
JOIN profile p ON pio.symbol = p.symbol AND p.exchange = 'HKSE'
JOIN price_summary ps ON pio.symbol = ps.symbol
JOIN key_metrics_ttm k ON pio.symbol = k.symbol
WHERE k.marketCap > 500000000
 AND pio.f_score >= 7
 AND (ps.current_price - ps.low_52w)/ps.low_52w <= 0.15
 AND ps.current_price >= 1.0
ORDER BY (ps.current_price - ps.low_52w)/ps.low_52w ASC
LIMIT 30
Run this on Ceta Research Data Explorer with your API key.
Limitations
Survivorship bias: Delisted Hong Kong companies aren't included. Given the number of HK companies that were suspended or delisted between 2020 and 2024, this meaningfully overstates returns. The actual results from a live strategy would likely be worse.
Geopolitical risk isn't captured in backtests: The 2020–2023 Hong Kong regulatory environment was unprecedented. Backtests assume the future looks like the past. When political regimes shift, that assumption fails.
Currency: Returns are in HKD. The HKD peg to USD means currency risk is minimal for USD-based investors, but this also means the exchange doesn't benefit from currency appreciation that can lift returns in freely floating markets.
Market cap filter: We used HKD 500M (~USD 64M) as the minimum. This is a reasonable threshold for liquidity, but it excludes a significant portion of HKSE-listed names that are smaller Chinese companies with genuinely different risk profiles.
Forward-looking note: The 2024 recovery (+32.90%) is real. Some investors believe Chinese regulatory headwinds have peaked and valuations are genuinely cheap. This backtest doesn't predict what happens next. It documents what happened across 24 years.
Data: Ceta Research (FMP financial data warehouse), 2002–2025. Full methodology: backtests/METHODOLOGY.md. Backtest code: backtests/52-week-low/.