
52-Week Low Quality: 24-Year Switzerland Backtest (SIX)

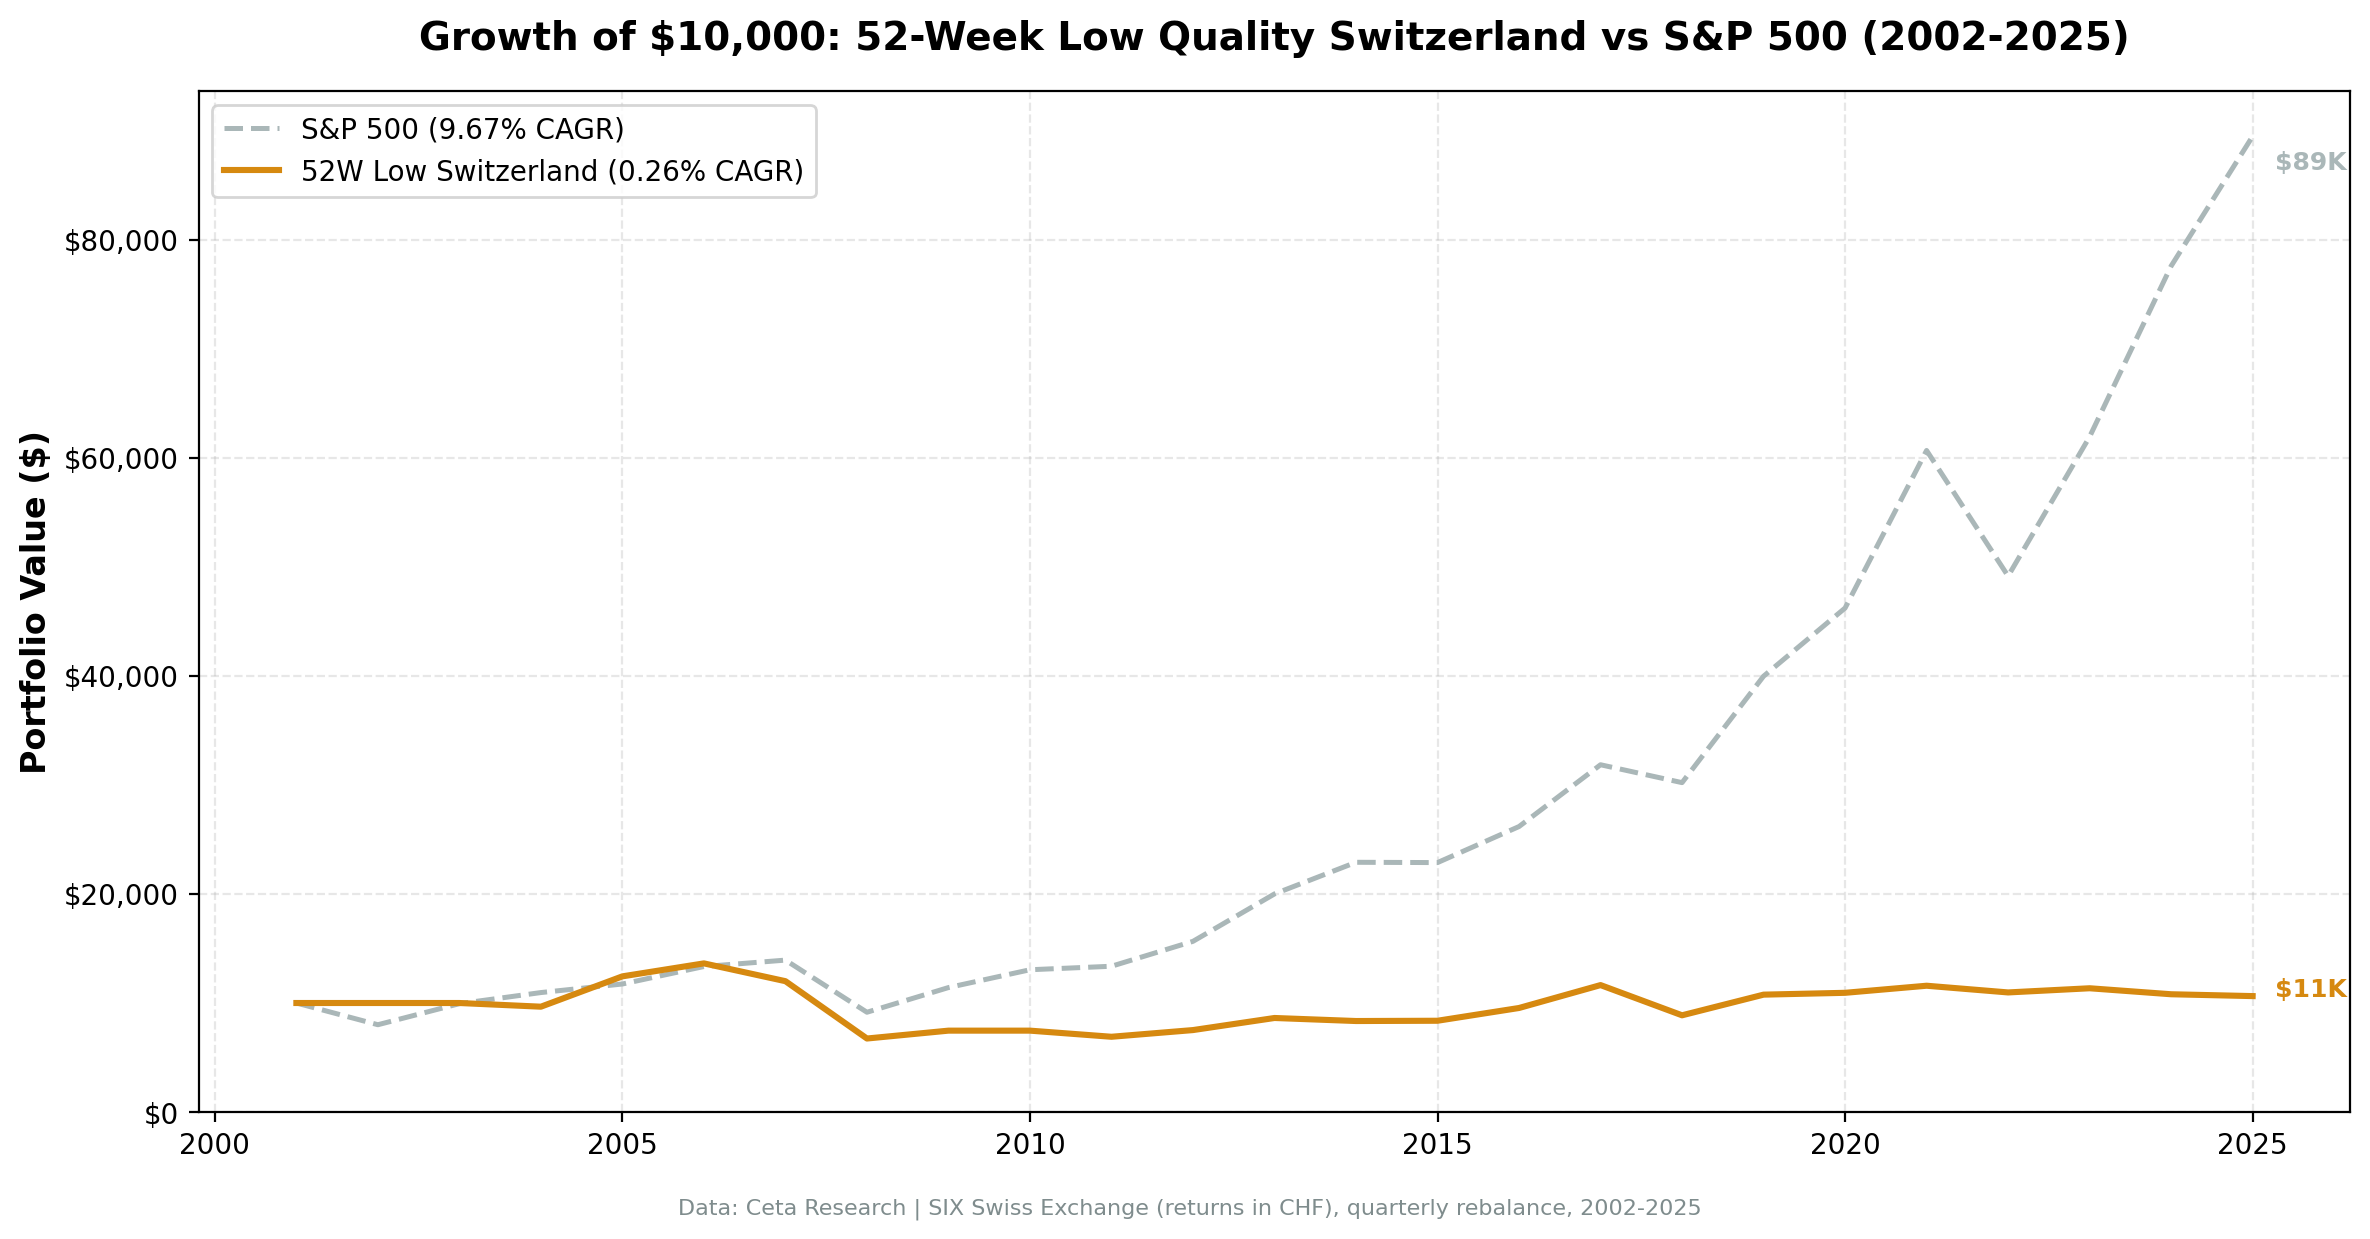
Buying stocks near their annual lows sounds like a straightforward mean-reversion play. Add a Piotroski quality filter to avoid value traps and you have a disciplined, testable strategy. We ran it on the SIX Swiss Exchange from 2002 through 2025. The result: $10,000 became $10,634 over 24 years.
Contents
- Method
- What We Found
- Year-by-Year
- Why Switzerland Doesn't Work for This Strategy
- Run It Yourself
- Limitations
That's not a typo. Near-zero returns. Negative real returns. And a max drawdown worse than SPY.
Here's why Switzerland breaks this strategy, and what it tells you about where mean reversion actually works.
Method
The screen is simple. Every quarter (January, April, July, October), identify stocks trading within 15% of their 52-week low. Keep only those with a Piotroski F-score of 7 or higher. That filter removes companies with deteriorating fundamentals, the ones near lows for good reason.
From qualifying names, hold up to 30 stocks equal-weight. Minimum 5 to deploy capital at all. If fewer than 5 qualify, sit in cash. Costs: 0.1% per trade. Filing lag: 45 days (financial statements available with a delay).
Benchmark throughout: SPY, 9.67% CAGR over the same period.
What We Found
| Metric | 52-Low Quality (SIX) | SPY |
|---|---|---|
| CAGR | 0.26% | 9.67% |
| Total Return | 6.34% | 789.42% |
| Excess Return vs SPY | -9.41% | — |
| Max Drawdown | -55.27% | -45.53% |
| Sharpe Ratio | -0.018 | 0.461 |
| Sortino Ratio | -0.025 | — |
| Calmar Ratio | 0.005 | — |
| Volatility | 13.58% | — |
| Up-Capture | 33.07% | — |
| Down-Capture | 60.11% | — |
| Beta | 0.483 | — |
| Alpha | -4.67% | — |
| Win Rate vs SPY | 31.58% | — |
| Cash Periods | 23/95 quarters | — |
| Avg Stocks (when invested) | 17.7 | — |
| $10k → | $10,634 | $89,485 |
The Sharpe of -0.018 means you were worse off than holding cash. The max drawdown of -55.27% is worse than SPY's -45.53%, despite the portfolio running at 13.58% volatility vs SPY's higher volatility. Lower vol, bigger drawdown. That combination tells you something specific: the losses weren't fast and furious. They were slow and grinding.
Year-by-Year
| Year | Portfolio | SPY |
|---|---|---|
| 2002 | Cash | -19.92% |
| 2003 | Cash | +24.12% |
| 2004 | -3.38% | +10.24% |
| 2005 | +28.80% | +7.17% |
| 2006 | +4.11% | +13.65% |
| 2007 | -11.97% | +4.40% |
| 2008 | -43.81% | -34.31% |
| 2009 | +18.24% | +24.73% |
| 2010 | 0% (cash) | +12.84% |
| 2011 | -8.33% | +2.46% |
| 2012 | Cash | +13.61% |
| 2013 | Cash | +29.64% |
| 2014 | +6.55% | +11.76% |
| 2015 | +0.30% | -0.12% |
| 2016 | +3.18% | +9.54% |
| 2017 | +12.44% | +19.42% |
| 2018 | -23.80% | -5.15% |
| 2019 | +21.35% | +32.31% |
| 2020 | -7.12% | +16.26% |
| 2021 | +9.88% | +26.89% |
| 2022 | -5.31% | -18.99% |
| 2023 | +4.10% | +26.03% |
| 2024 | -4.84% | +25.28% |
| 2025 | +1.22% | +3.11% |
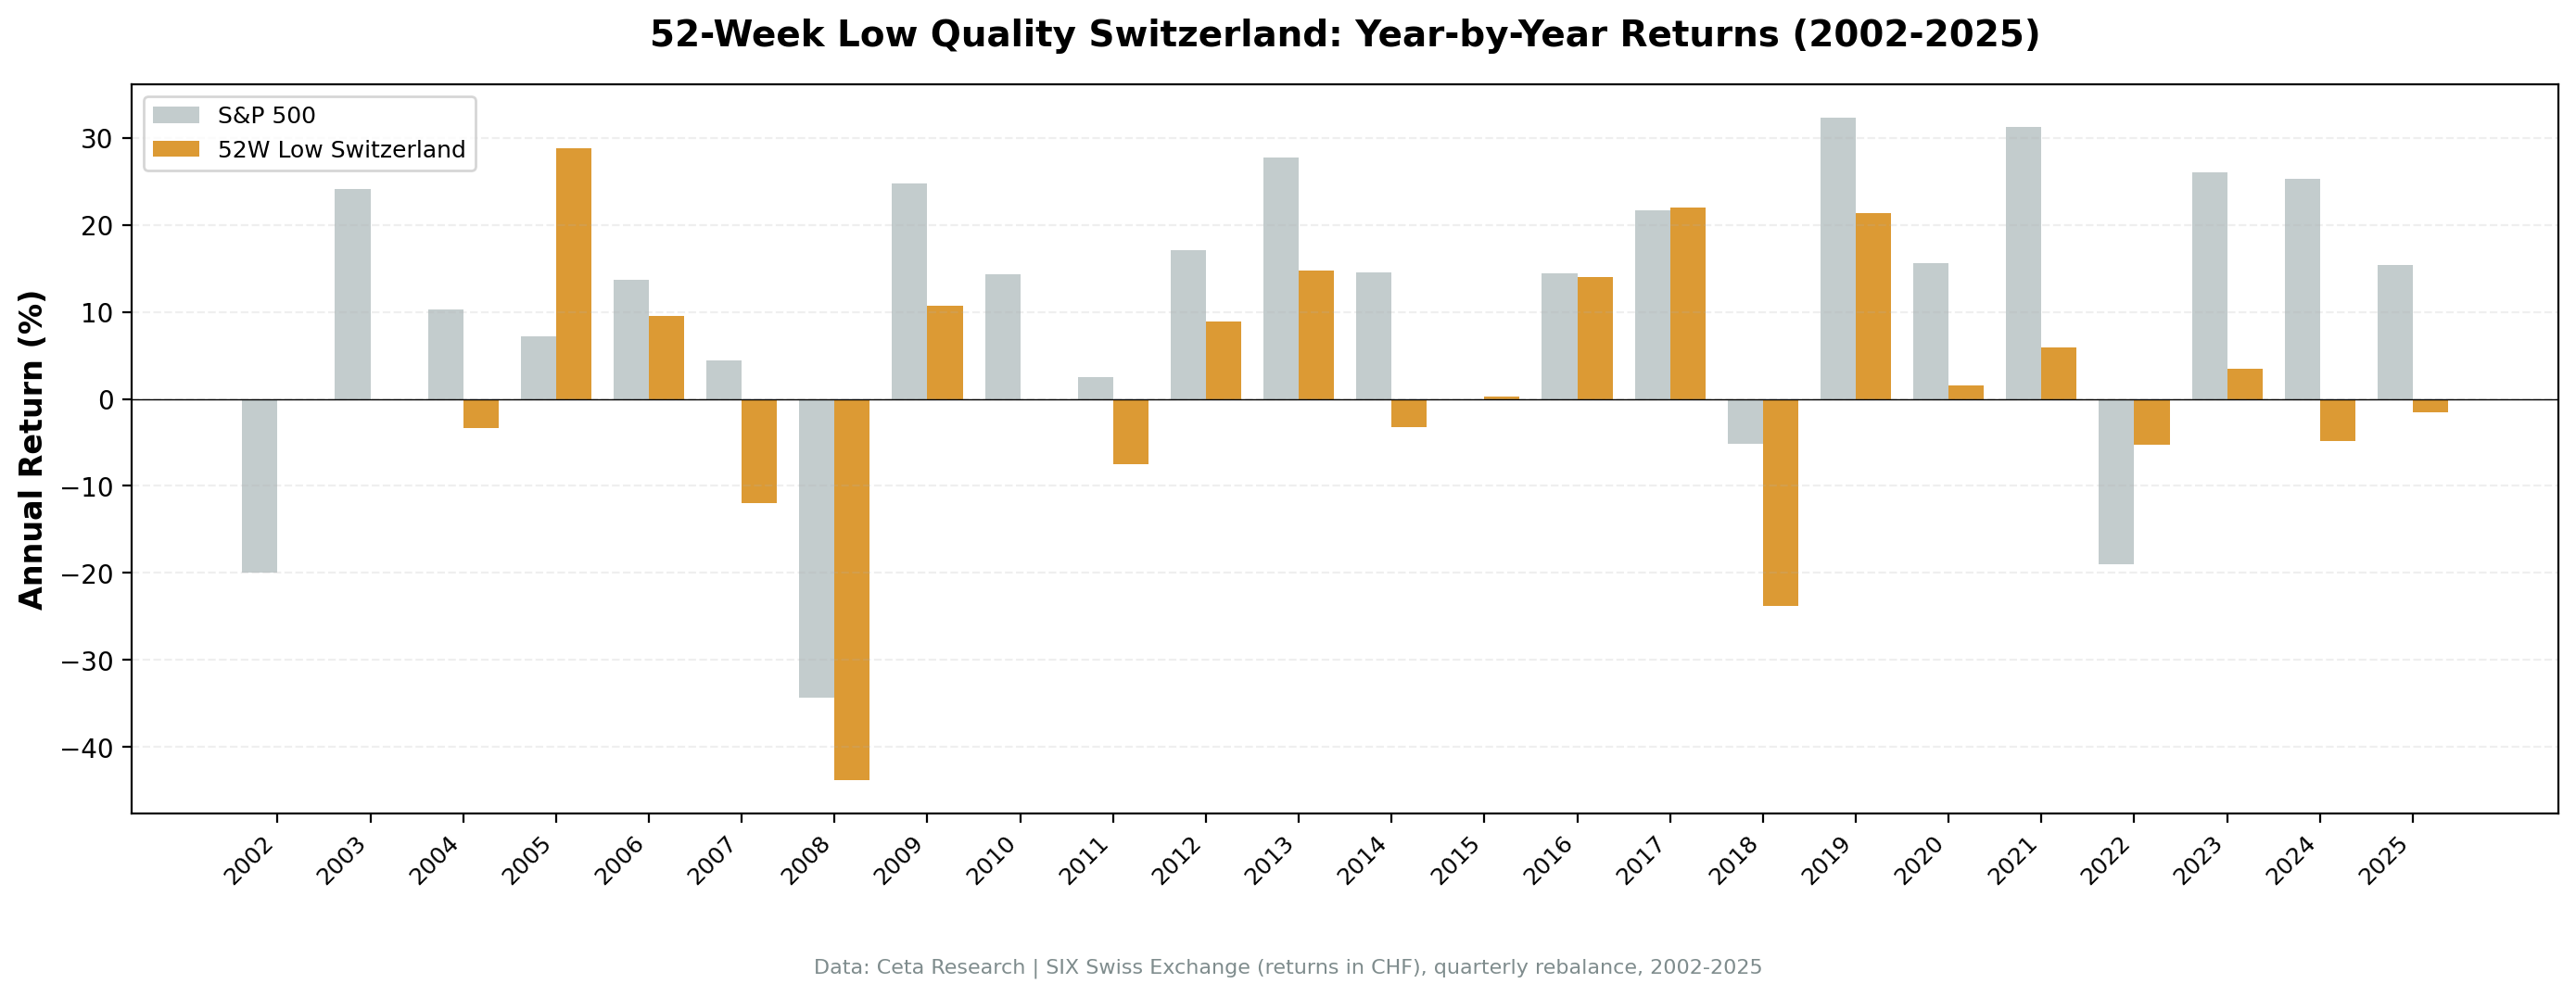
2005 was the one real bright spot: +28.80%. A handful of Swiss industrials and specialty chemicals names all hit lows simultaneously and recovered. That's the strategy working exactly as designed.
But look at what surrounds it. Two cash years in 2002-2003. A bad 2007. Then 2008 hit harder than SPY. The 2010, 2012, and 2013 cash periods meant missing the post-crisis recovery entirely. And then 2018 delivered a -23.80% loss against SPY's -5.15%, followed by a recovery year where the portfolio gained 21% but SPY gained 32%.
The pattern is systematic underperformance with no compensating factor.
Why Switzerland Doesn't Work for This Strategy
The SIX Swiss Exchange has a structural composition problem for this screen.
The three largest constituents by market cap are Nestlé, Novartis, and Roche. Together they represent a disproportionate share of total Swiss market cap. These are global mega-cap defensive businesses. They don't trade near 52-week lows very often. When they do, it's usually for macro reasons (currency moves, regulatory headlines) rather than temporary operational weakness that corrects over a quarter.
The screen found an average of 17.7 qualifying stocks when it had anything to invest in at all. That's well below the 30-stock target. In some quarters, you'd be running a portfolio of 8-12 names, concentrated by necessity, not by choice. The 23/95 cash periods (24% of all quarters) mean the strategy missed a quarter of all market time entirely.
When the strategy did fire, it tended to capture smaller Swiss companies in sectors like specialty manufacturing, financial services, and pharmaceuticals. Those names have genuine mean-reversion potential. But the portfolio concentration amplified idiosyncratic risk. A few bad picks in a 12-stock portfolio hurt much more than the same picks in a 30-stock portfolio.
The -55.27% max drawdown is the most damning number. Swiss stocks near their lows don't mean-revert quickly during market stress. The 2008 drawdown was -43.81%, worse than SPY's -34.31%. Large stable Swiss companies, the kind that Piotroski flags as "quality", can maintain their fundamental scores while still declining 30-40% in a global risk-off environment. The Piotroski filter identifies financial health, not market sentiment resilience.
One partial positive: in 2022, the portfolio lost 5.31% while SPY lost 18.99%. There's some inflation-driven defensiveness in Swiss stocks. But it's not enough to make this a viable strategy.
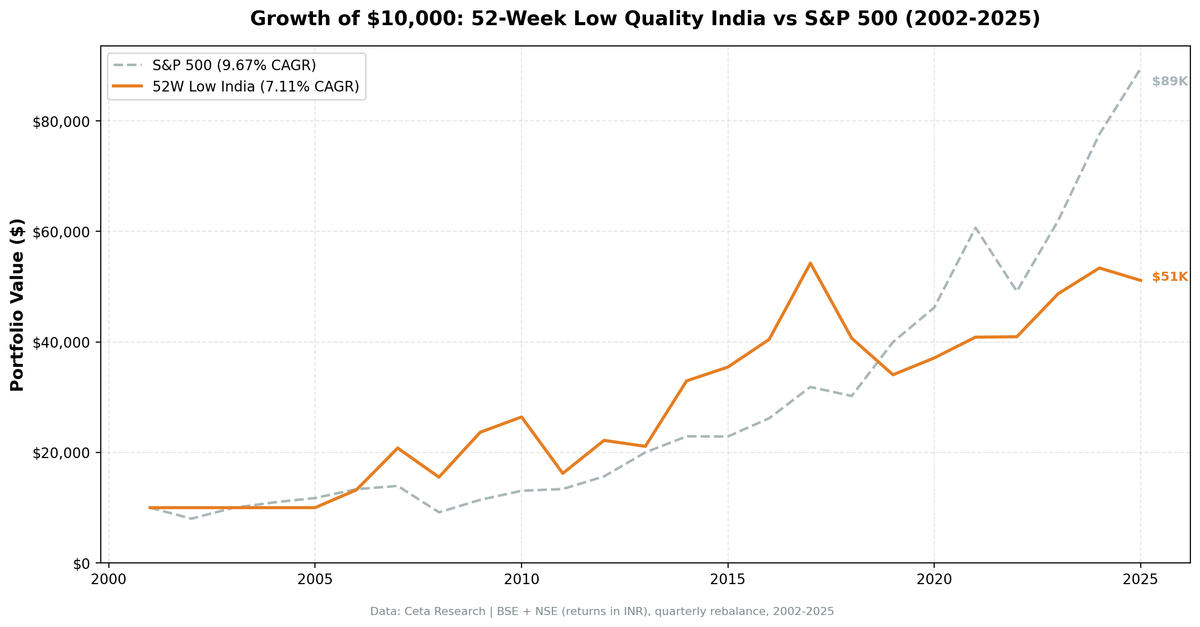
Part of a Series: Global | US | India | Hong Kong | Germany | China | Canada
Run It Yourself
The live screen below shows current Swiss stocks within 15% of their 52-week low with Piotroski F-score ≥ 7.
WITH
inc AS (
 SELECT symbol, netIncome, grossProfit, revenue,
 ROW_NUMBER() OVER (PARTITION BY symbol ORDER BY dateEpoch DESC) AS rn
 FROM income_statement WHERE period = 'FY' AND netIncome IS NOT NULL
),
bal AS (
 SELECT symbol, totalAssets, totalCurrentAssets, totalCurrentLiabilities,
 longTermDebt, totalStockholdersEquity,
 ROW_NUMBER() OVER (PARTITION BY symbol ORDER BY dateEpoch DESC) AS rn
 FROM balance_sheet WHERE period = 'FY' AND totalAssets > 0
),
cf AS (
 SELECT symbol, operatingCashFlow,
 ROW_NUMBER() OVER (PARTITION BY symbol ORDER BY dateEpoch DESC) AS rn
 FROM cash_flow_statement WHERE period = 'FY' AND operatingCashFlow IS NOT NULL
),
piotroski AS (
 SELECT ic.symbol,
 CASE WHEN ic.netIncome > 0 THEN 1 ELSE 0 END
 + CASE WHEN cfc.operatingCashFlow > 0 THEN 1 ELSE 0 END
 + CASE WHEN (ic.netIncome/bc.totalAssets) > (ip.netIncome/bp.totalAssets) THEN 1 ELSE 0 END
 + CASE WHEN cfc.operatingCashFlow/bc.totalAssets > ic.netIncome/bc.totalAssets THEN 1 ELSE 0 END
 + CASE WHEN (COALESCE(bc.longTermDebt,0)/bc.totalAssets) < (COALESCE(bp.longTermDebt,0)/bp.totalAssets) THEN 1 ELSE 0 END
 + CASE WHEN (bc.totalCurrentAssets/bc.totalCurrentLiabilities) > (bp.totalCurrentAssets/bp.totalCurrentLiabilities) THEN 1 ELSE 0 END
 + CASE WHEN bc.totalStockholdersEquity >= bp.totalStockholdersEquity THEN 1 ELSE 0 END
 + CASE WHEN (ic.revenue/bc.totalAssets) > (ip.revenue/bp.totalAssets) THEN 1 ELSE 0 END
 + CASE WHEN (ic.grossProfit/ic.revenue) > (ip.grossProfit/ip.revenue) THEN 1 ELSE 0 END
 AS f_score
 FROM (SELECT * FROM inc WHERE rn=1) ic
 JOIN (SELECT * FROM inc WHERE rn=2) ip ON ic.symbol = ip.symbol
 JOIN (SELECT * FROM bal WHERE rn=1) bc ON ic.symbol = bc.symbol
 JOIN (SELECT * FROM bal WHERE rn=2) bp ON ic.symbol = bp.symbol
 JOIN (SELECT * FROM cf WHERE rn=1) cfc ON ic.symbol = cfc.symbol
),
prices_52w AS (
 SELECT symbol,
 LAST_VALUE(adjClose) OVER (PARTITION BY symbol ORDER BY dateEpoch ROWS BETWEEN UNBOUNDED PRECEDING AND UNBOUNDED FOLLOWING) AS current_price,
 MIN(adjClose) OVER (PARTITION BY symbol) AS low_52w
 FROM stock_eod
 WHERE date >= CURRENT_DATE - INTERVAL '365 days' AND adjClose > 0
),
price_summary AS (
 SELECT symbol, MAX(current_price) AS current_price, MIN(low_52w) AS low_52w
 FROM prices_52w GROUP BY symbol
)
SELECT pio.symbol, p.companyName, p.sector,
 pio.f_score,
 ROUND(ps.current_price, 2) AS current_price,
 ROUND(ps.low_52w, 2) AS low_52w,
 ROUND((ps.current_price - ps.low_52w)/ps.low_52w * 100, 1) AS pct_above_low,
 ROUND(k.marketCap/1e9, 2) AS mktcap_b
FROM piotroski pio
JOIN profile p ON pio.symbol = p.symbol AND p.exchange = 'SIX'
JOIN price_summary ps ON pio.symbol = ps.symbol
JOIN key_metrics_ttm k ON pio.symbol = k.symbol
WHERE k.marketCap > 100000000
 AND pio.f_score >= 7
 AND (ps.current_price - ps.low_52w)/ps.low_52w <= 0.15
 AND ps.current_price >= 1.0
ORDER BY (ps.current_price - ps.low_52w)/ps.low_52w ASC
LIMIT 30
Run this on Ceta Research Data Explorer with your API key.
Limitations
Backtest-specific: The 2002–2025 period includes two global crashes (2008, 2020) and a long low-volatility regime (2013–2017). Results from a single exchange over 24 years are illustrative, not predictive.
Survivorship bias: Delisted companies are excluded. Swiss delisting events aren't catastrophic at the same rate as US small-caps, but this still overstates returns slightly.
Currency: All SIX returns are in CHF. The CHF/USD relationship affects USD-based investors. The Swiss franc's safe-haven appreciation can suppress equity returns in periods of global risk-off.
Market impact: The backtest assumes 0.1% per trade. For smaller Swiss names, actual spreads and market impact could be higher.
Piotroski lag: The 45-day filing lag is conservative for Swiss companies, but annual report translations and filing inconsistencies across the exchange can add noise.
This strategy works in specific market structures. Switzerland doesn't fit that profile. Understanding where it fails is as useful as knowing where it succeeds.
Data: Ceta Research (FMP financial data warehouse), 2002–2025. Full methodology: backtests/METHODOLOGY.md. Backtest code: backtests/52-week-low/.


