
Altman Z-Score on Indian Stocks: Distress Zone Destroys 8.3% Per Year vs Sensex
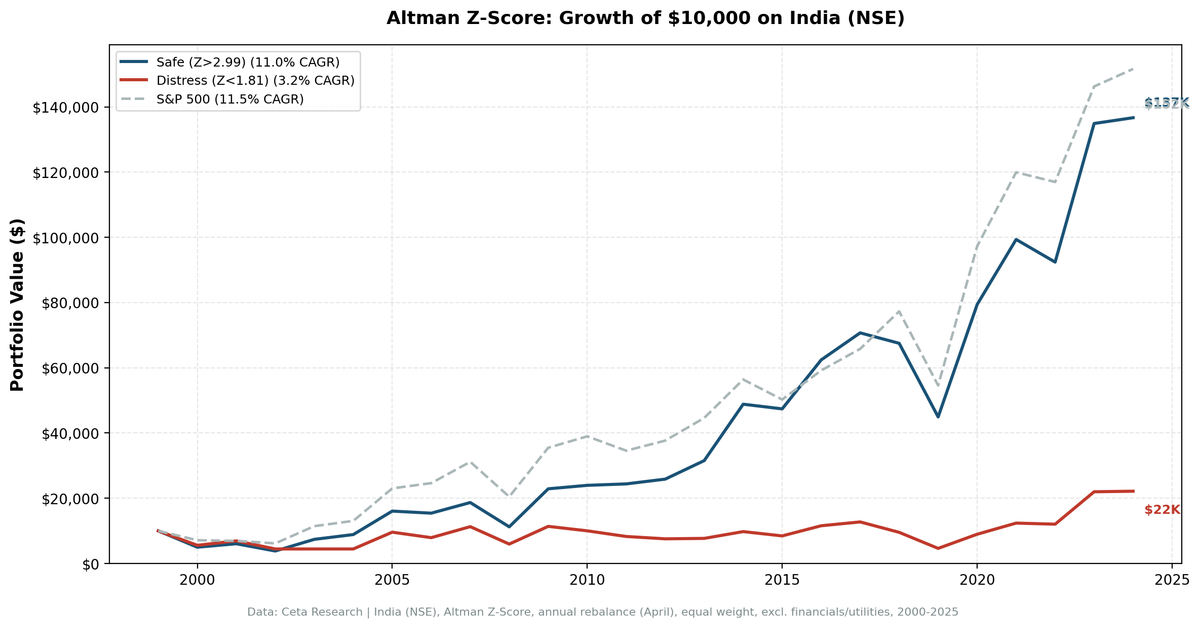
We backtested the Altman Z-Score on NSE stocks from 2000 to 2025. Safe-zone stocks returned 11.0% CAGR vs the Sensex at 11.5%. Distress-zone stocks returned just 3.2%. The +7.8% spread is the widest across any exchange tested. In India, distress destroys capital.

Altman Z-Score Backtest on Indian Stocks: Distress Zone Destroys Capital
The Altman Z-Score doesn't do much in the US. Safe-zone stocks trail the S&P 500, and the spread between safe and distressed companies runs negative. India shows the opposite for the spread, but not the way you'd expect.
Contents
- Method
- What We Found
- The distress signal is cleaner than the safe signal
- Why It Works in India
- Decade Breakdown
- Run This Screen Yourself
- Limitations
- Takeaway
We tested the same methodology on NSE stocks from 2000 to 2025. Safe-zone stocks returned 11.0% annually while distress-zone stocks returned just 3.2%. That's a +7.8% annual spread, the widest we've seen across any exchange. But the Sensex returned 11.5% over the same period. Safe-zone stocks roughly matched the market. Distress-zone stocks collapsed against it.
The Z-Score in India isn't a market-beating signal. It's a distress detector. Companies below Z = 1.81 delivered 8.3% less per year than the market. That gap is real, persistent, and worth understanding.
Part of a series. See the US backtest for methodology and the Z-Score formula.
Data: FMP financial data warehouse, 2000-2025. Updated June 2026.
Method
| Parameter | Value |
|---|---|
| Universe | NSE (National Stock Exchange) |
| Market cap filter | > 20B INR (~$240M USD) |
| Exclusions | Financial Services, Utilities |
| Rebalancing | Annual (April 1) |
| Weighting | Equal weight |
| Signal | Altman Z-Score zones |
| Data source | FMP via Ceta Research warehouse |
| Benchmark | Sensex (local, INR-denominated) |
| Period | 2000-2025 (25 years) |
| Execution | MOC (next-day close) |
The Z-Score formula:
Z = 1.2(WC/TA) + 1.4(RE/TA) + 3.3(EBITDA/TA) + 0.6(MktCap/TL) + 1.0(Rev/TA)
Altman's original model uses EBIT in the third term. We use EBITDA, a close and more consistently reported proxy. Three zones: Safe (Z > 2.99), Gray (1.81 to 2.99), Distress (Z < 1.81). Financial Services and Utilities are excluded because their balance sheet structures make the Z-Score meaningless.
What We Found
25-year summary (2000-2025):
| Portfolio | CAGR | Sharpe | Max Drawdown | Avg Holdings |
|---|---|---|---|---|
| Safe Zone (Z > 2.99) | 11.0% | 0.112 | -61.7% | 149 stocks |
| Gray Zone (1.81-2.99) | 10.2% | 0.094 | -54.1% | 36 stocks |
| Distress Zone (Z < 1.81) | 3.2% | -0.072 | -63.6% | 38 stocks |
| All ex-Distress | 9.4% | 0.073 | -61.7% | |
| Sensex | 11.5% | -- |
The Safe-Distress spread is +7.8% per year. The distress portfolio's Sharpe is negative, meaning you'd have been better off in risk-free assets than holding distress-zone Indian stocks. Safe-zone stocks returned 11.0% vs the Sensex's 11.5%, a gap of -0.46% per year.
The spread is the story here, not alpha generation. Safe zone roughly tracked the market. Distress zone collapsed. The signal's value is in the stocks it filters out.
The distress signal is cleaner than the safe signal
Safe and Gray zone stocks returned very similar CAGRs (11.0% vs 10.2%). The Z-Score doesn't meaningfully separate "healthy" from "very healthy" in India. The clear signal is at the bottom: distress-zone stocks returned only 3.2% annually. That's 8.3% per year less than the Sensex over 25 years.
The Distress portfolio had 2 cash periods (years when fewer than the minimum stocks qualified), reflecting India's smaller universe after financial/utility exclusions. The Safe portfolio had zero cash periods.
Why It Works in India
The US results for the Z-Score are underwhelming. So why does it work in India?
Distress leads to equity wipeouts. Indian bankruptcy law was effectively non-functional until the Insolvency and Bankruptcy Code (IBC) passed in 2016. Before that, distressed companies could limp along for years, eroding shareholder value through dilution, asset sales, and operational decline. Promoter pledging of shares, common in Indian markets, accelerates the downward spiral. When a promoter's pledged shares get margin-called, forced selling pushes the stock down further, which triggers more margin calls.
Capital markets are less forgiving. US distressed companies can tap high-yield bond markets, do distressed debt swaps, or find private equity sponsors willing to inject capital. Indian companies in distress have fewer options. Bank lending to weak credits has been constrained since the NPA crisis of the mid-2010s. The result: distress in India is more likely to be terminal.
Accounting quality varies more. Indian accounting standards have improved, but the tail risk of aggressive accounting is higher than in US large-caps. The Z-Score catches companies where the financial statements already show deterioration. In a market where some financial statements are optimistic, the companies that can't even paper over their distress are in serious trouble.
Decade Breakdown
| Period | Safe Zone | Distress Zone | Spread | Sensex |
|---|---|---|---|---|
| 2000-2004 | 9.5% | -11.1% | +20.6% | 11.5% |
| 2005-2009 | 32.4% | 36.9% | -4.5% | 29.7% |
| 2010-2014 | 17.9% | -1.8% | +19.7% | 10.5% |
| 2015-2019 | 0.8% | -8.6% | +9.4% | 1.2% |
| 2020-2025 | 28.4% | 42.4% | -14.0% | 25.5% |
Three of five periods show spreads above +9%. The 2000-2004 and 2010-2014 periods produced spreads above +19% annually. Both coincide with credit stress: post-dot-com in India's tech-adjacent companies, and the NPA crisis building across Indian banks in the early 2010s. When Indian companies couldn't refinance, the ones with weak balance sheets didn't recover.
2005-2009 inverted. The India bull market lifted everything, including distressed stocks, at 36.9% annualized. The spread collapsed to -4.5%. Easy liquidity compressed the quality premium.
2020-2025 also inverted. COVID recovery favored high-beta distressed stocks. Speculative retail flows surged in India post-pandemic. Whether this becomes a structural pattern or normalizes back toward historical averages is the key open question.
Safe-zone stocks tracked the Sensex closely in three of five periods. The most notable period: 2010-2014, where safe zone returned 17.9% vs Sensex 10.5%, a clear outperformance. 2000-2004 saw safe zone trail the Sensex despite the strong spread, because both portfolios lagged the broad market.
Run This Screen Yourself
The current Z-Score screen for Indian stocks:
SELECT s.symbol, p.companyName, s.altmanZScore,
    k.marketCap / 1e9 AS market_cap_b_inr, p.sector
FROM scores s
JOIN key_metrics_ttm k ON s.symbol = k.symbol
JOIN profile p ON s.symbol = p.symbol
WHERE s.altmanZScore > 3.0
  AND k.marketCap > 20000000000
  AND p.exchange = 'NSE'
  AND COALESCE(p.sector, '') NOT IN ('Financial Services', 'Utilities')
QUALIFY ROW_NUMBER() OVER (PARTITION BY s.symbol ORDER BY k.marketCap DESC) = 1
ORDER BY k.marketCap DESC
LIMIT 50
This pulls from the pre-calculated altmanZScore in the scores table. Market cap floor of 20B INR keeps results institutional-grade. The screen typically returns 100-150 stocks, concentrated in Technology, Healthcare, and Consumer sectors.
You can run this query at cetaresearch.com/data-explorer.
Limitations
INR-denominated financials. The Z-Score was designed for US dollar financial statements. Indian companies report in rupees. The ratios themselves (working capital/total assets, retained earnings/total assets) are scale-invariant, but the original cutoffs of 2.99 and 1.81 were calibrated on 1960s US manufacturing firms. The thresholds may not be optimal for Indian companies with different capital structures and accounting conventions.
Accounting standards differ. India transitioned from Indian GAAP to Ind AS (converged with IFRS) starting in 2016. Pre-2016 financial statements use different recognition and measurement rules. This creates a structural break in the data that could affect Z-Score comparisons across the full 25-year period.
Survivorship considerations. Companies that went bankrupt or delisted exit the database. The distress portfolio's 3.2% CAGR may overstate actual returns if some holdings went to zero and were retroactively removed from the data source.
2020-2025 inversion. The most recent five years show distress outperforming safe by 14.0 percentage points. This could be noise, a COVID anomaly, or a structural shift driven by increased retail participation in Indian markets. Five years isn't enough to declare the signal dead, but it's enough to warrant caution.
Currency exposure. Returns are computed from INR-denominated stock prices. For non-INR investors, currency depreciation (INR has lost roughly 50% against USD since 2000) would reduce realized returns. The CAGR figures assume a rupee-denominated investor.
Takeaway
The Z-Score in India is a distress detector, not a market-beating signal. Safe-zone stocks returned 11.0% annually, close to the Sensex at 11.5%. Distress-zone stocks returned 3.2%, massively underperforming. The +7.8% spread is the widest of any exchange we've tested.
In the US, distressed companies often survive through capital market access, restructuring, and legal protections. In India, the path from distress to permanent capital loss is shorter and more common. When an Indian company's Z-Score drops below 1.81, the market doesn't price that in fast enough. The underperformance compounds over years.
If you're building an Indian equity portfolio, the Z-Score's value is in identifying what to exclude. Companies with Z < 1.81 returned 8.3% less per year than the market. That's a meaningful risk reduction, even if it doesn't generate outperformance on the safe side.
Data: Ceta Research (FMP financial data warehouse), 2000-2025. Full methodology: backtests/METHODOLOGY.md
Past performance does not guarantee future results. This is educational content, not investment advice.


