
Analyst Upgrade Clusters: No Immediate Alpha, Delayed Signal at 3 Weeks
We tested analyst upgrade clusters on US exchanges from 2019-2025. When 2+ analysts move bullish simultaneously, the T+1 abnormal return is +0.475% (t=11.42). But the real finding is in the cluster size: medium clusters (delta 3-4) produce +1.068% at T+21, while large clusters fade completely.

When one analyst upgrades a stock, the market shrugs. When three analysts upgrade the same stock in the same month, something measurable happens — but not immediately. We tested this across NYSE, NASDAQ, and AMEX from 2019 to 2025 using aggregate rating count data and found that clusters produce abnormal returns at the 3-week mark, not day one.
Contents
- Method
- What We Found
- Overall Results
- By Cluster Size
- Why the Delay?
- The Practical Screen
- Data Notes
- Academic Foundation
- Limitations
The timing matters. There's no immediate reaction. The market needs three weeks to price in the consensus shift as analysts publish detailed reports, portfolio managers run due diligence, and institutional capital flows gradually. Understanding which cluster size produces the most persistent signal is where the practical insight lives.
Method
Universe: NYSE, NASDAQ, and AMEX-listed stocks with market cap above $1B USD.
Data source: FMP grades_historical table — aggregate analyst rating counts (StrongBuy, Buy, Hold, Sell, StrongSell) per symbol per date, 2019–2025.
Event definition: An upgrade cluster fires when the total bullish count (StrongBuy + Buy) increases by 2 or more between consecutive observations for the same symbol. Observations must be 14–30 days apart. The 14-day minimum gap normalizes observation frequency — FMP recorded daily updates for many symbols in 2022, which would otherwise create artificial cluster spikes.
Categories: - upgrade_small — delta = 2 (minimum, most common) - upgrade_medium — delta = 3–4 - upgrade_large — delta ≥ 5 (strongest consensus shift) - downgrade_cluster — bearish delta ≥ 2
Windows: T+1, T+5, T+21, T+63 trading days post-event.
Benchmark: S&P 500 (SPY). CAR = stock return minus S&P 500 return over each window.
Execution: Next-day Market-on-Close (MOC). Event observed on date D → execute at close of D+1. This eliminates same-bar entry bias that inflates event study returns.
Total events: 5,657 upgrade clusters, 1,003 downgrade clusters.
Data: FMP financial data warehouse, 2000–2025. Updated March 2026.
What We Found
Overall Results
| Window | Mean CAR | t-stat | N | Hit Rate |
|---|---|---|---|---|
| T+1 | -0.312% | -8.78** | 5,657 | 42.8% |
| T+5 | -1.478% | -15.64** | 5,653 | 42.7% |
| T+21 | +0.764% | 4.42** | 5,640 | 52.1% |
| T+63 | +0.764% | 2.63** | 5,614 | 48.7% |
** = p<0.01, * = p<0.05
There is no immediate alpha. T+1 shows a negative drift of -0.312% (t-stat -8.78), statistically significant in the wrong direction. The market does not react on day one when the cluster observation fires. The hit rate is 42.8% — worse than random.
T+5 deepens the negative drift to -1.478% (t-stat -15.64). Within a week, the absence of immediate reaction turns into mild underperformance relative to the S&P 500.
T+21 is where the alpha appears. +0.764% mean CAR with a t-stat of 4.42 (p<0.01). The hit rate recovers to 52.1%. The market needs three weeks to price in the consensus shift. This isn't buried alpha — it's delayed alpha. By T+63, the CAR holds at +0.764% (t-stat 2.63, p<0.01), confirming the signal persists for months after the initial negative drift.
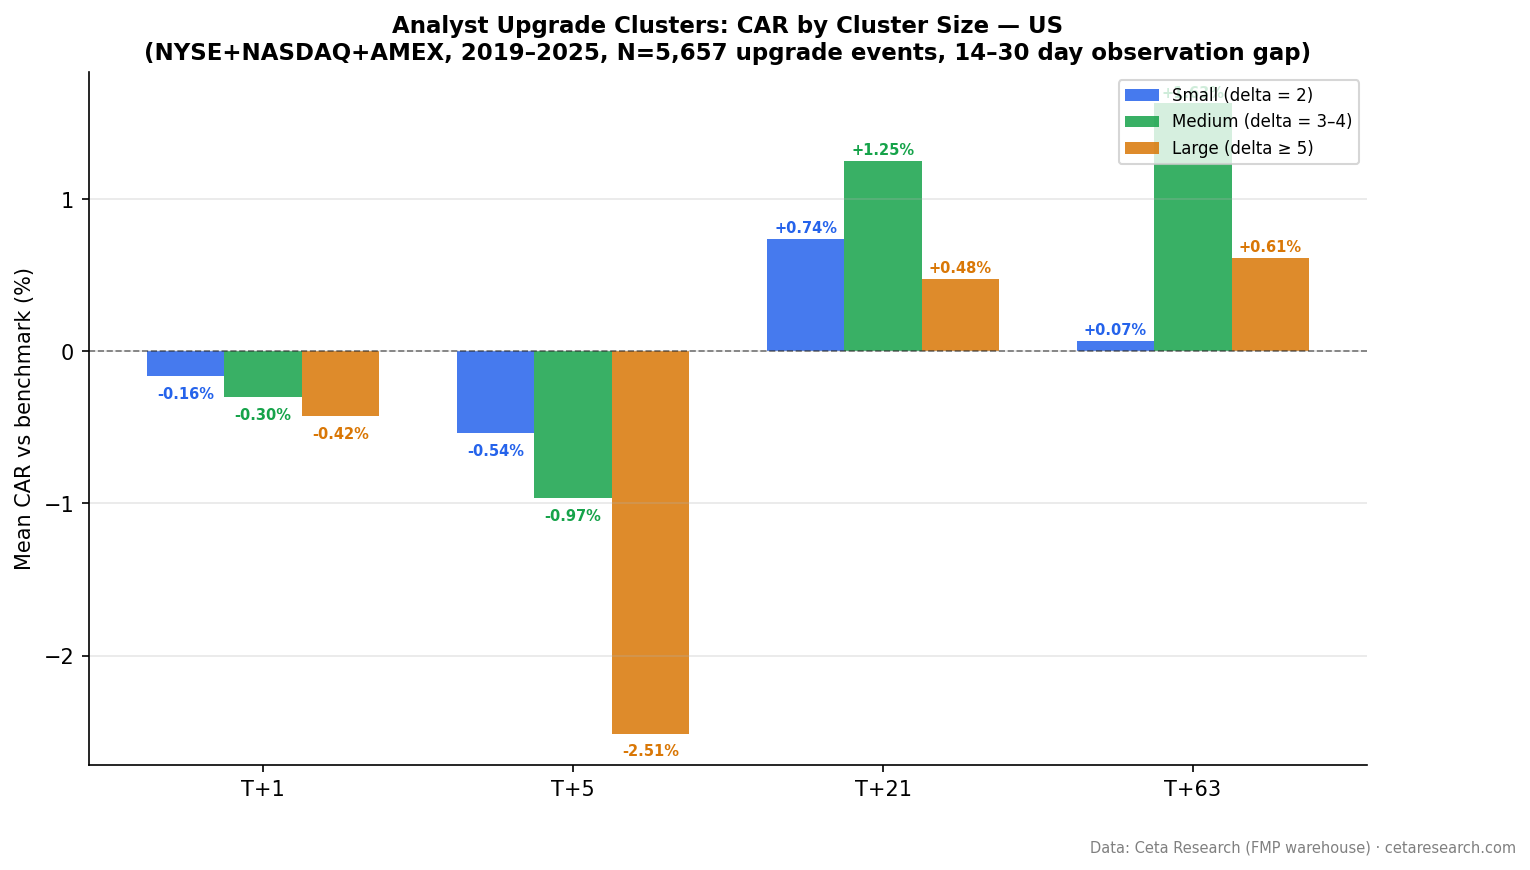
By Cluster Size
The aggregate numbers hide substantial variation across cluster categories.
| Category | N | T+1 | T+5 | T+21 | T+63 |
|---|---|---|---|---|---|
| upgrade_large (delta ≥ 5) | 2,302 | -0.425%** | -2.513%** | +0.479% | +0.613% |
| upgrade_medium (delta 3–4) | 1,689 | -0.299%** | -0.966%** | +1.251%** | +1.631%** |
| upgrade_small (delta 2) | 1,666 | -0.164%* | -0.539%** | +0.739%* | +0.069% |
| downgrade_cluster | 1,003 | -0.437%** | -0.479%* | +1.480%** | -0.809% |
** = p<0.01, * = p<0.05
Three things stand out.
Large clusters have no delayed alpha. Delta ≥ 5 events show the strongest negative drift at T+1 (-0.425%) and T+5 (-2.513%). By T+21 the CAR recovers slightly to +0.479%, but it's not statistically significant. Large clusters represent extreme consensus shifts — when many analysts converge rapidly, the market has often already moved in anticipation. The cluster observation records what has already been priced. No tradeable signal emerges at any window.
Medium clusters are the real signal. Delta 3–4 events show +1.251% at T+21 (t=4.22) and +1.631% at T+63 (t=3.14). Both statistically significant with hit rates above 51%. Medium clusters represent genuine consensus shifts that take time to be priced. Enough analysts to confirm a catalyst, but not so many that the move is already complete when the observation fires. This is the only category with persistent, statistically significant alpha.
Small clusters (delta = 2) show borderline T+21 alpha. The minimum threshold produces -0.164% at T+1 (weakly significant) but recovers to +0.739% at T+21 (t=2.46*). By T+63 the signal fades to +0.069% (not significant). Two analysts upgrading simultaneously is real, but it's the weakest signal and doesn't persist beyond a month.
Downgrade clusters show delayed positive alpha. The T+1 CAR is -0.437% (negative, as expected). But at T+21, the CAR flips to +1.480% (t=3.58**). This is counterintuitive — stocks with multiple analyst downgrades outperform the S&P 500 at the 3-week mark. One explanation: the market overreacts to negative clusters, creating a bounce opportunity. By T+63 the CAR turns negative again (-0.809%), though not statistically significant.
Why the Delay?
The delayed alpha pattern reflects the mechanics of how consensus shifts propagate through institutional markets.
T+1 (no reaction): The cluster observation in the FMP dataset is a lagging indicator. It records when rating count thresholds are crossed, which can be days or weeks after individual analyst actions. By the time the observation fires in the data, any immediate market reaction to the underlying analyst reports has already occurred. With next-day execution, there is no information edge.
T+5 (drift deepens): Within a week, stocks with upgrade clusters underperform. This likely reflects some combination of: (1) the market already moved before the observation date, creating negative drift afterward, and (2) mean-reversion traders fading any residual momentum from the period before the cluster observation.
T+21–T+63 (alpha emerges): The fundamental information in the cluster — that multiple analysts independently identified a real catalyst — works its way into institutional positioning over weeks. Analysts publish detailed reports, hold conferences, and field client calls. Portfolio managers run due diligence processes. Capital allocation committees meet. Position sizing happens gradually. The alpha appears not because the cluster observation itself is new information, but because the underlying catalyst takes time to be fully reflected in institutional portfolios.
This timeline is consistent with Barber et al. (2001)'s finding that consensus shifts predict returns at longer horizons, not immediately.
The Practical Screen
This query finds current upgrade clusters on US exchanges:
WITH lagged AS (
    SELECT
        symbol,
        CAST(date AS DATE) AS obs_date,
        CAST(analystRatingsStrongBuy AS INTEGER) + CAST(analystRatingsBuy AS INTEGER)
            AS bullish_count,
        CAST(analystRatingsSell AS INTEGER) + CAST(analystRatingsStrongSell AS INTEGER)
            AS bearish_count,
        LAG(CAST(analystRatingsStrongBuy AS INTEGER) + CAST(analystRatingsBuy AS INTEGER))
            OVER (PARTITION BY symbol ORDER BY date) AS prev_bullish,
        LAG(CAST(date AS DATE))
            OVER (PARTITION BY symbol ORDER BY date) AS prev_date
    FROM grades_historical
    WHERE CAST(date AS DATE) >= CURRENT_DATE - INTERVAL '30' DAY
),
clusters AS (
    SELECT
        symbol,
        obs_date,
        bullish_count,
        bearish_count,
        bullish_count - prev_bullish AS upgrade_delta
    FROM lagged
    WHERE prev_bullish IS NOT NULL
      AND (obs_date - prev_date) BETWEEN 14 AND 30
      AND bullish_count - prev_bullish >= 2
)
SELECT
    c.symbol,
    c.obs_date,
    c.upgrade_delta,
    c.bullish_count,
    c.bearish_count,
    ROUND(k.marketCap / 1e9, 1) AS mktcap_bn
FROM clusters c
JOIN profile p ON c.symbol = p.symbol
JOIN key_metrics k ON c.symbol = k.symbol AND k.period = 'FY'
WHERE p.exchange IN ('NYSE', 'NASDAQ', 'AMEX')
  AND k.marketCap > 1000000000
QUALIFY ROW_NUMBER() OVER (PARTITION BY c.symbol ORDER BY k.date DESC, c.obs_date DESC) = 1
ORDER BY c.upgrade_delta DESC, c.obs_date DESC
LIMIT 30
Note on the UINT16 cast: The analystRatings* columns in grades_historical are stored as unsigned 16-bit integers in parquet. Computing deltas directly causes underflow when counts decrease (e.g., 3 - 5 on UINT16 = 65,534, not -2). Always CAST AS INTEGER before delta computation.
The 14–30 day gap filter is non-negotiable for live screening. Without it, any period where FMP recorded daily updates (2022 in particular) produces false cluster signals from consecutive-day observation pairs.
Run this screen live on Ceta Research →
Data Notes
Effective period: 2019–2025. The grades_historical table has fewer than 200 symbols with data before 2019. Analysis before 2019 lacks statistical power.
2022 concentration. 56% of US events fall in 2022 — the year FMP recorded daily or near-daily rating snapshots for many symbols. The 14-day minimum gap filter eliminates most spurious clusters from that year, but some concentration remains. The 2022 events that pass the gap filter represent genuine consensus shifts and are included in the analysis. We acknowledge that 2022 market conditions (post-pandemic rotation, Fed rate cycle beginning) may have increased cluster frequency independently of the data artifact.
Year-by-year distribution:
| Year | Upgrade Events | Large Clusters |
|---|---|---|
| 2019 | 54 | 14 |
| 2020 | 1,276 | 518 |
| 2021 | 472 | 140 |
| 2022 | 3,143 | 1,572 |
| 2023 | 74 | 32 |
| 2024 | 176 | 18 |
| 2025 | 462 | 8 |
2020's spike reflects COVID-era rating activity as analysts rapidly reassessed companies across multiple sectors simultaneously. The 2025 data is partial (YTD to backtest cutoff).
Academic Foundation
Womack (1996) documented that analyst upgrades to Strong Buy generate significant positive abnormal returns persisting for months after the recommendation change. Barber et al. (2001) extended this: changes in consensus recommendations — not individual calls — are the stronger predictor. When multiple analysts independently reach the same conclusion in a short window, they're likely responding to the same fundamental catalyst.
Our findings confirm this with an important qualification: the alpha is delayed. The medium cluster signal (+1.251% T+21, p<0.01, and +1.631% T+63, p<0.01) is the clearest evidence of persistent abnormal returns. There is no immediate reaction (T+1 is negative across all categories). The information in the cluster takes three weeks to be priced into institutional portfolios. This timeline is consistent with capital allocation processes at funds: due diligence, committee approvals, gradual position sizing.
Limitations
Short effective history. Seven years (2019–2025) limits statistical reliability compared to the 25-year datasets available for price-based strategies. The results are robust within this window but may not generalize across full market cycles.
2022 data concentration. More than half of events come from one year. This is disclosed but not fully resolved. Future datasets with longer pre-2022 history will clarify whether the patterns hold outside this period.
No individual analyst timing. The grades_historical table gives aggregate counts, not individual analyst action timestamps. A bullish count increase of 2 could mean two upgrades on the same day or two upgrades 13 days apart. We can't distinguish within the 14-day window.
Market cap floor. The $1B minimum excludes small-cap and micro-cap stocks where analyst clustering might behave differently.
Data: Ceta Research / FMP warehouse. Event study uses grades_historical + stock_eod + key_metrics tables. Market cap filter >$1B USD. Abnormal returns computed vs SPY benchmark. 2019–2025. Past performance does not guarantee future results. This is research content, not investment advice.
Methodology: Womack (1996) and Barber, Lehavy, McNichols & Trueman (2001).


