
Analyst Upgrades Across 5 Markets: What Works, What Fades, What Reverses
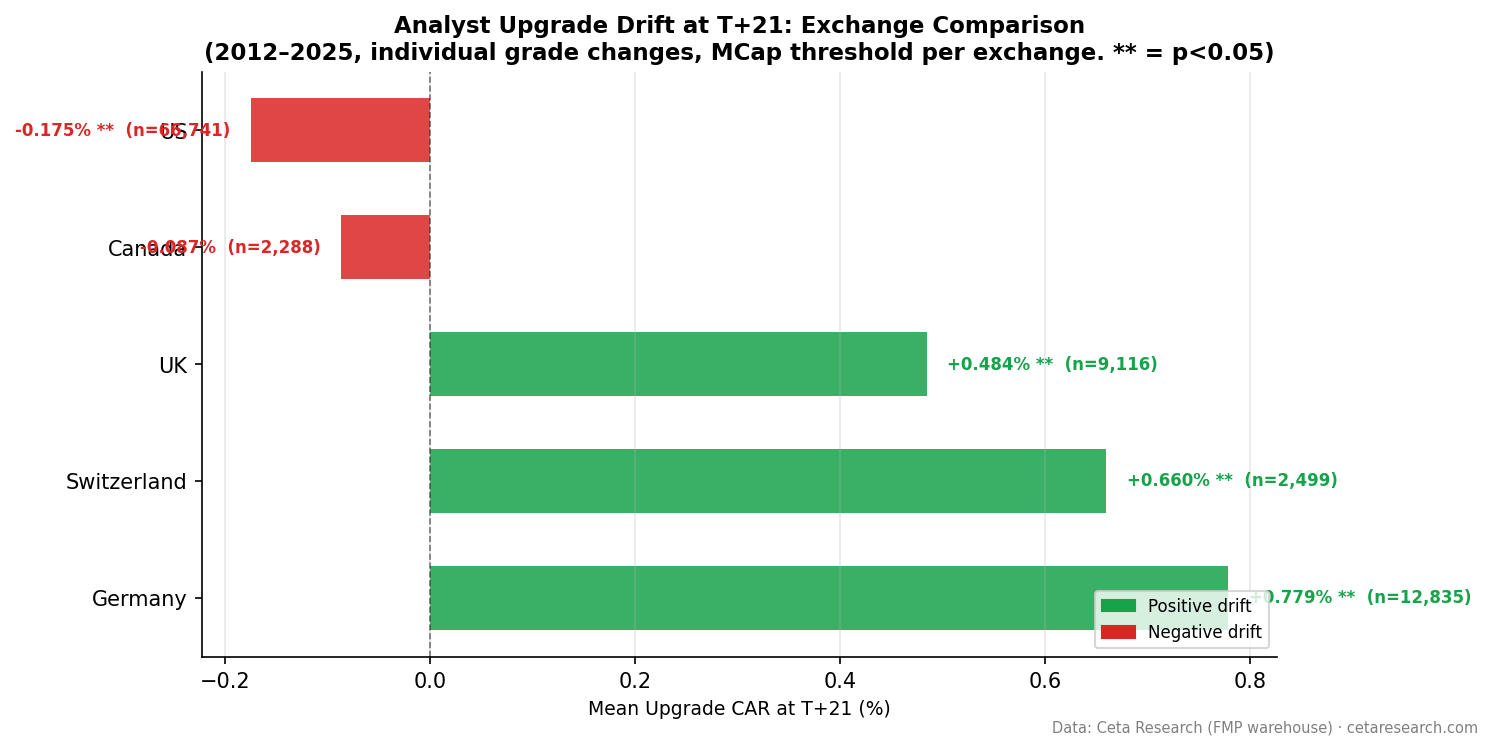
We measured 136,479 analyst rating revision events across US, Germany, UK, Switzerland, and Canada from 2012 to 2025 using next-day-close entry. The US is the only market where upgrades underperform after the announcement day (-0.18% at T+21). Germany, UK, and Switzerland show sustained drift....

We measured 136,479 analyst rating revision events (upgrades and downgrades) across US, Germany, UK, Switzerland, and Canada from 2012 to 2025. Every market shows a price reaction on announcement day. What differs is whether that reaction continues after the next trading day's close.
Contents
- Method
- The T+21 and T+63 Snapshot
- What Works and What Doesn't (Per Market)
- United States: Priced in by announcement day
- Germany: Drift keeps growing
- UK: Strong and growing drift
- Switzerland: Large drift, thin sample
- Canada: Upgrades weak, downgrades reverse
- The Cluster Effect Across Markets
- Why Markets React Differently
- What This Doesn't Tell You
- Takeaway
Data: FMP financial data warehouse, 2012–2025. Updated March 2026.
Method
Data source: Ceta Research (FMP stock_grade table, individual analyst grade changes) Period: 2012–2025 (14 years) Study type: Event study. Each analyst revision is an independent event. Entry: Next-day close after announcement (MOC execution: can't buy at announcement-day close) Benchmarks: Local currency indices: SPY (US), DAX (Germany), FTSE 100 (UK), SMI (Switzerland), TSX Composite (Canada) Windows: T+1, T+5, T+21, T+63 trading days Abnormal return: Stock return minus local benchmark return at each window Market cap filters: Exchange-specific thresholds applied (>$1B USD for US, >€200M for Germany, >£300M for UK, etc.) Deduplication: Duplicate entries from re-fetches removed (keep most recent record per analyst/stock/date) Winsorization: 1st/99th percentile applied before computing statistics
Why these five markets: FMP's stock_grade data is concentrated in Western markets. Asian markets (India, Japan, Korea) have negligible individual analyst grade coverage in this dataset, fewer than 50 events per year for most, compared to 4,000+ per year in the US.
Why local benchmarks: Using ETF proxies (EWG, EWU, etc.) introduces currency conversion and tracking error that distorts the abnormal return calculation. Local currency indices measure what a local investor actually experiences.
The T+21 and T+63 Snapshot
| Exchange | Upgrades | Benchmark | T+1 CAR | T+21 CAR | T+63 CAR |
|---|---|---|---|---|---|
| Germany (XETRA) | 12,835 | DAX | +0.087%** | +0.779%** | +1.633%** |
| UK (LSE) | 9,116 | FTSE 100 | +0.097%** | +0.484%** | +1.093%** |
| Switzerland (SIX) | 2,499 | SMI | +0.122%** | +0.660%** | +1.700%** |
| Canada (TSX) | 2,288 | TSX Comp | +0.047% (ns) | -0.087% (ns) | +0.758%* |
| US (NYSE+NASDAQ+AMEX) | 66,741 | SPY | +0.020%** | -0.175%** | -0.508%** |
** = significant at p<0.01. * = p<0.05. ns = not significant.

The US result is the most striking: average upgrades underperform SPY by -0.18% at one month when entered at next-day close. The announcement-day move captures all the alpha. European markets show the opposite. Drift continues after the announcement.
What Works and What Doesn't (Per Market)
United States: Priced in by announcement day
US upgrades produce no measurable drift after next-day entry. By T+21, all upgrades average -0.18% vs SPY. By T+63, -0.51%.
The cluster effect survives, barely. Clustered upgrades (2+ firms in 30 days) produce +0.27% at T+21 (t=5.0). Single-analyst upgrades produce -0.51% at T+21, actively underperforming the benchmark.
US downgrades are the more durable signal: -0.61% vs SPY at T+63, significant across 69,872 events.
Germany: Drift keeps growing
Germany shows the strongest sustained upgrade drift in the dataset, even measured from next-day entry. Upgrades drift from +0.09% on day one to +0.78% at one month to +1.63% vs DAX at three months. Every window is statistically significant (t>4).
Clustered German upgrades reach +2.17% at T+63.
German downgrades fully reverse: the initial -0.10% at T+1 flips to +0.26% at T+21 and +0.88% at T+63. Downgrades are over-reactions in Germany; upgrades are under-reactions.
UK: Strong and growing drift
UK upgrades produce +0.48% at one month and +1.09% vs FTSE 100 at three months, both significant. The drift grows, not fades. Clustered upgrades reach +1.74% at T+63.
UK downgrades recover rather than persist: after an initial -0.07% at T+1, they reverse to near zero by T+21 and T+63. Like Germany, UK analyst downgrades appear to be over-reactions.
Switzerland: Large drift, thin sample
Switzerland shows +0.66% at T+21 and +1.70% vs SMI at T+63, both significant and comparable to Germany in magnitude. Sample size is small (2,499 upgrades), but the t-statistics are robust (t=4.2 at T+21, t=5.7 at T+63).
Swiss downgrades are meaningful at short windows: -0.24% at T+1, -0.34% at T+5, -0.45% at T+21. By T+63 they fade to insignificance.
Canada: Upgrades weak, downgrades reverse
Canada shows no significant upgrade drift through T+21. Only T+63 shows marginal significance (+0.76%, t=2.2). The cluster effect shows +1.43% at T+63, but this is based on n=794 clustered events and only one significant window.
Canadian downgrades show a striking reversal: the initial -0.01% at T+1 grows to +0.58% at T+21 and +1.67% vs TSX Composite at T+63 (t=4.1). Downgraded Canadian stocks outperform the index significantly three months later.
The Cluster Effect Across Markets
| Exchange | Clustered T+21 | Single T+21 | Ratio |
|---|---|---|---|
| Germany | +1.166% | +0.376% | 3.1x |
| UK | +1.050% | +0.100% (ns) | — |
| US | +0.273% | -0.510% | — (inverted) |
| Switzerland | +0.472% | +0.818% | — (reversed) |
| Canada | -0.198% (ns) | -0.023% (ns) | — (both ns) |
The cluster premium is clear in Germany and UK. In the US, single upgrades don't just underperform clustered upgrades. They underperform the benchmark outright. In Switzerland, single upgrades outperform clustered ones, possibly because the Swiss analyst community is so concentrated that even a single upgrade from a major bank carries substantial information.
Why Markets React Differently
Three factors likely explain the cross-market variation:
Analyst coverage density. The US has the deepest coverage. Major stocks have 20+ analysts. New information from one firm is incremental and prices in fast. Germany and UK have far less coverage per stock; an upgrade can be genuinely novel information to many market participants.
Investor type. US institutional investors are faster to act on analyst information. European retail investors, particularly in Germany, tend to be slower. The US is the most efficient market in this sample. Upgrades get priced in on announcement day.
Market liquidity. Price adjustment happens faster in liquid markets. XETRA stocks outside the DAX trade less frequently; information takes longer to diffuse into price.
What This Doesn't Tell You
This is an event study, not a trading strategy. Abnormal returns are measured from next-day-close entry, but even that may not be achievable. Transaction costs, bid-ask spreads, and market impact reduce realized returns further.
The 14-year period covers one long bull market cycle with two major disruptions (COVID 2020, rate shock 2022). The pattern may behave differently in sustained bear markets or high-volatility regimes.
European markets show less data before 2018 in FMP's stock_grade table. Results are weighted toward 2018-2025 for Germany and UK.
Takeaway
Every market in this study reacts to analyst upgrades on announcement day. The question is whether the reaction continues afterward.
In the US, it doesn't, and average upgrades actually underperform after next-day entry. In Germany and the UK, drift continues for three months. The US is the most informationally efficient in this sample.
The cluster effect separates signal from noise in most markets: multiple firms upgrading within 30 days produces real drift even after the announcement-day move. Single upgrades in the US are actively negative signals after day one.
European downgrades behave differently from the US: they recover. US downgrades persist: the only market where downgraded stocks keep falling for three months.
Data: FMP warehouse via Ceta Research, 2012–2025. Individual analyst grade changes (stock_grade table). Five exchanges: NYSE+NASDAQ+AMEX, XETRA, LSE, SIX, TSX. Local currency benchmarks.
Backtest code on GitHub.
Past performance does not guarantee future results. This is educational content, not investment advice.


