
Do Analyst Upgrades Actually Move Stock Prices? We Measured 66,741 of Them
We ran an event study on 66,741 analyst upgrades on US stocks from 2012 to 2025. The upgrade move happens on announcement day. You can't capture it. By the next close, average upgrades produce -0.18% at one month. Clustered upgrades (2+ firms in 30 days) still drift +0.27% at T+21. Single...

We ran an event study on 14 years of individual analyst rating changes on US stocks. Upgrades move stocks, but almost entirely on the announcement day. If you enter the next day at close, the aggregate upgrade signal turns negative by one month. The story is in the breakdown: clustered upgrades still drift, single upgrades actively underperform, and downgrades keep falling for three months.
Contents
- Method
- What We Found
- The upgrade move is priced in on announcement day
- Clustered upgrades: the only thing that still works
- Large-magnitude upgrades: negligible effect
- Downgrades: persistent but modest
- The asymmetry
- The Data
- Limitations
- The SQL
- Takeaway
Data: FMP financial data warehouse, 2012–2025. Updated March 2026.
Method
Data source: Ceta Research (FMP stock_grade table, individual analyst grade changes) Universe: NYSE, NASDAQ, AMEX (market cap above $1B USD) Period: 2012–2025 (14 years, 136,613 events) Study type: Event study. Each event is measured independently. Not a portfolio backtest. Benchmark: SPY (S&P 500 ETF) Windows: T+1, T+5, T+21, T+63 trading days after the event Entry: Next-day close after the announcement (MOC execution: can't buy at announcement-day close) Abnormal return: Stock return minus SPY return at each window Deduplication: If the same analyst firm revises the same stock on the same date multiple times (data fetch artifact), only the most recent record is kept. Winsorization: 1st/99th percentile applied before computing statistics to reduce outlier impact.
Each analyst upgrade or downgrade is treated as a separate event. We don't aggregate to consensus. We measure each firm's individual revision.
What counts as an upgrade: The action column in FMP's stock_grade table is 'upgrade'. This captures grade changes like Hold→Buy, Sell→Buy, Neutral→Overweight.
Cluster detection: An upgrade is classified as "clustered" when two or more distinct analyst firms upgrade the same stock within 30 calendar days of each other. Single means no other firms upgraded within that window.
Magnitude classification: - Small (+2): Hold→Buy type moves (the most common) - Large (+4): Sell→Buy type moves (rare, stronger prior conviction change)
What We Found
The upgrade move is priced in on announcement day
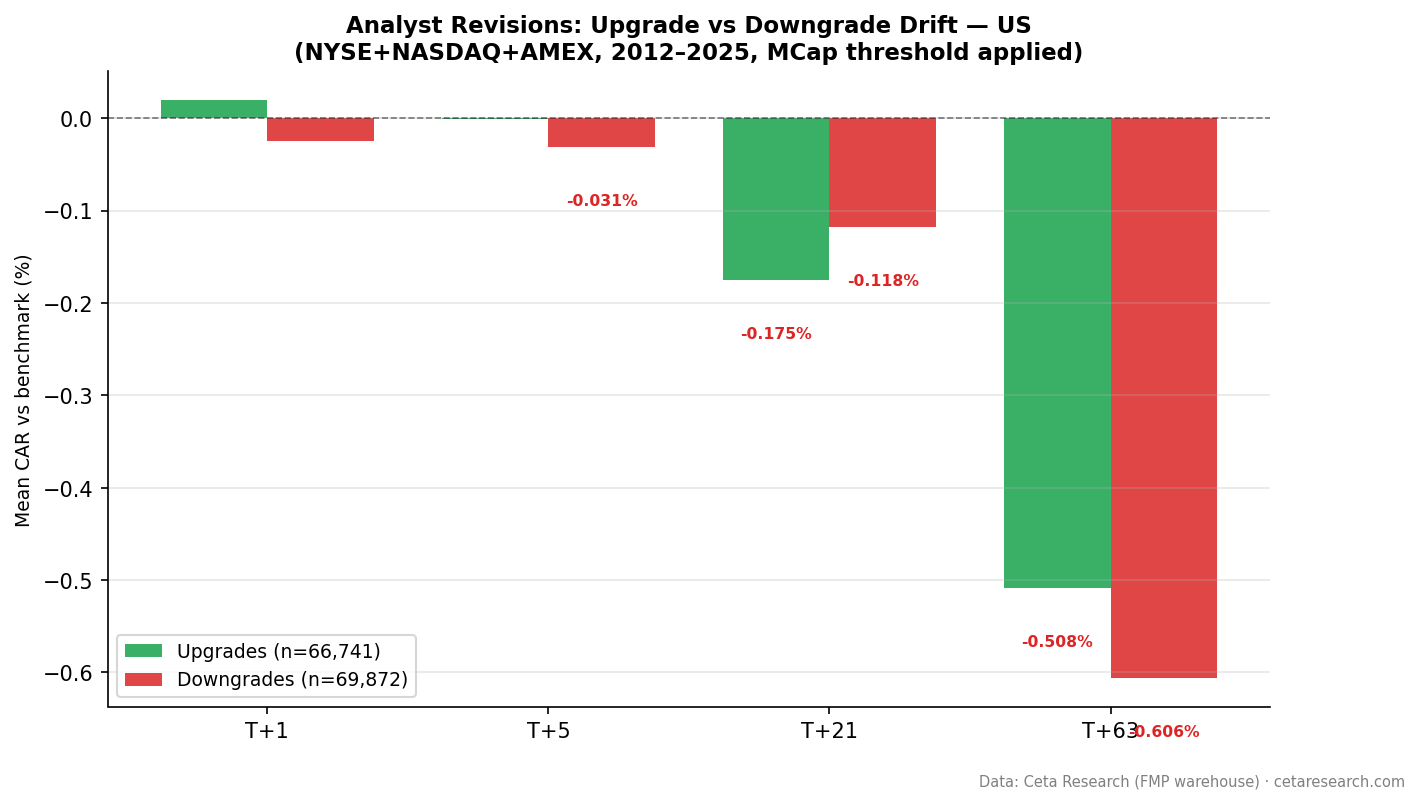
The average analyst upgrade on a US stock does nothing measurable by the next day's close. By one month, all upgrades are underperforming SPY by -0.18%. By three months, -0.51%.
| Window | Upgrade CAR | t-stat | n |
|---|---|---|---|
| T+1 | +0.020% | 2.4 | 66,741 |
| T+5 | 0.000% | -0.04 | 66,741 |
| T+21 | -0.175% | -5.0 | 66,741 |
| T+63 | -0.508% | -8.1 | 66,741 |
Winsorized mean, next-day-close entry.
The stock moves when the upgrade comes out. By the time you can act on it, the move is gone, and on average the upgraded stock underperforms the benchmark for the following three months.
This doesn't mean upgrades contain no information. It means the information gets priced in immediately.
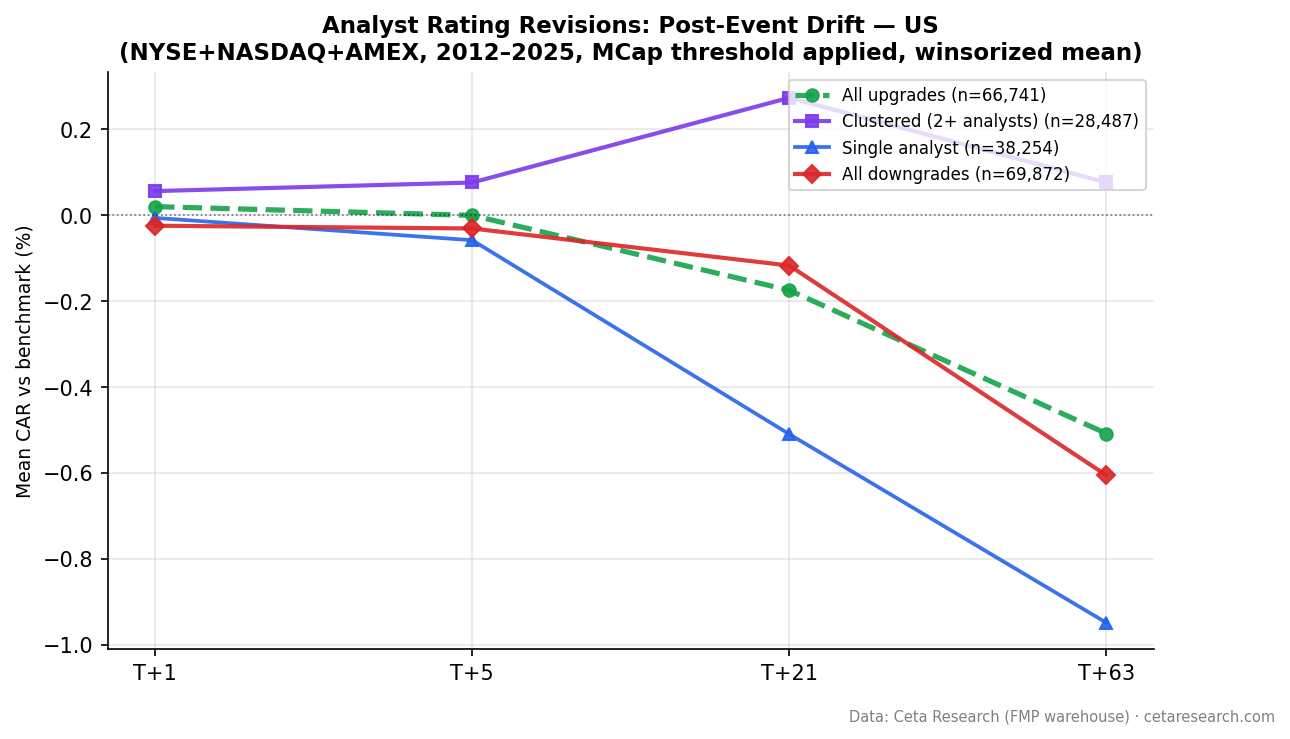
Clustered upgrades: the only thing that still works
When two or more independent analyst firms upgrade the same stock within 30 days, the signal is different. Clustered upgrades still show positive drift even after the announcement-day move.
| Category | T+1 | T+5 | T+21 | T+63 |
|---|---|---|---|---|
| Clustered (n=28,487) | +0.056% | +0.076% | +0.273% | +0.076% |
| Single (n=38,254) | -0.007% | -0.059% | -0.510% | -0.949% |
Clustered upgrades produce +0.27% at T+21 (t=5.0, significant). Single-analyst upgrades produce -0.51% at T+21 (t=-11.3, strongly negative). The gap is 0.78 percentage points.
Single-analyst upgrades don't just fail to add value: they actively underperform the benchmark by month three. The interpretation: when one analyst upgrades a stock, it's likely already reflected in price or the upgrade is weaker information. When multiple independent firms upgrade within 30 days, something else is happening: either a coordinated information signal or genuine fundamental improvement that takes time to reach price.
Large-magnitude upgrades: negligible effect
Large-magnitude upgrades (Sell→Buy, grade change of +4) show some drift at T+21 but nothing reliable:
| Category | n | T+1 CAR | T+21 CAR | T+63 CAR |
|---|---|---|---|---|
| Large (+4, Sell→Buy) | 1,380 | +0.063% | +0.574% | -0.625% |
| Small (+2, Hold→Buy) | 65,361 | +0.019% | -0.190% | -0.506% |
The T+21 result for large upgrades (t=2.2) is barely significant and not reliable given the small sample (1,380 events). By T+63, large upgrades are also negative.
Downgrades: persistent but modest
Downgrades still underperform after the announcement day, but the effect is smaller than same-day-entry studies suggest.
| Window | Downgrade CAR | t-stat |
|---|---|---|
| T+1 | -0.025% | -2.8 |
| T+5 | -0.031% | -1.6 |
| T+21 | -0.118% | -3.1 |
| T+63 | -0.606% | -9.0 |
n=69,872 downgrades. All significant at T+1 and T+21+. At three months, downgraded stocks underperform SPY by -0.61% on average. The effect is real and statistically robust, but substantially smaller than the -1.48% figure that same-day-entry studies show.
Downgrades carry information that takes months to reach price. The underperformance compounds: stocks that get downgraded continue to lag for the following quarter. Whether this reflects genuine fundamental deterioration or a slow information diffusion process, the pattern holds across 14 years and 69,872 events.
The asymmetry
Clustered upgrades drift up. Single upgrades drift down. Downgrades drift down. The US equity market is efficient enough to price most upgrade information on announcement day, but the divergence between clustered and single upgrades persists afterward.
The Data

Limitations
Same-day execution is assumed to be impossible. Results use next-day-close entry. In practice, retail investors still can't capture announcement-day moves; the actual gap between announcement-day price and next-day open is where much of the return lives.
Market cap filter. We excluded stocks below $1B market cap. Smaller stocks may show different patterns.
Survivorship bias is limited. The event study measures returns from the event date forward. Stocks delisted after the event create a negative tail in long-window returns, so T+63 figures may be slightly optimistic (for upgrades) and slightly pessimistic (for downgrades).
2012–2025 only. FMP's stock_grade coverage before 2012 is sparse. Results cover one extended bull market, one COVID crash-and-recovery, and a period of rapid rate change. A longer history would test robustness across more regimes.
Cluster window is fixed at 30 days. Different windows may produce different results. 30 days is the baseline used across all five markets in this study.
The SQL
The current upgrade cluster screen for US stocks:
WITH deduped AS (
    SELECT
        symbol, CAST(date AS DATE) AS revision_date, gradingCompany,
        previousGrade, newGrade,
        ROW_NUMBER() OVER (
            PARTITION BY symbol, CAST(date AS DATE), gradingCompany
            ORDER BY dateEpoch DESC
        ) AS rn
    FROM stock_grade
    WHERE CAST(date AS DATE) >= CURRENT_DATE - INTERVAL '30' DAY
      AND action = 'upgrade'
      AND symbol IN (SELECT DISTINCT symbol FROM profile WHERE exchange IN ('NYSE', 'NASDAQ', 'AMEX'))
),
upgrades AS (
    SELECT symbol, revision_date, gradingCompany, previousGrade, newGrade
    FROM deduped WHERE rn = 1
),
clusters AS (
    SELECT
        symbol,
        COUNT(DISTINCT gradingCompany) AS distinct_analysts,
        MIN(revision_date) AS first_upgrade,
        MAX(revision_date) AS last_upgrade,
        STRING_AGG(DISTINCT gradingCompany, ', ' ORDER BY gradingCompany) AS analyst_firms,
        STRING_AGG(DISTINCT newGrade, ', ' ORDER BY newGrade) AS new_grades
    FROM upgrades
    GROUP BY symbol
    HAVING COUNT(DISTINCT gradingCompany) >= 2
)
SELECT clusters.*, mc.marketCap / 1e9 AS mktcap_b
FROM clusters
LEFT JOIN (
    SELECT symbol, marketCap, ROW_NUMBER() OVER (PARTITION BY symbol ORDER BY dateEpoch DESC) AS rn
    FROM key_metrics WHERE period = 'FY' AND marketCap IS NOT NULL
) mc ON clusters.symbol = mc.symbol AND mc.rn = 1
WHERE mc.marketCap > 1e9
ORDER BY distinct_analysts DESC, last_upgrade DESC
LIMIT 50
Takeaway
Analyst upgrades on US stocks move prices immediately, but that move happens on announcement day, not after. If you enter the day after the upgrade at close, the average stock underperforms SPY by -0.18% at one month and -0.51% at three months.
The exception is clustered upgrades: when two or more independent firms upgrade within 30 days. Those still produce +0.27% above SPY at one month (t=5.0). Single-analyst upgrades don't just fail to add value: they underperform by -0.51% at one month and -0.95% at three months.
Downgrades carry more durable information: -0.61% below SPY at three months, persistent and significant across 69,872 events.
The practical takeaway: a single analyst upgrade tells you the price moved yesterday. Multiple upgrades from different firms within 30 days tell you something the market hasn't fully absorbed.
Data: FMP warehouse via Ceta Research, 2012–2025. Event study using individual analyst grade changes (stock_grade table). Entry: next-day close after announcement.
Can you replicate these results? Every number in this post is derived from FMP's stock_grade table. The cluster screen SQL above reproduces the current signal. The backtest code is available on GitHub.
Past performance does not guarantee future results. This is educational content, not investment advice.


