
Analyst Upgrades on UK Stocks: +1.09% vs FTSE 100 at 3 Months (9,116 Events)
We measured 9,116 analyst upgrades on LSE-listed UK stocks from 2012 to 2025. Upgrades produce sustained drift through three months: +0.48% at one month and +1.09% vs FTSE 100 at three months. Clustered upgrades reach +1.74% at T+63. UK downgrades recover rather than persist, opposite to the US...


We measured 9,116 individual analyst upgrades on LSE-listed UK stocks from 2012 to 2025. Upgrades produce sustained drift through three months: +0.48% at one month and +1.09% vs FTSE 100 at three months. Clustered upgrades (2+ firms in 30 days) reach +1.74% at T+63. Unlike the US, where downgraded stocks keep falling, UK downgrades recover within months.
Contents
- Method
- What We Found
- Sustained drift through three months
- Cluster effect: 4x the drift at T+21
- Downgrades recover, not like the US
- The Data
- Limitations
- Takeaway
Data: FMP financial data warehouse, 2012–2025. Updated March 2026.
Method
Data source: Ceta Research (FMP stock_grade table, individual analyst grade changes) Universe: LSE (London Stock Exchange, market cap above £300M GBP) Period: 2012–2025 (14 years, 17,869 events including downgrades) Study type: Event study. Each event measured independently. Benchmark: FTSE 100 (^FTSE, UK large-cap index, local currency GBP) Windows: T+1, T+5, T+21, T+63 trading days after the event Entry: Next-day close after announcement (MOC execution) Abnormal return: Stock return minus FTSE 100 return at each window
What We Found
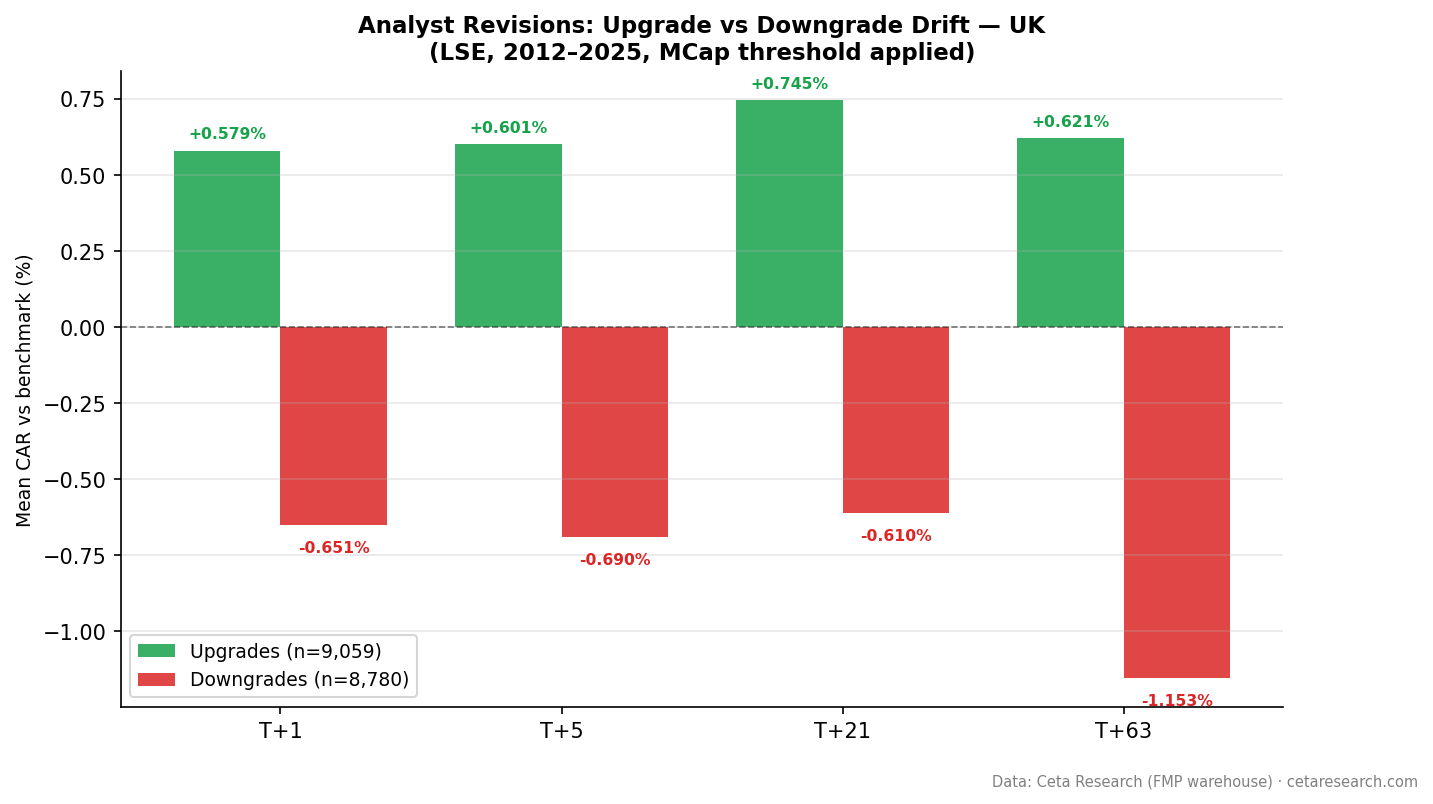
Sustained drift through three months
| Window | Upgrade CAR | t-stat | Downgrade CAR | t-stat |
|---|---|---|---|---|
| T+1 | +0.097% | 4.1 | -0.071% | -2.6 |
| T+5 | +0.096% | 1.9 | -0.007% | -0.1 (ns) |
| T+21 | +0.484% | 4.7 | +0.160% | 1.4 (ns) |
| T+63 | +1.093% | 5.8 | +0.116% | 0.6 (ns) |
n=9,116 upgrades, n=8,753 downgrades. Winsorized mean, next-day-close entry.
The UK profile is different from the US. US upgrades produce no measurable drift after next-day entry. UK upgrades produce real, growing drift, rising from +0.10% on day one to +1.09% vs FTSE 100 at three months. All windows from T+1 onward are statistically significant.
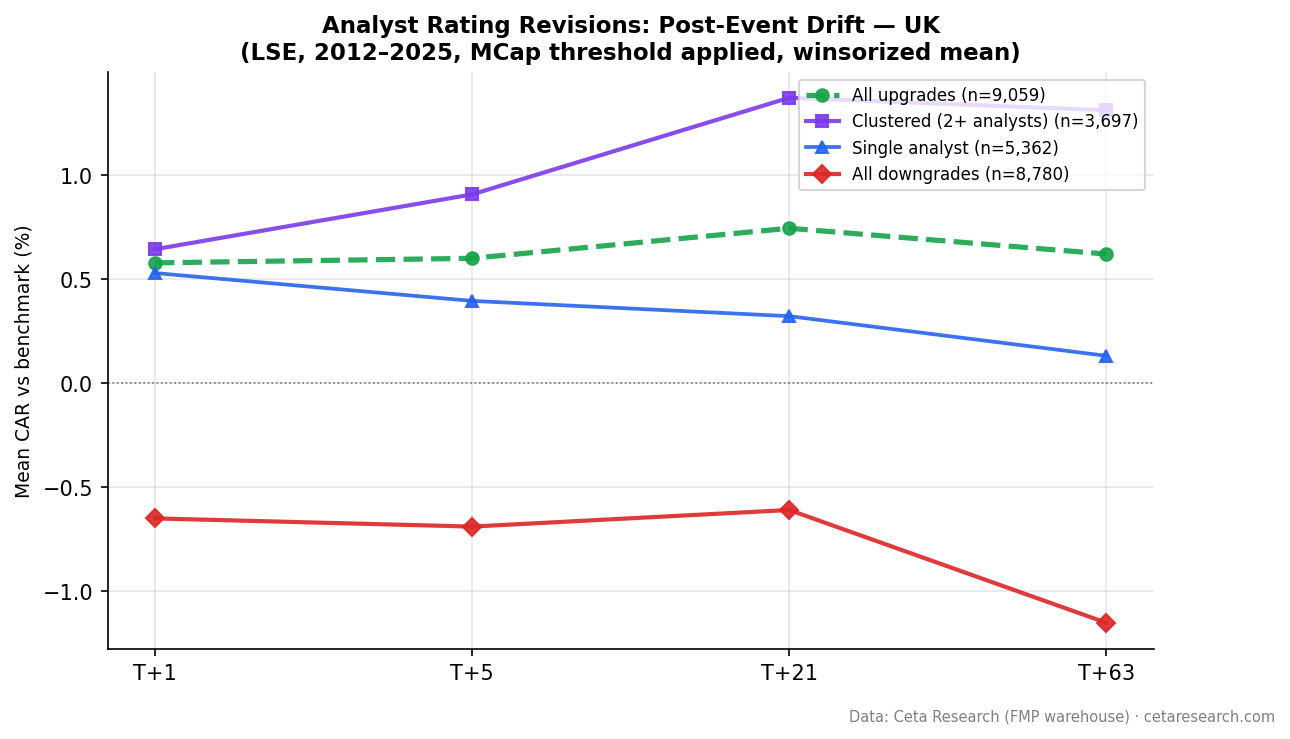
Cluster effect: 4x the drift at T+21
| Category | n | T+1 | T+21 | T+63 |
|---|---|---|---|---|
| Clustered (2+ analysts) | 3,719 | +0.126% | +1.050% | +1.742% |
| Single analyst | 5,397 | +0.066% | +0.100% (ns) | +0.643% |
Clustered upgrades produce +1.05% at T+21 (t=6.3, highly significant) and +1.74% at T+63 (t=5.7). Single-analyst upgrades are not significant at T+21, though single upgrades do drift to +0.64% at T+63.
The cluster split is practically useful: multiple independent firms upgrading the same LSE stock within 30 days produces 10x the one-month drift of single-analyst events. Single upgrades on LSE show short-term moves that fade before becoming significant.
Downgrades recover, not like the US
UK downgrades are different from US downgrades. In the US, downgraded stocks keep falling for three months (-0.61% at T+63). In the UK, the initial drop (-0.07% at T+1) fades immediately. By T+21, downgraded UK stocks have reversed to +0.16% vs FTSE 100 (not significant). By T+63, +0.12% (not significant).
UK downgrades look more like Germany than the US: initial negative reaction, then recovery. This suggests UK analyst downgrades tend to be over-reactions, or that negative sentiment gets absorbed quickly in the FTSE-tracked universe.
The Data
Limitations
FTSE 100 as benchmark. The FTSE 100 holds 100 large-cap UK stocks. Mid-cap LSE companies may have different market exposure. Some excess return could reflect residual size factor exposure rather than pure analyst revision effect.
Data concentration. FMP's stock_grade data for LSE is concentrated from 2018 onward. Very few events before 2018 (under 200 per year). The bulk of the sample is 2018-2025. This limits the regime diversity of the sample.
Event timing. UK analyst reports are often released pre-market. T+1 returns capture the first full trading day after revision, but some of the return may already be in the price within hours of release.
Coverage concentration. FMP's stock_grade data for LSE is concentrated in large- and mid-cap stocks. Very small LSE companies are under-represented, which means results apply primarily to the institutionally covered universe.
Takeaway
UK analyst upgrades produce real, sustained price impact vs the FTSE 100. The average upgrade runs +0.10% above the index on day one and +1.09% at three months, with the signal growing through the full 63-day window.
The cluster effect is the actionable split: multiple independent firms upgrading within 30 days produces +1.05% at one month vs +0.10% (not significant) for single-analyst upgrades. Clustered upgrades sustain to +1.74% at three months.
UK downgrades don't behave like US downgrades: they recover rather than persist. The market over-reacts to negative analyst revisions in the UK.
Data: FMP warehouse via Ceta Research, 2012–2025. LSE stocks, market cap >£300M. Benchmark: FTSE 100 (^FTSE). Entry: next-day close after announcement.
Backtest code on GitHub. Live screen: python3 analyst-revision/screen.py --preset uk
Past performance does not guarantee future results. This is educational content, not investment advice.


