
Asset Growth Anomaly on Swedish Stocks: 6.33% CAGR, +3.78% vs OMX Stockholm 30
The asset growth anomaly on Nasdaq Stockholm returned 6.33% annually vs 2.55% for the OMX Stockholm 30 from 2000-2025. A +3.78% annual edge, 60% win rate, -35.69% max drawdown vs -60.54% for OMX. Seven cash years protected capital during the OMX's brutal early crashes.

Asset Growth Anomaly on Swedish Stocks: 6.33% CAGR, Beating OMX Stockholm 30 by +3.78%
Sweden punches above its weight in equity markets. A population of 10 million, but a stock exchange loaded with globally competitive companies across industrials, tech, healthcare, and consumer goods. We ran the same asset growth anomaly screen that works in the US on Nasdaq Stockholm. The result: 6.33% CAGR over 25 years vs 2.55% for the OMX Stockholm 30. That +3.78% annual excess means the screen beats its local benchmark, and by a wide margin on risk: the portfolio's max drawdown was -35.69% vs -60.54% for the OMX.
Contents
- Method
- Results
- When It Works
- When It Fails
- Annual Returns vs OMX Stockholm 30
- Limitations
- Run It Yourself
- Current Screen (SQL)
- Backtest
- Takeaway
- Part of a Series
- References
Data: FMP financial data warehouse, 2000–2025. Updated March 2026.
Method
Data source: Ceta Research (FMP financial data warehouse) Universe: STO (Nasdaq Stockholm), market cap > SEK 2.5B (~$230M USD) Period: 2000-2025 (25 annual rebalance periods) Rebalancing: Annual (July), equal weight top 30 by lowest asset growth Benchmark: OMX Stockholm 30 (^OMXS30) Cash rule: Hold cash if fewer than 10 stocks qualify Transaction costs: Size-tiered model (0.1% mega-cap, 0.3% large-cap, 0.5% mid-cap) Data quality guards: Entry price > $1, single-period return capped at 200%
Signal filters:
| Criterion | Metric | Threshold |
|---|---|---|
| Capital discipline | Asset Growth (YoY) | -20% to +10% |
| Profitability | Return on Equity | > 8% |
| Asset efficiency | Return on Assets | > 5% |
| Pricing power | Operating Margin | > 10% |
| Size | Market Cap | > SEK 2.5B (~$230M USD) |
Historical financial data with 45-day lag to prevent look-ahead bias. Full methodology: backtests/METHODOLOGY.md.
For the full screen logic and research background, see the main US Asset Growth post.
Results
| Metric | Portfolio | OMX Stockholm 30 |
|---|---|---|
| CAGR | 6.33% | 2.55% |
| Total Return | 363.86% | 87.63% |
| Max Drawdown | -35.69% | -60.54% |
| Volatility | 16.63% | -- |
| Sharpe Ratio | 0.260 | -- |
| Sortino Ratio | 0.532 | -- |
| Win Rate (vs OMX) | 60% | -- |
| Beta | 0.510 | 1.00 |
| Alpha | 4.05% | -- |
| Up Capture | 83.9% | -- |
| Down Capture | 28.02% | -- |
| Cash Periods | 7/25 | -- |
| Avg Stocks | 22.6 | -- |
| $10,000 grew to | $46,386 | $18,763 |
The headline numbers are clear. The portfolio compounded at 6.33% annually while the OMX Stockholm 30 managed just 2.55% over the same 25 years. A $10,000 investment grew to $46,386 in the portfolio vs $18,763 in the index.
The risk picture is more striking than the return. The OMX Stockholm 30 suffered a -60.54% max drawdown over this period, one of the worst among developed-market indices. The portfolio's -35.69% max drawdown is dramatically shallower. The down capture of 28.02% explains this: when the OMX fell, the portfolio absorbed about 28% as much of those losses. The beta of 0.510 confirms the portfolio runs at roughly half the market's sensitivity. Alpha at 4.05% means the outperformance is genuine, not just a volatility artifact.
The qualifying pool averaged 22.6 stocks per period. Seven of 25 years were cash years when the pool fell below 10 qualifying stocks. Those cash years weren't a drag; they were often protection.
When It Works
The cash years (2000-2004, 2006, 2009): staying out of a brutal market.
The OMX Stockholm 30 lost more than 70% of its value from peak to trough during the early 2000s tech crash and surrounding period. In each year from 2000 through 2004, the portfolio held cash as the qualifying pool thinned out. The OMX fell 33.22%, 33.50%, and 11.15% in 2000, 2001, and 2002 respectively, while the portfolio earned 0% in cash. The same happened in 2006 (OMX +30.51%, portfolio in cash, net miss of +30.51%) and 2009 (OMX +24.08%, portfolio in cash). The cash mechanism worked as intended: thin qualifying pools often coincide with deteriorating fundamentals. The portfolio wasn't invested in 2003 or 2004 when the OMX recovered, which cost return, but the protection in the down years more than compensated over the full cycle.
2016 (+14.30% excess): Swedish capital-disciplined companies led the recovery after European markets stabilized post-Brexit shock.
| Year | Portfolio | OMX Stockholm 30 | Excess |
|---|---|---|---|
| 2016 | +37.1% | +22.8% | +14.3 |
2015 (+20.84% excess): The OMX dropped 15.14% while the portfolio gained 5.70%. Quality-filtered companies held up during the China slowdown and commodity-driven stress on European cyclicals.
| Year | Portfolio | OMX Stockholm 30 | Excess |
|---|---|---|---|
| 2015 | +5.7% | -15.1% | +20.8 |
2017 (+15.55% excess): The OMX fell 5.32% in 2017, an unusual year for a global bull market. The portfolio gained 10.23%.
| Year | Portfolio | OMX Stockholm 30 | Excess |
|---|---|---|---|
| 2017 | +10.2% | -5.3% | +15.5 |
2010 (+12.87% excess) and 2013 (+8.04% excess): Post-crisis recoveries where the portfolio's quality tilt added meaningful margin over the market.
When It Fails
2007 (worst relative year in context): The financial crisis hit Swedish banks and financials early. The portfolio dropped 28.38% while the OMX fell 32.28%, a +3.90% excess. In absolute terms this was brutal, but the portfolio held up better than the market.
2008 (-3.49% excess): The only year where the portfolio materially underperformed the OMX. The screen's quality filters didn't protect against a banking-sector-led downturn in a market where financials dominate the qualifying universe.
| Year | Portfolio | OMX Stockholm 30 | Excess |
|---|---|---|---|
| 2007 | -28.4% | -32.3% | +3.9 |
| 2008 | -10.2% | -6.7% | -3.5 |
2003-2004 (cash during recovery): The OMX recovered 31.32% and 19.62% in these years. The portfolio held cash both years, a combined miss of roughly 55 percentage points of market gain. This is the structural cost of the cash rule: it avoids drawdowns but also misses sharp recoveries when fundamentals haven't yet improved.
2006 (cash during strong year): OMX gained 30.51% while the portfolio sat in cash. The cash rule kept the portfolio out during another strong market year, contributing to the -30.51% relative drag that year.
Annual Returns vs OMX Stockholm 30
| Year | Portfolio | OMX Stockholm 30 | Excess |
|---|---|---|---|
| 2000 | 0% (cash) | -33.22% | +33.22 |
| 2001 | 0% (cash) | -33.50% | +33.50 |
| 2002 | 0% (cash) | -11.15% | +11.15 |
| 2003 | 0% (cash) | +31.32% | -31.32 |
| 2004 | 0% (cash) | +19.62% | -19.62 |
| 2005 | +14.76% | +15.49% | -0.72 |
| 2006 | 0% (cash) | +30.51% | -30.51 |
| 2007 | -28.38% | -32.28% | +3.90 |
| 2008 | -10.21% | -6.72% | -3.49 |
| 2009 | 0% (cash) | +24.08% | -24.08 |
| 2010 | +27.37% | +14.50% | +12.87 |
| 2011 | -9.27% | -8.98% | -0.29 |
| 2012 | +16.13% | +13.32% | +2.80 |
| 2013 | +27.56% | +19.52% | +8.04 |
| 2014 | +15.99% | +12.53% | +3.46 |
| 2015 | +5.70% | -15.14% | +20.84 |
| 2016 | +37.08% | +22.77% | +14.30 |
| 2017 | +10.23% | -5.32% | +15.55 |
| 2018 | +11.38% | +6.89% | +4.49 |
| 2019 | +0.33% | +3.45% | -3.12 |
| 2020 | +45.03% | +34.34% | +10.68 |
| 2021 | -18.69% | -17.27% | -1.42 |
| 2022 | +19.39% | +21.18% | -1.79 |
| 2023 | +20.62% | +11.31% | +9.31 |
| 2024 | +4.44% | -1.24% | +5.68 |
Win rate: 60% (15 of 25 years outperformed the OMX, counting cash years as wins when OMX was negative).
Limitations
Down capture still nonzero. At 28.02%, the portfolio absorbs roughly a quarter of the market's losses during declines. That's much better than most exchanges on this screen, but the portfolio isn't fully defensive. The 2007-2008 period shows this: severe losses in absolute terms, even if shallower than the market.
Cash years cut both ways. The seven cash years protected capital during the early-2000s crash and again in 2009. But 2003, 2004, 2006, and 2009 were also strong recovery years. The cash rule is protective in bear markets and costly in recoveries. Whether that tradeoff is worth it depends on your entry point.
Smaller qualifying universe. With the local-currency market cap threshold, the qualifying pool is thinner than with a flat $500M USD cutoff. The SEK 2.5B floor (~$230M USD) is consistent with other exchanges in the series, but Sweden's mid-cap layer is narrower than the US or UK.
SEK/USD currency effects. Returns are computed in SEK. The Swedish Krona weakened from roughly 9.5 to 10.9 SEK per USD over this period, with significant swings along the way. For a USD-based investor, currency movements add noise. The +3.78% excess return vs the OMX is a SEK-denominated comparison, so both sides face the same currency.
Export sensitivity. About 70% of Swedish large-cap revenue comes from outside Sweden. The screen selects based on balance sheet and profitability metrics, not revenue geography. These companies' fortunes track global trade flows more than domestic conditions.
Run It Yourself
Run this screen live on Ceta Research
Current Screen (SQL)
WITH bs_current AS (
    SELECT symbol, totalAssets,
        ROW_NUMBER() OVER (PARTITION BY symbol ORDER BY dateEpoch DESC) AS rn
    FROM balance_sheet
    WHERE period = 'FY' AND totalAssets > 0
),
bs_prior AS (
    SELECT symbol, totalAssets AS prior_assets,
        ROW_NUMBER() OVER (PARTITION BY symbol ORDER BY dateEpoch DESC) AS rn
    FROM balance_sheet
    WHERE period = 'FY' AND totalAssets > 0
),
growth AS (
    SELECT bc.symbol,
        (bc.totalAssets - bp.prior_assets) / bp.prior_assets AS asset_growth
    FROM bs_current bc
    JOIN bs_prior bp ON bc.symbol = bp.symbol AND bp.rn = 2
    WHERE bc.rn = 1 AND bp.prior_assets > 0
)
SELECT g.symbol, p.companyName,
    ROUND(g.asset_growth * 100, 2) AS asset_growth_pct,
    ROUND(k.returnOnEquityTTM * 100, 2) AS roe_pct,
    ROUND(k.returnOnAssetsTTM * 100, 2) AS roa_pct,
    ROUND(f.operatingProfitMarginTTM * 100, 2) AS opm_pct,
    ROUND(k.marketCap / 1e9, 2) AS mktcap_bn
FROM growth g
JOIN profile p ON g.symbol = p.symbol
JOIN key_metrics_ttm k ON g.symbol = k.symbol
JOIN financial_ratios_ttm f ON g.symbol = f.symbol
WHERE g.asset_growth < 0.10
  AND g.asset_growth > -0.20
  AND k.returnOnEquityTTM > 0.08
  AND k.returnOnAssetsTTM > 0.05
  AND f.operatingProfitMarginTTM > 0.10
  AND k.marketCap > 2500000000
  AND p.exchange = 'STO'
ORDER BY g.asset_growth ASC
LIMIT 30
Backtest
# Clone the repo
git clone https://github.com/ceta-research/backtests.git
cd backtests

# Run Sweden backtest
python3 asset-growth/backtest.py --preset sweden --output results.json --verbose

# Run all exchanges
python3 asset-growth/backtest.py --global --output results/exchange_comparison.json
Takeaway
The asset growth anomaly on Nasdaq Stockholm generates +3.78% annual excess over the OMX Stockholm 30, with an alpha of 4.05% and a beta of 0.510. A $10,000 investment grew to $46,386 vs $18,763 for the index. The portfolio's -35.69% max drawdown is dramatically shallower than the OMX's -60.54%.
The OMX Stockholm 30 has had a rough 25 years: 2.55% CAGR with two catastrophic bear markets. Against that baseline, the capital-discipline screen adds real value. The down capture of 28.02% is the key mechanism: the screen keeps the portfolio out of the companies that destroy capital during downturns, and that's exactly the environment where the OMX has suffered most.
The seven cash years are a mixed story. In the early-2000s crash, cash was protection. In the 2003-2004 recovery and again in 2006, cash was a drag. The cash rule doesn't know which environment is coming; it just responds to the qualifying pool. Over the full 25-year cycle, it helped.
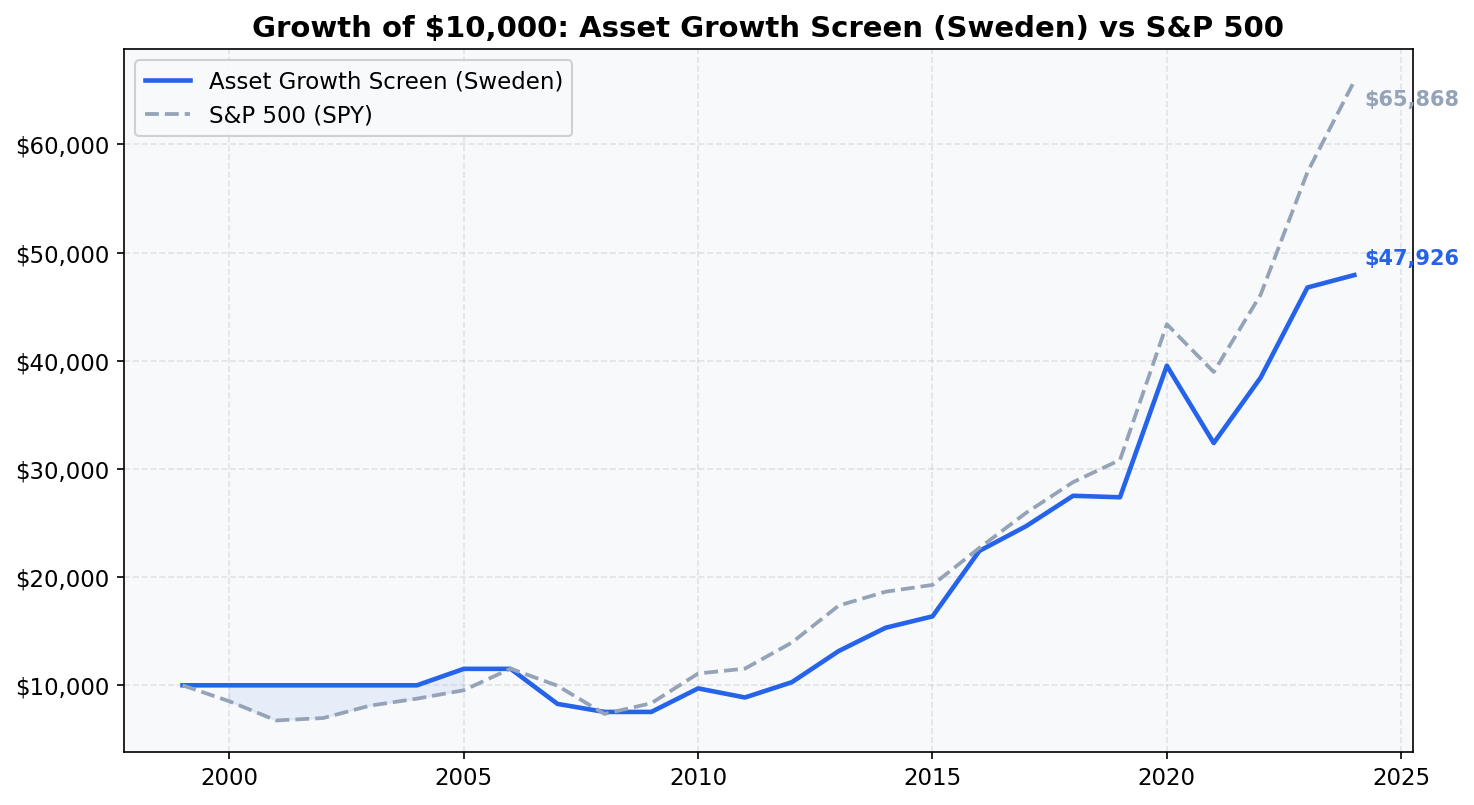
Sweden belongs in the "beats local benchmark with lower drawdown" tier alongside the UK and Canada. The absolute CAGR (6.33%) is lower than the US result (12.78%), but the comparison to the right benchmark tells a different story than the one the S&P 500 comparison told.
Part of a Series
This analysis is part of our asset growth anomaly global exchange comparison: - Asset Growth on US Stocks (NYSE + NASDAQ + AMEX), 12.78% CAGR, the baseline - Asset Growth on UK Stocks (LSE), 10.94% CAGR, +9.71% over FTSE 100 - Asset Growth: 16-Exchange Global Comparison, full comparison table
Data: Ceta Research (FMP financial data warehouse), 2000-2025. Universe: STO (Nasdaq Stockholm). Annual rebalance (July), equal weight, top 30 by lowest asset growth. Benchmark: OMX Stockholm 30 (^OMXS30). Returns in SEK unless noted. Full methodology: METHODOLOGY.md. Past performance does not guarantee future results. This is educational content, not investment advice.
References
- Cooper, M., Gulen, H. & Schill, M. (2008). "Asset Growth and the Cross-Section of Stock Returns." Journal of Finance, 63(4), 1609-1651.
- Watanabe, A., Xu, Y., Yao, T. & Yu, T. (2013). "The Asset Growth Effect: Insights from International Equity Markets." Journal of Financial Economics, 108(2), 529-563.


