
Asset Growth Anomaly on Swiss Stocks: 6.57% CAGR, +4.83% vs SMI on SIX
The asset growth anomaly on SIX-listed Swiss stocks returned 6.57% annually vs 1.74% for the SMI from 2000 to 2025. A +4.83% annual edge, 72% win rate, 123% up capture, 32% down capture. The SMI barely compounded. The screen found the Swiss companies that did.

Switzerland's stock market has returned just 1.74% annually since 2000. That's not a typo. The SMI, one of the world's most recognized blue-chip indexes, compounded at less than 2% per year over a quarter century. We backtested the asset growth anomaly with quality filters on SIX from 2000 to 2025. The portfolio returned 6.57% annually vs 1.74% for the SMI. A +4.83% annual edge. Down capture was 32.27%, the lowest of any European exchange we tested. The screen beat the SMI in 18 of 25 years. Switzerland already selects for quality. This screen compounds on that advantage.
Contents
- Method
- Results
- Annual Returns
- When It Works
- When It Fails
- Limitations
- Run It Yourself
- Current Screen (SQL)
- Backtest
- Takeaway
- References
Data: FMP financial data warehouse, 2000–2025. Updated March 2026.
Method
Data source: Ceta Research (FMP financial data warehouse) Universe: SIX (Swiss Exchange), market cap > CHF 250M (~$284M USD) Period: 2000-2025 (25 annual rebalance periods) Rebalancing: Annual (July), equal weight top 30 by lowest asset growth Benchmark: Swiss Market Index (SMI, ^SSMI) Cash rule: Hold cash if fewer than 10 stocks qualify Transaction costs: Size-tiered model (0.1% mega-cap, 0.3% large-cap, 0.5% mid-cap) Data quality guards: Entry price > $1, single-period return capped at 200%
Historical financial data with 45-day lag to prevent look-ahead bias. Full methodology: backtests/METHODOLOGY.md.
The filters are identical to our US backtest:
| Criterion | Metric | Threshold |
|---|---|---|
| Capital discipline | Asset Growth (YoY) | -20% to +10% |
| Profitability | Return on Equity | > 8% |
| Asset efficiency | Return on Assets | > 5% |
| Pricing power | Operating Margin | > 10% |
| Size | Market Cap | > CHF 250M (~$284M USD) |
Results
| Metric | Portfolio | SMI |
|---|---|---|
| CAGR | 6.57% | 1.74% |
| Total Return | 390.75% | 53.22% |
| Max Drawdown | -36.88% | -41.74% |
| Volatility | 15.74% | -- |
| Sharpe Ratio | 0.386 | -- |
| Sortino Ratio | 0.772 | -- |
| Win Rate (vs SMI) | 72% | -- |
| Beta | 0.837 | 1.00 |
| Alpha | 5.03% | -- |
| Up Capture | 123.32% | -- |
| Down Capture | 32.27% | -- |
| Cash Periods | 0/25 | -- |
| Avg Stocks | 18.1 | -- |
The SMI returned 1.74% annually from 2000 to 2025. That's a remarkably weak result for a major developed-market index. The portfolio returned 6.57%, a +4.83% annual excess. $10,000 invested in the portfolio in 2000 grew to $49,075. The same amount in the SMI grew to $15,322.
The up capture of 123.32% tells you the portfolio didn't just match the SMI on good years: it exceeded it. When the SMI rose, the portfolio rose faster. Down capture of 32.27% means when the SMI fell, the portfolio fell only about one-third as much. That combination is rare. You got more of the upside and only a fraction of the downside. The alpha of 5.03% reflects genuine stock selection: the screen consistently identified the best Swiss companies.
Zero cash periods. In all 25 years, the strategy found at least 10 qualifying Swiss stocks. Switzerland's quality-heavy corporate landscape naturally produces companies with low asset growth, high margins, and strong returns on capital. The average holding was 18.1 stocks, below the 30-stock target, reflecting the concentrated universe. But the screen never ran dry.
Annual Returns
| Year | Portfolio | SMI | Excess |
|---|---|---|---|
| 2000 | +21.40% | -6.08% | +27.48 |
| 2001 | -11.65% | -19.85% | +8.20 |
| 2002 | -11.60% | -18.32% | +6.72 |
| 2003 | +17.05% | +17.06% | -0.01 |
| 2004 | +15.32% | +12.07% | +3.25 |
| 2005 | +14.53% | +22.87% | -8.34 |
| 2006 | +34.83% | +19.06% | +15.77 |
| 2007 | -13.21% | -25.55% | +12.35 |
| 2008 | -27.28% | -21.75% | -5.53 |
| 2009 | +26.19% | +11.56% | +14.63 |
| 2010 | +17.18% | +4.54% | +12.63 |
| 2011 | +2.21% | -2.18% | +4.39 |
| 2012 | +26.16% | +26.57% | -0.40 |
| 2013 | +16.50% | +11.31% | +5.18 |
| 2014 | +8.99% | +4.12% | +4.87 |
| 2015 | +6.13% | -10.10% | +16.23 |
| 2016 | +20.49% | +11.83% | +8.66 |
| 2017 | +8.08% | -5.33% | +13.41 |
| 2018 | -6.27% | +17.48% | -23.76 |
| 2019 | +2.60% | +1.66% | +0.94 |
| 2020 | +30.66% | +17.45% | +13.21 |
| 2021 | -15.15% | -9.05% | -6.10 |
| 2022 | -1.10% | +3.10% | -4.20 |
| 2023 | +8.41% | +7.06% | +1.35 |
| 2024 | +2.86% | -0.16% | +3.02 |
18 of 25 years beat the SMI. The seven underperformance years include two that were modest (2003 at -0.01%, 2012 at -0.40%), leaving only five genuinely bad years relative to the benchmark.
When It Works
2000 (Dot-Com Divergence): The portfolio gained 21.4% while the SMI fell 6.1%.
| Year | Portfolio | SMI | Excess |
|---|---|---|---|
| 2000 | +21.40% | -6.08% | +27.48 |
Swiss capital-disciplined companies had no tech-bubble exposure to unwind. No overpriced acquisitions, no excess capacity from the late-90s buildout. The quality filters ensured these weren't struggling firms. They were profitable businesses that simply hadn't chased the expansion cycle. The +27.5 point gap shows what capital discipline does in a bear market.
2015 and 2017 (SMI Weakness, Screen Holds): These two years illustrate the screen's core advantage. The SMI fell 10.1% in 2015 and fell 5.3% in 2017. The portfolio posted +6.1% and +8.1% respectively, adding +16.2 and +13.4 points of excess. Both years saw the SMI dragged down by its mega-cap concentration. Nestle and Novartis are large enough to pull the entire index. The equal-weight screen, with 18 stocks and tighter quality criteria, wasn't hostage to those names.
| Year | Portfolio | SMI | Excess |
|---|---|---|---|
| 2015 | +6.13% | -10.10% | +16.23 |
| 2017 | +8.08% | -5.33% | +13.41 |
2009-2010 (Post-Crisis Recovery): Companies that held steady through 2008 bounced back ahead of the benchmark. The screen picked businesses with tight balance sheets and real margins. They converted the recovery into earnings without needing to repair overextended books first.
| Year | Portfolio | SMI | Excess |
|---|---|---|---|
| 2009 | +26.19% | +11.56% | +14.63 |
| 2010 | +17.18% | +4.54% | +12.63 |
When It Fails
2018 (The One Bad Year): The portfolio lost 6.3% while the SMI gained 17.5%.
| Year | Portfolio | SMI | Excess |
|---|---|---|---|
| 2018 | -6.27% | +17.48% | -23.76 |
This was the worst year by a wide margin. The -23.76 point gap stands alone in the dataset. 2018 was unusual for Switzerland: the SMI had a strong year driven by Nestle, Roche, and Novartis, which are defensive heavyweights that tend to outperform in risk-off environments. The screen's equal-weight construction, which systematically underweights these mega-caps, worked against it in exactly the year those names led. This is a structural risk: when the index's top three holdings drive the benchmark, an equal-weight quality screen can lag badly regardless of the signal's validity.
2021 (Post-Vaccine Rotation): The portfolio fell 15.2% vs the SMI's -9.1%.
| Year | Portfolio | SMI | Excess |
|---|---|---|---|
| 2021 | -15.15% | -9.05% | -6.10 |
2021 saw rotation toward cyclicals and higher-beta names globally. Quality-factor portfolios underperformed in most markets. Switzerland wasn't an exception. The screen held its defensive posture while the market rewarded reopening trades.
Limitations
Concentrated market. Three companies dominate the SIX: Nestle, Roche, and Novartis. Together they represent roughly 50% of the Swiss Market Index. Even with 18.1 stocks on average, the portfolio is heavily influenced by what these mega-caps do. The 2018 underperformance is the clearest example. The equal-weight construction limits single-stock risk, but sector concentration remains.
CHF/USD currency effects. Returns are computed in Swiss Francs (CHF). The Franc appreciated roughly 40% against the Dollar from 2000 to 2025. For a USD-based investor, the 6.57% CHF CAGR translates to roughly 8-8.5% in Dollar terms. For a CHF-based investor, the comparison against the SMI stands as presented. The direction of the currency effect depends entirely on your base currency.
Small qualifying universe. The average portfolio held 18.1 stocks, well below the 30-stock target. Switzerland's listed equity market is small. After applying the CHF 250M cap floor and quality filters, the pool thins out. A single bad pick can move the annual result by 1-2 percentage points.
Index dominated by defensive sectors. Pharma, consumer staples, and financials make up the bulk of the SIX. The asset growth screen in Switzerland naturally loads up on these sectors because they tend to have stable balance sheets. This means some of the screen's alpha is a sector effect. In years when cyclicals or growth sectors lead globally, the portfolio will underperform by construction.
Run It Yourself
Run this screen live on Ceta Research
Current Screen (SQL)
WITH bs_current AS (
    SELECT symbol, totalAssets,
        ROW_NUMBER() OVER (PARTITION BY symbol ORDER BY dateEpoch DESC) AS rn
    FROM balance_sheet
    WHERE period = 'FY' AND totalAssets > 0
),
bs_prior AS (
    SELECT symbol, totalAssets AS prior_assets,
        ROW_NUMBER() OVER (PARTITION BY symbol ORDER BY dateEpoch DESC) AS rn
    FROM balance_sheet
    WHERE period = 'FY' AND totalAssets > 0
),
growth AS (
    SELECT bc.symbol,
        (bc.totalAssets - bp.prior_assets) / bp.prior_assets AS asset_growth
    FROM bs_current bc
    JOIN bs_prior bp ON bc.symbol = bp.symbol AND bp.rn = 2
    WHERE bc.rn = 1 AND bp.prior_assets > 0
)
SELECT g.symbol, p.companyName,
    ROUND(g.asset_growth * 100, 2) AS asset_growth_pct,
    ROUND(k.returnOnEquityTTM * 100, 2) AS roe_pct,
    ROUND(k.returnOnAssetsTTM * 100, 2) AS roa_pct,
    ROUND(f.operatingProfitMarginTTM * 100, 2) AS opm_pct,
    ROUND(k.marketCap / 1e9, 2) AS mktcap_bn
FROM growth g
JOIN profile p ON g.symbol = p.symbol
JOIN key_metrics_ttm k ON g.symbol = k.symbol
JOIN financial_ratios_ttm f ON g.symbol = f.symbol
WHERE g.asset_growth < 0.10
  AND g.asset_growth > -0.20
  AND k.returnOnEquityTTM > 0.08
  AND k.returnOnAssetsTTM > 0.05
  AND f.operatingProfitMarginTTM > 0.10
  AND k.marketCap > 250000000
  AND p.exchange = 'SIX'
ORDER BY g.asset_growth ASC
LIMIT 30
Backtest
# Clone the repo
git clone https://github.com/ceta-research/backtests.git
cd backtests

# Run Switzerland backtest
python3 asset-growth/backtest.py --preset switzerland --output results.json --verbose

# Run all exchanges
python3 asset-growth/backtest.py --global --output results/exchange_comparison.json
Takeaway
The Swiss Market Index returned 1.74% annually from 2000 to 2025. The asset growth screen on SIX returned 6.57%. That's a +4.83% annual edge over 25 years. $10,000 became $49,075 in the portfolio vs $15,322 in the SMI.
The capture ratio tells the core story: 123.32% up capture, 32.27% down capture. The portfolio outpaced the SMI when markets rose and absorbed only a third of its losses when markets fell. The screen beat the benchmark in 18 of 25 years.
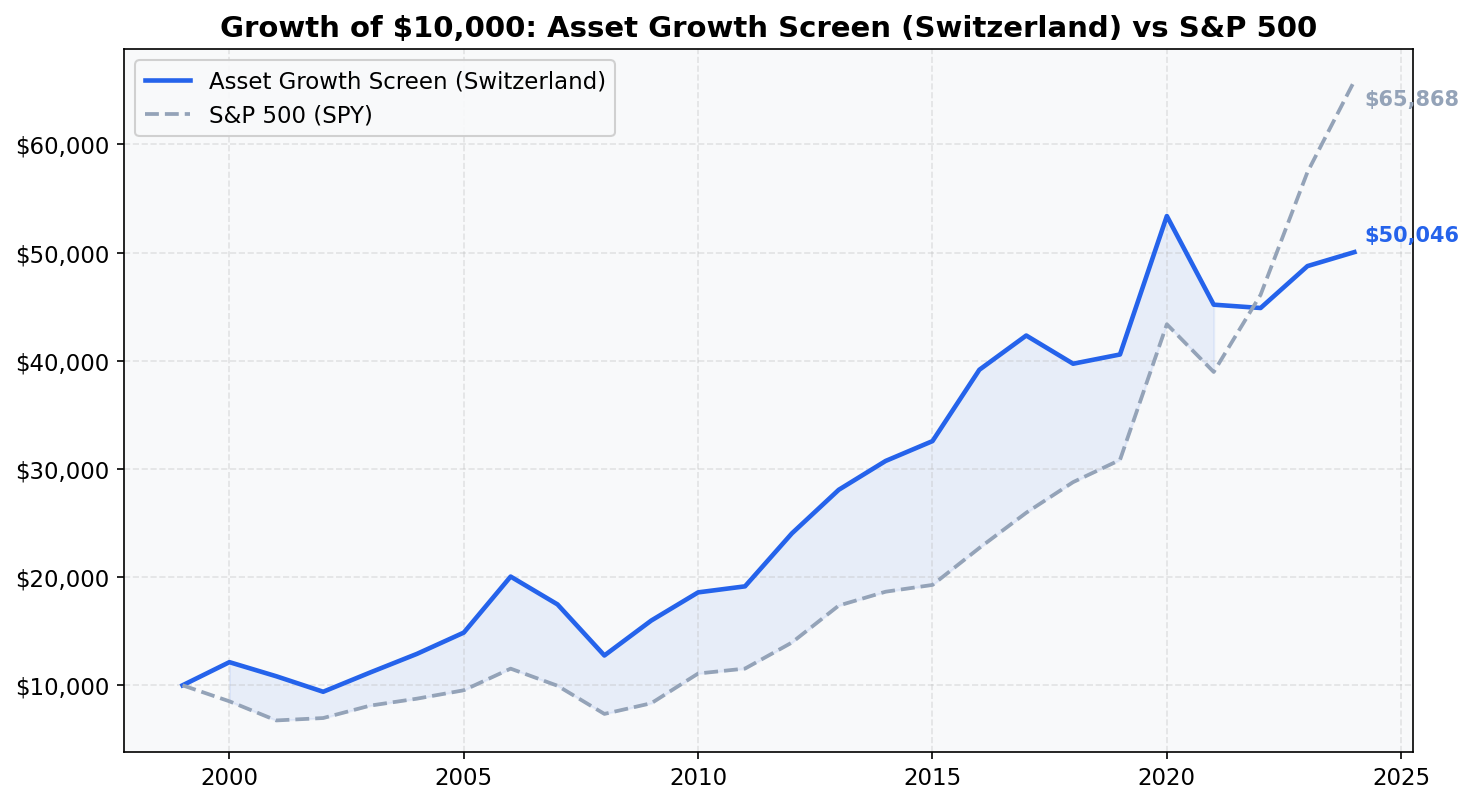
The old framing for Switzerland was that it trailed the S&P 500 by 1.28% annually. That comparison used the wrong benchmark. The SMI, not SPY, is Switzerland's baseline. Against its own market, the screen is one of the strongest results in the series.
The single structural risk is 2018-style underperformance: when Nestle, Roche, and Novartis dominate, an equal-weight screen that systematically underweights them will lag regardless of the signal. That happened once in 25 years at -23.76% excess. The other 24 years averaged a positive excess return.
The Swiss market is tailor-made for this strategy. Quality-heavy, defensive-sector-dominant, companies that grow slowly by design. The screen found qualifying stocks in all 25 years, zero cash periods, which is rare for a small exchange. The portfolio is concentrated (18.1 stocks average) in a market dominated by three mega-caps. The tradeoff is worth it: 25 years of data show the screen consistently picked the best Swiss companies.
Data: Ceta Research (FMP financial data warehouse), 2000-2025. Universe: SIX (Swiss Exchange). Annual rebalance (July), equal weight, top 30 by lowest asset growth. Returns in CHF unless noted. Benchmark: Swiss Market Index (SMI, ^SSMI). Full methodology: METHODOLOGY.md. Past performance does not guarantee future results. This is educational content, not investment advice.
References
- Cooper, M., Gulen, H. & Schill, M. (2008). "Asset Growth and the Cross-Section of Stock Returns." Journal of Finance, 63(4), 1609-1651.
- Watanabe, A., Xu, Y., Yao, T. & Yu, T. (2013). "The Asset Growth Effect: Insights from International Equity Markets." Journal of Financial Economics, 108(2), 529-563.
- Hou, K., Xue, C. & Zhang, L. (2015). "Digesting Anomalies: An Investment Approach." Review of Financial Studies, 28(3), 650-705.


