
Asset-Light Business Models on Indian Stocks: 25 Years of Data
We tested the asset-light composite score on Indian stocks (BSE + NSE) over 25 years. Asset-light returned 5.39% annually vs 1.60% for asset-heavy: a 3.79% spread. Smaller than the US, and India's capex-led growth cycle creates a headwind.

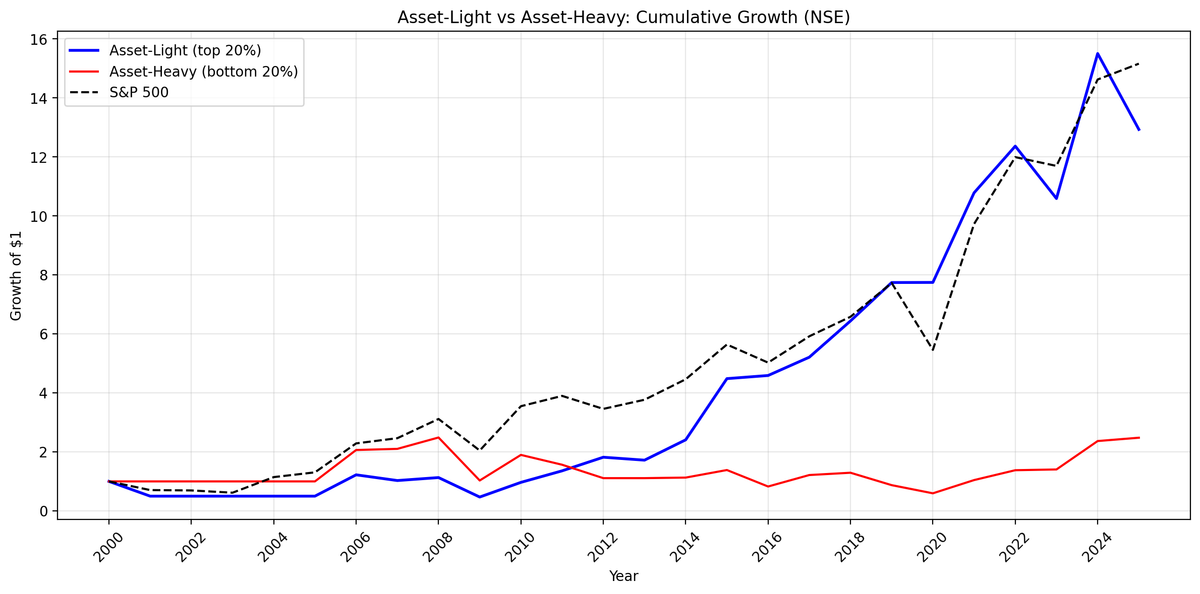
We tested the same asset-light composite score on Indian stocks (NSE). Over 25 years, asset-light companies returned 10.78% annually. The Sensex returned 11.49%. Asset-heavy companies returned 3.7%. The 7.08% light-heavy spread confirms the pattern: capital-efficient businesses outperform capital-intensive ones over time. But asset-light barely trails the Sensex overall, and the 2020-2025 reversal is the story.
Contents
Data: FMP financial data warehouse, 2000-2025. Updated April 2026.
Method
| Parameter | Value |
|---|---|
| Universe | NSE, market cap > 20B INR (~$240M USD), ex-financials/utilities |
| Period | 2000-2025 (25 years) |
| Signal | Composite: PERCENT_RANK(asset turnover) + PERCENT_RANK(1/capex intensity) + PERCENT_RANK(gross margin), averaged |
| Portfolios | Top quintile (>= 0.80) = Asset-Light, Bottom quintile (<= 0.20) = Asset-Heavy |
| Rebalancing | Annual (April 1) |
| Filing lag | 45 days (point-in-time) |
| Execution | Next-day close (MOC: signal on rebalance date, execute next trading day) |
| Weighting | Equal weight |
| Transaction costs | 0.1-0.5% per trade (size-tiered) |
| Benchmark | Sensex (^BSESN, local currency INR) |
What We Found
| Portfolio | CAGR | Volatility | Max DD | Sharpe |
|---|---|---|---|---|
| Asset-Light (top 20%) | 10.78% | 44.2% | -61.6% | 0.096 |
| Asset-Heavy (bottom 20%) | 3.70% | 38.3% | -81.2% | -0.089 |
| Sensex | 11.49% | 27.4% | -56.0% | 0.160 |
Dollar growth of $10,000 (INR-denominated returns): - Asset-Light: $129,319 - Asset-Heavy: $24,809 - Sensex (reference): $151,629
The asset-light portfolio nearly matches the Sensex over 25 years (-0.71% excess annually). Asset-heavy trails by 7.08% per year. The signal's value here is less about outperforming the index and more about separating the compounders from the capital destroyers within the NSE universe.
Decade breakdown
| Period | Light | Heavy | Spread | Sensex |
|---|---|---|---|---|
| 2000-04 | -10.0% | 0.0% | -10.0% | +11.5% |
| 2005-09 | +37.2% | +30.5% | +6.7% | +29.7% |
| 2010-14 | +39.0% | -4.4% | +43.5% | +10.5% |
| 2015-19 | +11.9% | -10.2% | +22.2% | +1.2% |
| 2020-25 | +13.9% | +36.5% | -22.6% | +25.5% |
Two things stand out. The 2010-2014 period showed an extraordinary asset-light advantage (+43.5% spread). But 2020-2025 reversed sharply: asset-heavy returned +36.5% vs asset-light's +13.9%. India's post-COVID recovery heavily rewarded capital-intensive sectors (metals, infrastructure, power) as the government ramped up capex spending.
Sample size caveat
The portfolio averaged 4 asset-light stocks per year, with 4 out of 25 periods holding zero qualifying stocks (cash). The early 2000s had almost no qualifying stocks above the 20B INR threshold. Results from 2005 onward are more reliable, but the small sample makes individual year returns noisy.
Limitations
Small sample. Averaging 4 stocks per period with 4 cash periods is thin. Results are directionally correct but not statistically robust.
Currency. All returns are in local currency (INR). This is the correct approach for measuring real purchasing power and comparing to the Sensex benchmark.
India's capex cycle. India's recent growth has been infrastructure-led. The government's capital expenditure push benefits precisely the asset-heavy sectors this screen avoids. This is a structural headwind for the asset-light signal in India over the medium term.
Takeaway
The asset-light signal works directionally in India: capital-efficient businesses outperform capital-intensive ones by 7% per year over the full period. The portfolio nearly matches the Sensex. But the 2020-2025 reversal is real, and it may persist as long as India's capex cycle continues. Use asset-light as a filter (avoid the bottom quintile) rather than a standalone strategy in the Indian market.
Data: Ceta Research (FMP financial data warehouse), 2000-2025. Full methodology: cetaresearch.com/strategies.
Part of a series: See also: Asset-Light on US Stocks (flagship), Asset-Light on Chinese Stocks, Asset-Light: Global Comparison.


