
Asset-Light Business Models on US Stocks: 25 Years of Data
We scored US stocks on asset turnover, capex intensity, and gross margin over 25 years. Asset-light companies (top 20%) returned 2.82% annually. Asset-heavy (bottom 20%) returned -13.40%. The 16% annual spread is consistent across every decade, but the signal works better as a filter than a...

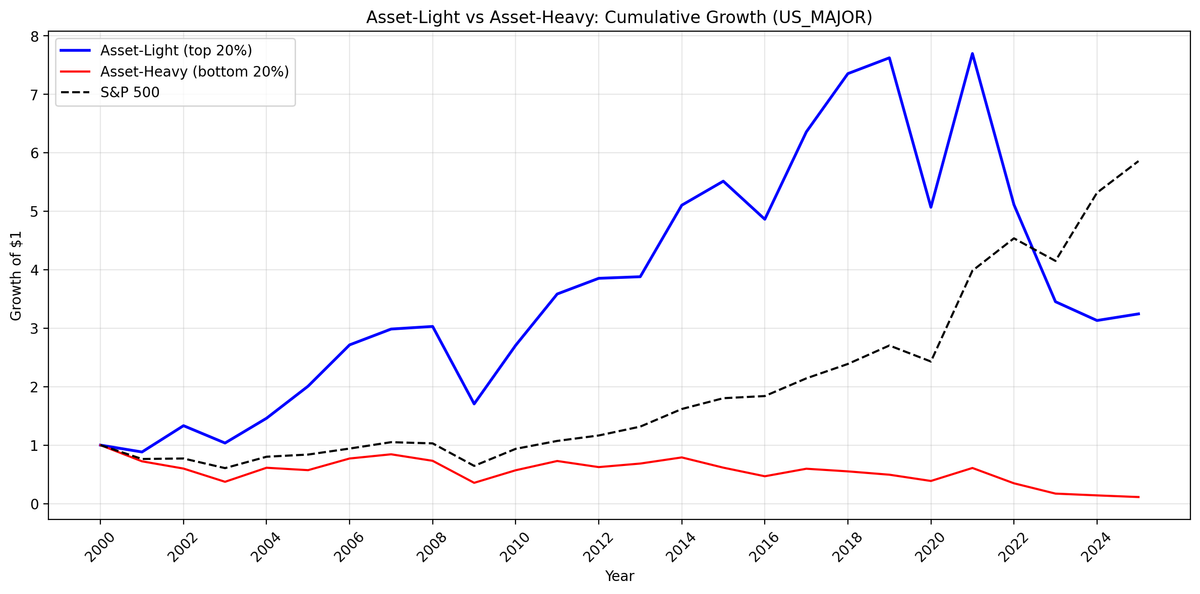
We built a composite asset-light score from three metrics: asset turnover, capex intensity, and gross margin. Over 25 years (2000-2025), the top quintile (asset-light) returned 4.82% annually. The bottom quintile (asset-heavy) returned -8.38%. That's a 13.2% annual spread, consistent across every five-year window we tested. Asset-light doesn't beat the S&P 500 on its own, but it separates businesses that compound from businesses that destroy capital.
Contents
- Method
- What We Found
- Why asset-light doesn't beat SPY
- The spread is consistent across decades
- What kinds of stocks are in each portfolio?
- Limitations
- Run It Yourself
- Takeaway
Data: FMP financial data warehouse, 2000-2025. Updated April 2026.
Method
| Parameter | Value |
|---|---|
| Universe | NYSE + NASDAQ + AMEX, market cap > $1B, ex-financials/utilities |
| Period | 2000-2025 (25 years) |
| Signal | Composite: PERCENT_RANK(asset turnover) + PERCENT_RANK(1/capex intensity) + PERCENT_RANK(gross margin), averaged |
| Portfolios | Top quintile (score >= 0.80) = Asset-Light, Bottom quintile (score <= 0.20) = Asset-Heavy |
| Rebalancing | Annual (April 1) |
| Filing lag | 45 days (point-in-time) |
| Execution | Next-day close (MOC: signal on rebalance date, execute next trading day) |
| Weighting | Equal weight |
| Transaction costs | 0.1-0.5% per trade (size-tiered by market cap) |
| Benchmark | S&P 500 (SPY) |
Three metrics define the signal:
Asset turnover = revenue / total assets. Higher is better. Measures how much revenue the business generates per dollar of assets.
Capex intensity = ABS(capital expenditure) / revenue. Lower is better. Measures how much the business must reinvest to sustain revenue.
Gross margin = gross profit / revenue. Higher is better. Measures pricing power and cost structure.
Each metric is PERCENT_RANK'd across the universe. Stocks scoring in the top 20% on the average of all three ranks are "asset-light." Bottom 20% are "asset-heavy." We exclude Financial Services (asset turnover is meaningless for banks) and Utilities (capex is regulated, not discretionary).
What We Found
25-year summary (2000-2025):
| Portfolio | CAGR | Volatility | Max DD | Sharpe | Sortino |
|---|---|---|---|---|---|
| Asset-Light (top 20%) | 4.82% | 29.3% | -59.3% | 0.096 | 0.170 |
| Asset-Heavy (bottom 20%) | -8.38% | 33.2% | -88.8% | -0.313 | -0.438 |
| S&P 500 | 7.33% | 21.1% | -39.3% | 0.253 | 0.484 |
Dollar growth of $10,000 invested in 2000: - Asset-Light: $32,454 - S&P 500: $58,591 - Asset-Heavy: $1,122
$10,000 in asset-heavy stocks became $1,122 over 25 years. The bottom quintile by asset-light score destroyed 89% of invested capital.
The spread is the signal. Asset-light outperformed asset-heavy by 13.2% annually. This isn't about finding stocks that beat the index. It's about identifying what to avoid: capital-intensive businesses with low margins and low asset efficiency compound losses over time.
Why asset-light doesn't beat SPY
The asset-light portfolio returned 4.82% vs SPY's 7.33%. Two factors explain the gap:
Concentration. The portfolio averaged 14 stocks per year (ranging from 3 in 2001 to 30 in 2024). With fewer than 20 stocks, a few bad picks have outsized impact. SPY holds 500 stocks.
Volatility. 29.3% annualized vs SPY's 21.1%. Higher volatility with similar or lower returns produces a worse risk-adjusted result. The Sharpe ratio of 0.096 confirms this. The down capture of 138.0% means the portfolio fell harder than SPY in downturns.
The spread is consistent across decades
| Period | Light | Heavy | Spread |
|---|---|---|---|
| 2000-04 | +19.1% | -5.0% | +24.1% |
| 2005-09 | +12.3% | +8.0% | +4.3% |
| 2010-14 | +16.0% | +3.3% | +12.8% |
| 2015-19 | +1.0% | -7.2% | +8.1% |
| 2020-25 | -4.0% | -14.9% | +10.9% |
The spread ranged from +4.3% to +24.1%. It persisted through the dot-com crash, the financial crisis, COVID, and the 2022 drawdown. Asset-heavy businesses consistently underperformed asset-light businesses, regardless of market conditions.
The 2015-19 and 2020-25 periods show both portfolios underperforming SPY, but the spread between them remained wide. This is a relative signal, not an absolute one.
What kinds of stocks are in each portfolio?
Asset-light companies score high on all three metrics: high turnover, low capex, high margins. Think professional services (Accenture, Mastercard), software (Adobe, Intuit), and healthcare distributors (McKesson, AmerisourceBergen).
Asset-heavy companies score low on all three: low turnover, high capex, low margins. Think capital-intensive industrials, commodity producers, and airlines. Businesses where each dollar of revenue requires a matching dollar of physical assets.
Limitations
Sector concentration. Asset-light portfolios naturally overweight technology, healthcare, and consumer services. Some of the return spread is sector exposure, not pure asset efficiency.
Small portfolio size. Averaging 14 stocks is thin for a portfolio strategy. Results from 2000-2004, when the portfolio held 3-7 stocks, are statistically noisy. A practitioner would need to relax the quintile threshold or lower the market cap floor to build a larger portfolio.
Intangible investment not captured. R&D and marketing spend are expensed, not capitalized. A software company investing $1 billion in R&D has no corresponding asset on the balance sheet. The composite score overstates the "lightness" of R&D-heavy businesses.
Survivorship. FMP data includes delisted stocks, but coverage in the early 2000s is thinner than recent years. The universe grew from 603 stocks in 2000 to 2,889 in 2022.
Run It Yourself
Simple screen (current data):
SELECT
    k.symbol,
    p.companyName,
    f.assetTurnoverTTM,
    ABS(k.capexToRevenueTTM) * 100 AS capex_to_rev_pct,
    f.grossProfitMarginTTM * 100 AS gross_margin_pct,
    k.marketCap / 1e9 AS market_cap_b
FROM key_metrics_ttm k
JOIN financial_ratios_ttm f ON k.symbol = f.symbol
JOIN profile p ON k.symbol = p.symbol
WHERE f.assetTurnoverTTM > 1.5
  AND ABS(k.capexToRevenueTTM) < 0.05
  AND k.marketCap > 1000000000
  AND p.sector NOT IN ('Financial Services', 'Utilities')
ORDER BY f.assetTurnoverTTM DESC
LIMIT 50
Run this query on Ceta Research Data Explorer.
Full backtest code: github.com/ceta-research/backtests/tree/main/asset-light
Takeaway
The asset-light composite score is a better filter than a signal. It reliably separates capital-efficient businesses from capital-intensive ones, and that separation produces a 13% annual return spread over 25 years. But as a standalone long portfolio, the top quintile doesn't beat the index due to concentration and volatility.
Use it as a quality overlay: screen for asset-light characteristics within an existing strategy (value, momentum, dividend) to avoid the bottom of the capital efficiency distribution. That's where the real damage happens.
Data: Ceta Research (FMP financial data warehouse), 2000-2025. Full methodology: cetaresearch.com/strategies.
Part of a series: This is the US analysis. See also: Asset-Light on Indian Stocks, Asset-Light on Chinese Stocks, Asset-Light: Global Comparison.


