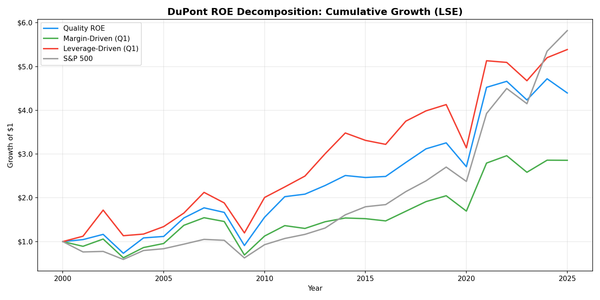
value investing
Value-Momentum on Indian Stocks: 15.69% CAGR Over 21 Years of NSE Data
Value-momentum composite on NSE from 2004 to 2025. 15.69% CAGR, 4,016% total return. 62% down capture, 110% up capture, 5.45% annual alpha vs Sensex.
value investing
Value-momentum composite on NSE from 2004 to 2025. 15.69% CAGR, 4,016% total return. 62% down capture, 110% up capture, 5.45% annual alpha vs Sensex.
value investing
Value-momentum composite on Johannesburg Stock Exchange from 2004 to 2025. 11.61% CAGR with the lowest down capture (1.65%) and shallowest max drawdown (-28.44%) of any exchange tested.
value investing
Value-momentum composite on Stockholm Exchange from 2003 to 2025. 9.67% CAGR with +6.75% alpha vs the OMX30, 58% down capture, and a 0.697 Sortino ratio.
value investing
We combined value (low P/E) and momentum (12-month price trend) into a composite screen and backtested it on all US exchanges from 2000 to 2025. Value-Momentum returned 11.18% annually vs 7.75% for the S&P 500.
etf
We backtested a portfolio of the 30 least ETF-owned quality stocks on Indian markets (BSE + NSE) over 20 years. Result: 4.47% CAGR vs 10.61% for SPY, but a 50% win rate and +35.7% excess return in 2008. India's concentrated ETF market creates real pockets of under-coverage.
etf
We backtested a portfolio of the 30 least ETF-owned quality A-shares over 20 years. Result: 8.75% CAGR vs 10.61% for SPY, the closest to matching the benchmark among strong-signal exchanges. But two Chinese bull markets (2006, 2014) account for most of the outperformance.
etf
We backtested a portfolio of the 30 least ETF-owned quality stocks on XETRA over 20 years. Result: 7.12% CAGR vs 10.61% for SPY, but the best Sharpe ratio (0.260) among all strong-signal exchanges. Germany's Mittelstand offers the most efficient anti-crowding returns.
value investing
We backtested a P/B < 1.5 + ROE > 8% screen on Stockholm-listed stocks from 2000 to 2025. 12.43% CAGR, Sharpe ratio of 0.473, and a down capture of only 46.79% vs the OMX Stockholm 30. Best risk-adjusted result of 18 exchanges we tested. Returns in SEK.
global stocks
D/E reduction + ROE > 8% tested on 13 exchanges from 2001-2025. 8 of 13 beat local benchmarks. Sweden +5.11% vs OMX, Japan +4.27% vs Nikkei, Canada +3.75% vs TSX. Comparing to SPY missed real alpha.
working capital
We tested working capital efficiency as a stock selection signal across all US exchanges from 2000 to 2025. The result: 11.07% CAGR vs 7.64% for the S&P 500, with a down capture ratio of just 13%. The portfolio lost 13 cents for every dollar the market lost in downturns.
backtests
We ran the same cyclical timing signal across 15 exchanges over 24 years. India: +4.55% annual excess. China: -17.97% annual excess. Germany and Sweden also positive. The same revenue growth signal produced opposite outcomes in markets with different economic structures.
etf
We backtested a portfolio of the 30 least ETF-owned quality stocks on US markets over 20 years. Result: 4.56% CAGR vs 10.61% for SPY. Under-owned stocks don't outperform. Here's why.