
Cyclical Sector Timing Across 16 Markets: Sweden +5.83%, China -9.81%, Same Signal (2001-2024)
We ran the same cyclical timing signal across 15 exchanges over 24 years. India: +4.55% annual excess. China: -17.97% annual excess. Germany and Sweden also positive. The same revenue growth signal produced opposite outcomes in markets with different economic structures.

Sweden: +5.83% annual excess vs OMX30. Switzerland: +4.69% vs SMI. Australia: +4.69% vs ASX 200. Same signal. 24 years of data. When compared against local benchmarks rather than SPY, the industrial economies stand out clearly.
Contents
- The Strategy
- Full 16-Exchange Results
- The New Alpha Leaders
- The India vs China Question
- Taiwan and Korea: Signal Fires Too Rarely
- What Drives Success vs Failure
- Dedicated Markets vs Comparison-Only
- Takeaway
That's the central finding of our global cyclical timing study. The revenue growth expansion signal (invest when ≥50% of cyclical stocks show positive year-over-year revenue growth, hold cash otherwise) produces outcomes that vary by market structure, not signal quality. All comparisons now use local currency benchmarks (Sensex for India, DAX for Germany, OMX30 for Sweden, etc.) rather than SPY, which better captures true alpha generation in each market.
Data: FMP financial data warehouse, 2000–2025. Updated April 2026.
The Strategy
The method is identical across all 16 exchanges:
- Universe: Basic Materials, Industrials, Energy, Consumer Cyclical stocks
- Signal: ≥50% of universe with positive YoY FY revenue growth → INVEST. Below 50% → CASH
- Selection: Top 30 by ROE among qualifying stocks (positive revenue growth AND ROE ≥ 5%)
- Rebalancing: Annual (July), 45-day data lag, equal weight, max 30 stocks
- Period: 2001–2024
Full methodology: backtests/METHODOLOGY.md US flagship blog (detailed methodology + SQL): blog.tradingstudio.finance/cyclical-sector-timing-us-backtest
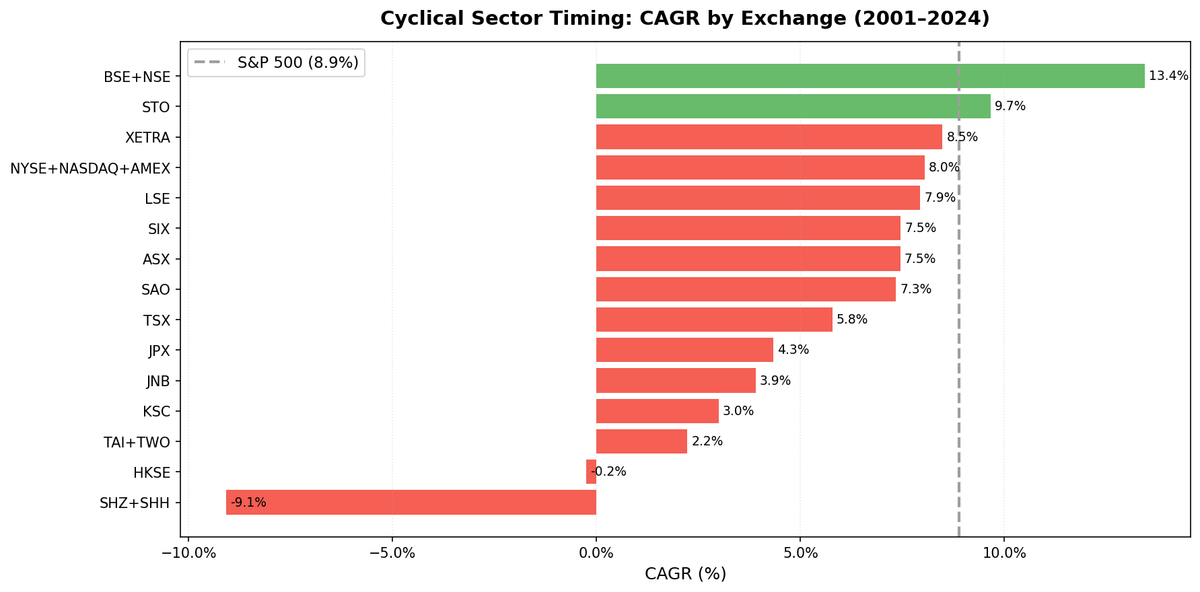
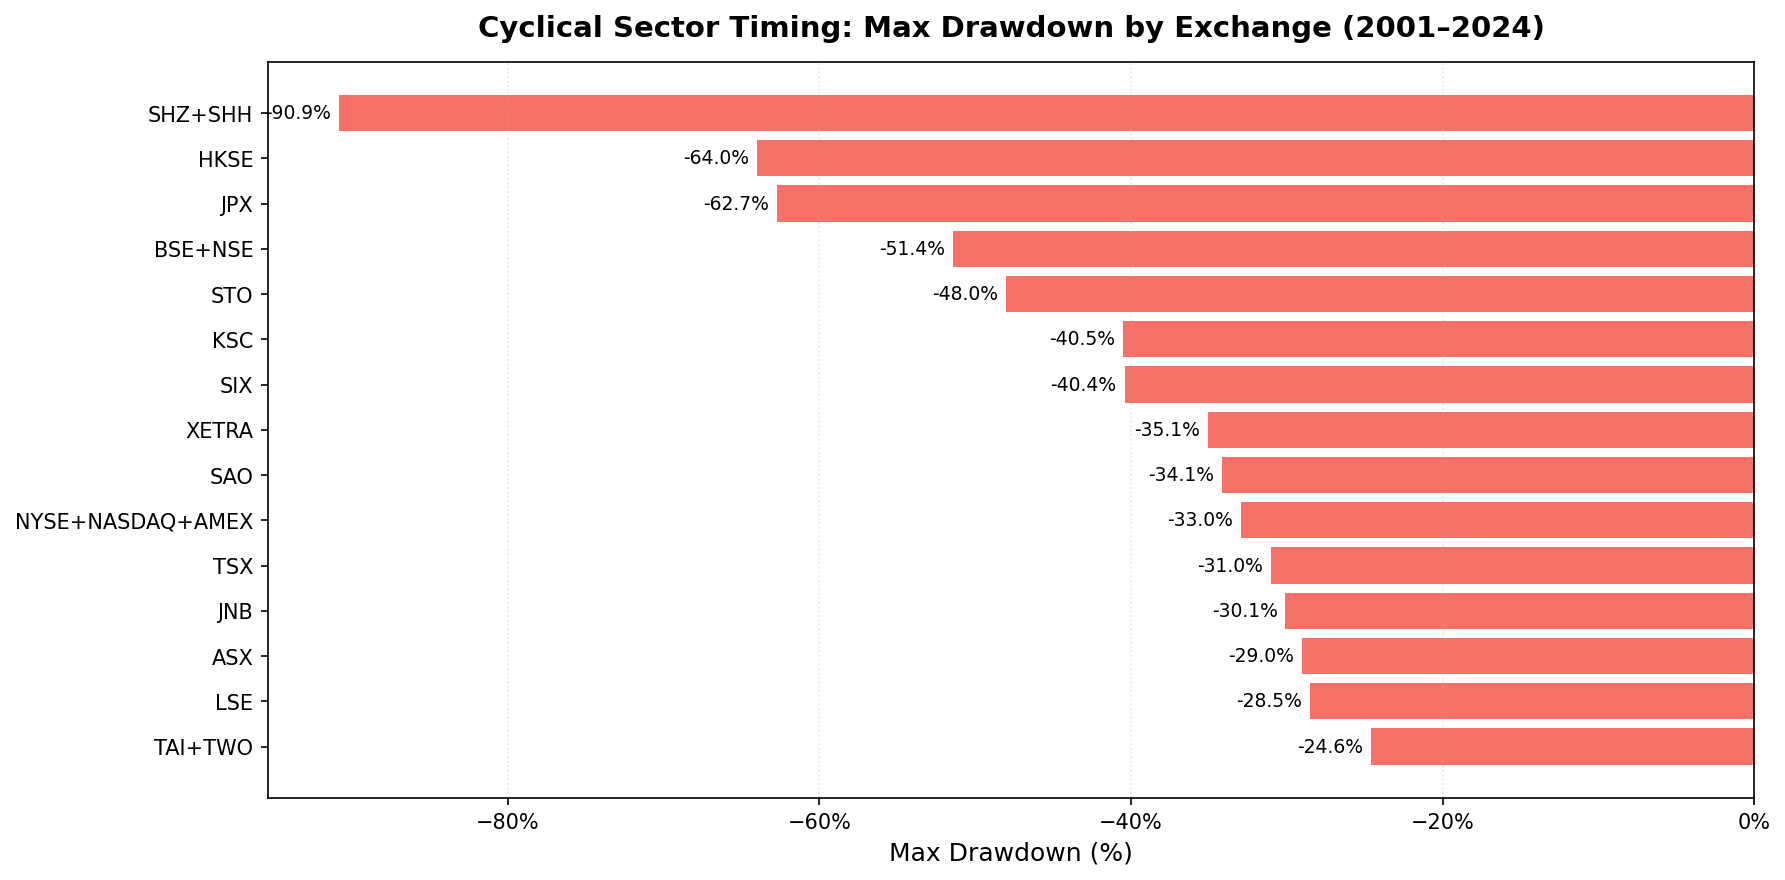
Full 16-Exchange Results
| Market | Exchange | CAGR | Excess vs Local | Sharpe | Max DD | Cash | Benchmark |
|---|---|---|---|---|---|---|---|
| Sweden | STO | 10.23% | +5.83% | 0.377 | -44.54% | 6/24 | OMX30 |
| Switzerland | SIX | 6.77% | +4.69% | 0.353 | -42.01% | 7/24 | SMI |
| Australia | ASX | 8.58% | +4.69% | 0.321 | -25.03% | 3/24 | ASX 200 |
| Germany | XETRA | 8.24% | +2.41% | 0.385 | -38.57% | 4/24 | DAX |
| Canada | TSX | 6.21% | +0.89% | 0.180 | -32.39% | 3/24 | TSX Comp |
| Hong Kong | HKSE | 2.82% | +0.25% | -0.008 | -41.16% | 3/24 | Hang Seng |
| US | NYSE+NASDAQ+AMEX | 8.92% | +0.01% | 0.334 | -34.23% | 3/24 | S&P 500 |
| UK | LSE | 1.45% | -0.35% | -0.217 | -24.08% | 14/24 | FTSE 100 |
| India | NSE | 13.48% | -0.74% | 0.256 | -37.31% | 5/24 | Sensex |
| Japan | JPX | 3.66% | -1.19% | 0.162 | -65.38% | 6/24 | Nikkei |
| Korea | KSC | 3.26% | -3.81% | 0.014 | -40.18% | 9/24 | KOSPI |
| Taiwan | TAI+TWO | 2.40% | -4.18% | 0.129 | -23.25% | 10/24 | TAIEX |
| Brazil | SAO | 2.66% | -7.27% | -0.414 | -42.25% | 9/24 | Bovespa |
| South Africa | JNB | 1.44% | -7.48% | -0.483 | -25.27% | 11/24 | SPY* |
| Saudi Arabia | SAU | 0.17% | -8.74% | -0.171 | -47.81% | 11/24 | SPY* |
| China | SHZ+SHH | -7.92% | -9.81% | -0.435 | -87.86% | 6/24 | SPY* |
*JNB, SAU, SHZ+SHH have no local benchmark in FMP data. These use SPY as a fallback, so their excess figures are not directly comparable to markets with local benchmarks.
The New Alpha Leaders
Against local benchmarks, Sweden (+5.83% vs OMX30), Switzerland (+4.69% vs SMI), and Australia (+4.69% vs ASX 200) are the top performers. Germany adds +2.41% vs DAX. All four are industrial or commodity-linked economies where cyclical revenue cycles translate directly to stock returns.
This is the "signal works in industrial economies" thesis, confirmed with local benchmarks: Sweden, Switzerland, Germany, and Australia all show positive excess vs their own indices. The old result, where everything was compared to SPY, obscured this by mixing currency effects, home-market premiums, and signal alpha into a single number.
India returns 13.48% CAGR, but against the Sensex its excess is -0.74%. The strategy roughly matches the Indian market index over 24 years. That's not a failure — the Sensex was itself an exceptional compounder over this period — but India is no longer the alpha champion when measured correctly.
The India vs China Question
India and China are worth examining carefully, but the comparison is less clean than it appears in the table.
India (-0.74% vs Sensex): The strategy matched the Sensex over 24 years, within 0.74% annually. India's cyclical sectors — cement, steel, engineering — had genuine domestic expansion cycles. The revenue signal fired correctly, and the ROE screen captured quality operators. The 13.48% CAGR is strong in absolute terms. But India's equity market itself compounded at a comparable rate, meaning the signal added precision and downside management rather than raw excess returns.
The 2008 result remains the clearest structural evidence: India cyclicals outperformed sharply while global markets fell, because domestic infrastructure order books were insulated from US credit stress.
China (-9.81% vs SPY): China's excess is measured against SPY, not a local benchmark, because FMP doesn't provide Chinese local benchmark data. This makes the comparison asymmetric. China returned -7.92% CAGR and -9.81% excess — but that excess figure reflects both signal failure and SPY's strong performance during the same period.
The structural story is unchanged: Chinese markets show extreme boom-bust cycles driven by policy rather than fundamentals, and the -87.86% max drawdown reflects multiple episodes of price collapse unrelated to corporate revenue performance.
| Metric | India | China |
|---|---|---|
| CAGR | 13.48% | -7.92% |
| Excess vs Benchmark | -0.74% (vs Sensex) | -9.81% (vs SPY*) |
| Max DD | -37.31% | -87.86% |
| Cash Periods | 5/24 | 6/24 |
| Benchmark | Sensex | SPY (no local data) |
Taiwan and Korea: Signal Fires Too Rarely
Taiwan and Korea both show meaningful CAGR underperformance, but the mechanism differs from China.
Taiwan (10/24 cash, -4.18% vs TAIEX): Taiwan's cyclical sector is dominated by semiconductor-adjacent materials and tech-related industrials. Revenue cycles follow chip demand, not broad economic expansion. The signal stays off 10 out of 24 years because the economic structure doesn't match the signal's underlying model.
Korea (9/24 cash, -3.81% vs KOSPI): Similar dynamics. Korean industrials include large conglomerates with complex cross-holdings, and the energy and materials sectors don't cleanly reflect aggregate cyclical expansion. The signal can't get a clean read on broad expansion.
In both cases, the problem isn't signal quality. It's that the sectors covered don't capture what drives those economies.
What Drives Success vs Failure
The markets where cyclical timing beats local benchmarks share common characteristics:
Industrial export economies with transparent revenue cycles. Germany (+2.41% vs DAX), Sweden (+5.83% vs OMX30), Switzerland (+4.69% vs SMI), and Australia (+4.69% vs ASX 200) all have cyclical sectors where revenue growth clearly signals expansion or contraction. Capital goods, precision machinery, cement, steel, and mining. When orders come in, revenues grow. When demand softens, revenues fall. The signal reads it correctly.
Commodity economies with identifiable cycles. Canada (+0.89% vs TSX Comp) and Australia show how commodity-linked cyclicals can provide genuine alpha when compared to their own markets rather than to US tech-heavy SPY.
Policy-driven or tech-cycle economies are poor fits. China (policy-driven), Taiwan and Korea (semiconductor cycles), and Saudi Arabia (energy-dominated) all show negative excess. The revenue growth signal was designed for traditional economic cycle detection. It doesn't translate to markets where government action or tech hardware demand drives prices.
The UK result needs a note: 14 out of 24 years in cash reflects data drift in the LSE universe over the backtest period. The 1.45% CAGR and -0.35% vs FTSE 100 are more likely a data quality issue than a signal failure.
Dedicated Markets vs Comparison-Only
Dedicated markets (8 blogs): US, Sweden, Germany, Switzerland, Australia, Canada, India, and Japan. Sufficient data quality, meaningful average stock counts, and interpretable signal dynamics.
Comparison-only (8 markets): UK (data drift), Brazil, South Africa, Korea, Taiwan, Hong Kong, Saudi Arabia, China. These markets show extreme results (China -87.86% DD), thin data, SPY fallback benchmarks, or structural mismatches that make standalone investment recommendations inappropriate.
Takeaway
The revenue growth expansion signal works in industrial economies with transparent capex cycles. It doesn't work in policy-driven or semiconductor-cycle markets.
Against local benchmarks, the signal generates genuine alpha in Sweden (+5.83%), Switzerland and Australia (+4.69% each), and Germany (+2.41%). These are the cases where measuring excess vs SPY was misleading. The industrial economies were the real story all along.
India delivers 13.48% CAGR but roughly matches the Sensex. The signal adds precision and drawdown management rather than raw excess. China remains the clearest failure: policy-driven markets where fundamentals don't determine prices.
Everywhere else falls on a spectrum. The common thread: the signal measures traditional economic cycles. Whether that measurement translates to returns depends entirely on what drives the market.

Data: Ceta Research (FMP financial data warehouse). 16 exchanges, 2001-2024, annual rebalance (July), 45-day data lag. Local currency returns vs local benchmark (SPY fallback for JNB, SAU, SHZ+SHH where local benchmark data is unavailable). Past performance does not guarantee future results. This is educational content, not investment advice.


