
Value-Momentum on South African Stocks: 11.61% CAGR with Just 28% Max Drawdown
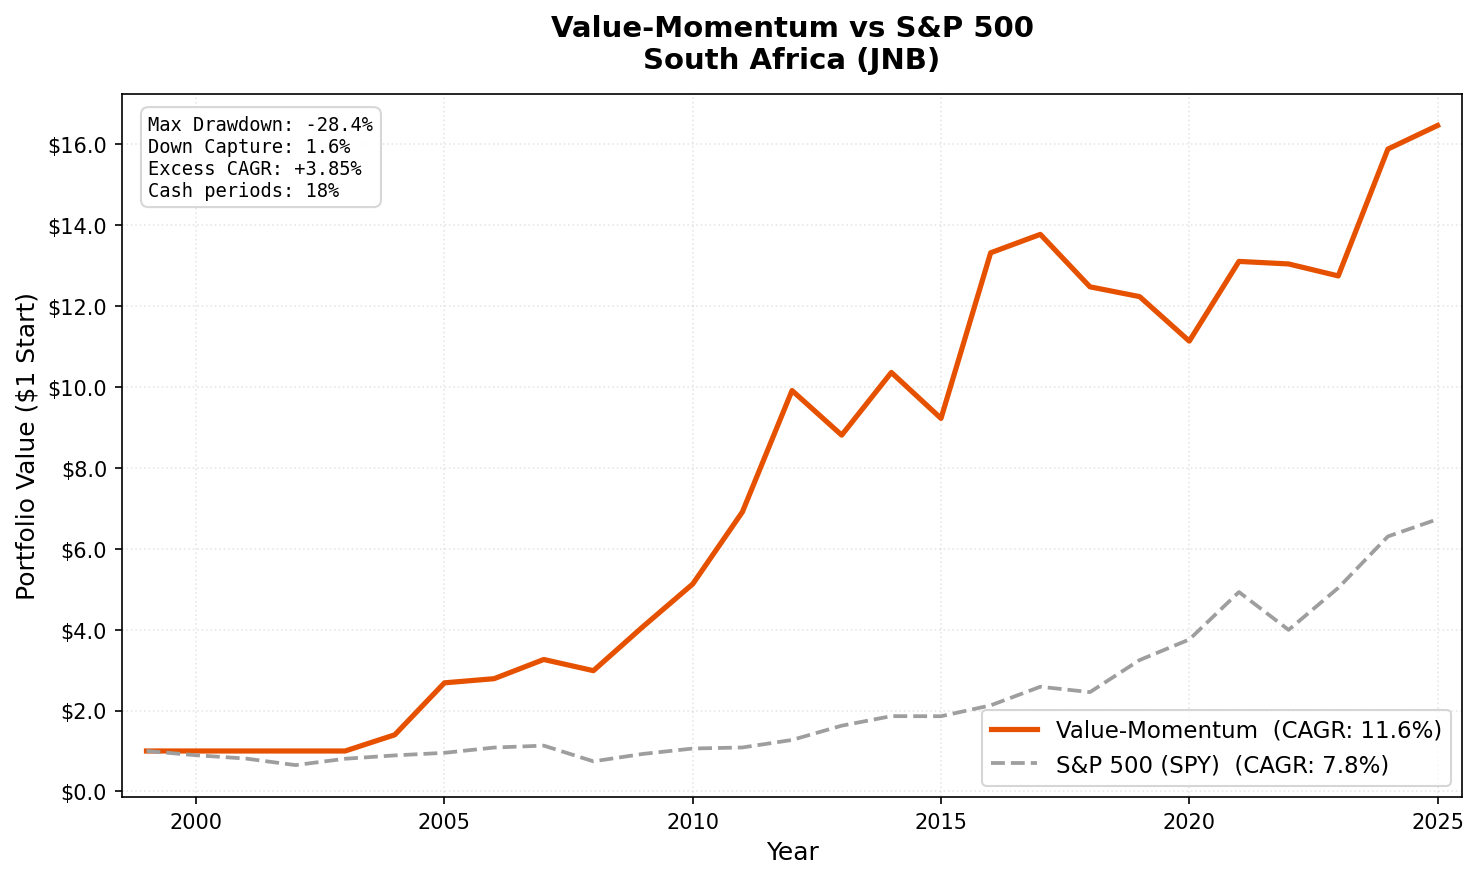
Value-momentum composite on Johannesburg Stock Exchange from 2004 to 2025. 11.61% CAGR with the lowest down capture (1.65%) and shallowest max drawdown (-28.44%) of any exchange tested.


Of the 17 exchanges we tested value-momentum on, South Africa had the best crisis protection. In 2008, while SPY lost 34.31%, the JNB portfolio lost 8.48%. The max drawdown over 25 years was just -28.44%. That's the shallowest of any exchange in the study.
Contents
11.61% CAGR in ZAR, 3.85% excess over SPY. The return isn't the headline. The drawdown profile is.
Data: FMP financial data warehouse, 2000–2025. Updated March 2026.
Method
| Parameter | Value |
|---|---|
| Universe | JNB (Johannesburg Stock Exchange) |
| Filters | P/E 0-20, ROE > 10%, D/E < 1.0 |
| Ranking | 12-month momentum, composite percentile |
| Rebalancing | Semi-annual (January, July) |
| Holding period | 6 months |
| Max positions | 30 stocks, equal weight |
| Cash rule | Fewer than 10 qualifying stocks |
| Market cap | > R10B (~$550M USD) |
| Data source | FMP via Ceta Research warehouse |
| Execution | Next-day close (MOC execution model) |
| Transaction costs | Size-tiered (0.1-0.5% one-way) |
| Benchmark | S&P 500 (SPY) |
| Period | 2000-2025 (effective: 2004-2025) |
Note: FMP does not have a JSE All Share index (^J203.JO) in its stock_eod table. SPY is used as benchmark. Returns are in ZAR, so the comparison is cross-currency.
Based on Asness, Moskowitz, and Pedersen (2013). For the full methodology, see our US flagship post.
The Screen
-- Value-Momentum South Africa (JNB) Screen
-- Run at: cetaresearch.com/data-explorer?q=FD9LIbg2FM

SELECT
    k.symbol,
    p.companyName,
    f.priceToEarningsRatioTTM as pe_ratio,
    k.returnOnEquityTTM * 100 as roe_pct,
    f.debtToEquityRatioTTM as debt_to_equity,
    k.marketCap / 1e9 as market_cap_billions
FROM key_metrics_ttm k
JOIN financial_ratios_ttm f ON k.symbol = f.symbol
JOIN profile p ON k.symbol = p.symbol
WHERE f.priceToEarningsRatioTTM > 0
    AND f.priceToEarningsRatioTTM < 20
    AND k.returnOnEquityTTM > 0.10
    AND f.debtToEquityRatioTTM >= 0
    AND f.debtToEquityRatioTTM < 1.0
    AND k.marketCap > 10e9
    AND p.exchange IN ('JNB')
ORDER BY f.priceToEarningsRatioTTM ASC
LIMIT 100
What We Found
Full period summary (2004-2025):
| Metric | Value-Momentum | S&P 500 (SPY) |
|---|---|---|
| CAGR | 11.61% | 7.76% |
| Total Return | 1,546.89% | — |
| Max Drawdown | -28.44% | -36.65% |
| Volatility | 24.16% | — |
| Sharpe Ratio | 0.108 | — |
| Sortino Ratio | 0.222 | — |
| Calmar Ratio | 0.408 | — |
| Up Capture | 99.77% | 100% |
| Down Capture | 1.65% | 100% |
| Beta | 0.458 | 1.0 |
| Alpha | 3.85% | — |
| Win Rate | 52.94% | — |
| Cash Periods | 9 of 51 | — |
| Avg Stocks | 25.4 | — |
The 1.65% down capture is extraordinary. When SPY fell, this portfolio barely moved. The Calmar ratio (CAGR divided by max drawdown) of 0.408 is the highest of all exchanges we tested.
A note on the Sharpe ratio. 0.108 looks poor next to other exchanges. South Africa's risk-free rate averaged around 9% through most of this period. The Sharpe is computed against that local baseline. The 3.85% excess CAGR over SPY and the Calmar of 0.408 are the better comparison metrics.
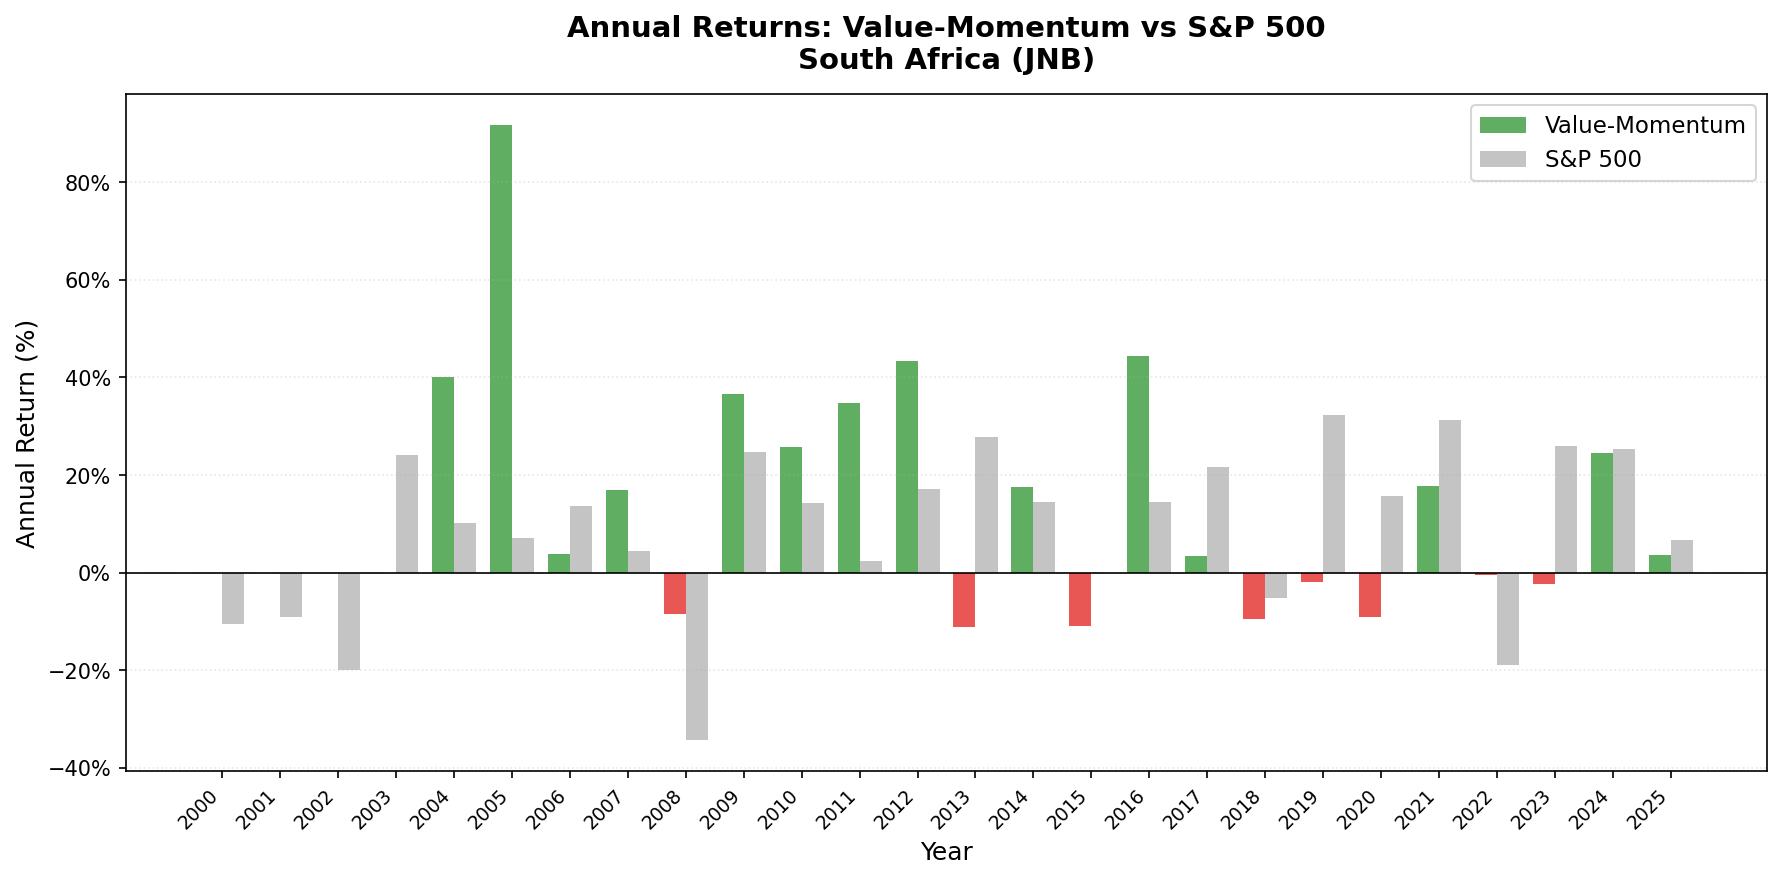
Year-by-year results:
| Year | Value-Momentum | SPY | Notes |
|---|---|---|---|
| 2000 | 0.00% | — | Cash |
| 2001 | 0.00% | — | Cash |
| 2002 | 0.00% | — | Cash |
| 2003 | 0.00% | — | Cash |
| 2004 | +40.04% | +10.24% | First invested year |
| 2005 | +91.77% | +7.17% | |
| 2006 | +3.82% | +13.65% | |
| 2007 | +17.03% | +4.40% | |
| 2008 | -8.48% | -34.31% | Crisis protection |
| 2009 | +36.55% | +24.73% | Strong bounce |
| 2010 | +25.79% | +14.31% | |
| 2011 | +34.74% | +2.46% | |
| 2012 | +43.45% | +17.09% | |
| 2013 | -11.12% | +27.77% | |
| 2014 | +17.59% | +14.50% | |
| 2015 | -10.96% | -0.12% | |
| 2016 | +44.39% | +14.45% | |
| 2017 | +3.42% | +21.64% | |
| 2018 | -9.42% | -5.15% | |
| 2019 | -1.94% | +32.31% | |
| 2020 | -8.99% | +15.64% | COVID, SA lockdowns |
| 2021 | +17.70% | +31.26% | |
| 2022 | -0.48% | -18.99% | Near-flat while US fell |
| 2023 | -2.27% | +26.00% | |
| 2024 | +24.61% | +25.28% | |
| 2025 | +3.67% | +6.76% | YTD |
Key Observations
2008 is the defining result. -8.48% vs SPY's -34.31%. South Africa's value universe, once you filter for low P/E, high ROE, and low leverage, skews toward domestic consumer businesses, retailers, and financial services companies. Mining and commodity companies, the ones most correlated with global risk-off events, tend to carry higher leverage and often trade above a P/E of 20 during boom cycles. The value filters naturally exclude them.
2022 tells the same story. SPY fell -18.99%. The JNB portfolio lost just -0.48%. The portfolio's 0.458 beta means it consistently moves less than global markets. Over the full period, only 1.65% of global downside passed through.
Recent years have been flat. 2019 through 2023 saw four negative or near-zero years. Loadshedding (rolling power blackouts), political uncertainty, and Rand weakness weighed on domestic businesses. The 2024 rebound (+24.61%) coincided with improved power stability and the formation of a coalition government. The strategy can't protect against sustained local macro headwinds.
Limitations
Returns are in ZAR. The Rand depreciated heavily against the US dollar over this period. International investors would see lower returns after currency conversion. The 11.61% CAGR is a ZAR figure.
Cross-currency benchmark. SPY is used as benchmark because FMP lacks JSE All Share index data. The ZAR-denominated returns vs USD-denominated SPY is an imperfect comparison. The low down capture partly reflects currency divergence during crises.
Thin universe. Average of 25.4 stocks per period (target is 30). 9 cash periods. South Africa's exchange is smaller than the US, India, or European markets. Fewer qualifying stocks means higher concentration risk.
SA macro risk. The quality of South African economic policy matters more here than in diversified markets. Loadshedding, governance challenges, and currency weakness directly impact the domestic companies that populate this portfolio.
Takeaway
Value-momentum on JNB produced the best drawdown profile of any exchange we tested. 11.61% CAGR with a max drawdown of just -28.44%. The 1.65% down capture means this portfolio essentially ignores global selloffs. If you're building a multi-exchange allocation and want a position that holds its value in crises, South Africa's value universe has a structural argument.
The recent macro softness (2019-2023), currency risk, and cross-currency benchmark limitation are real concerns. This works best as part of a global portfolio, not a standalone allocation.
Part of a Series
Data: Ceta Research. FMP financial data warehouse, 2000-2025.


