
Value-Momentum: Combining Cheap Stocks and Price Trends on 25 Years of US Data
We combined value (low P/E) and momentum (12-month price trend) into a composite screen and backtested it on all US exchanges from 2000 to 2025. Value-Momentum returned 11.32% annually vs 7.77% for the S&P 500.

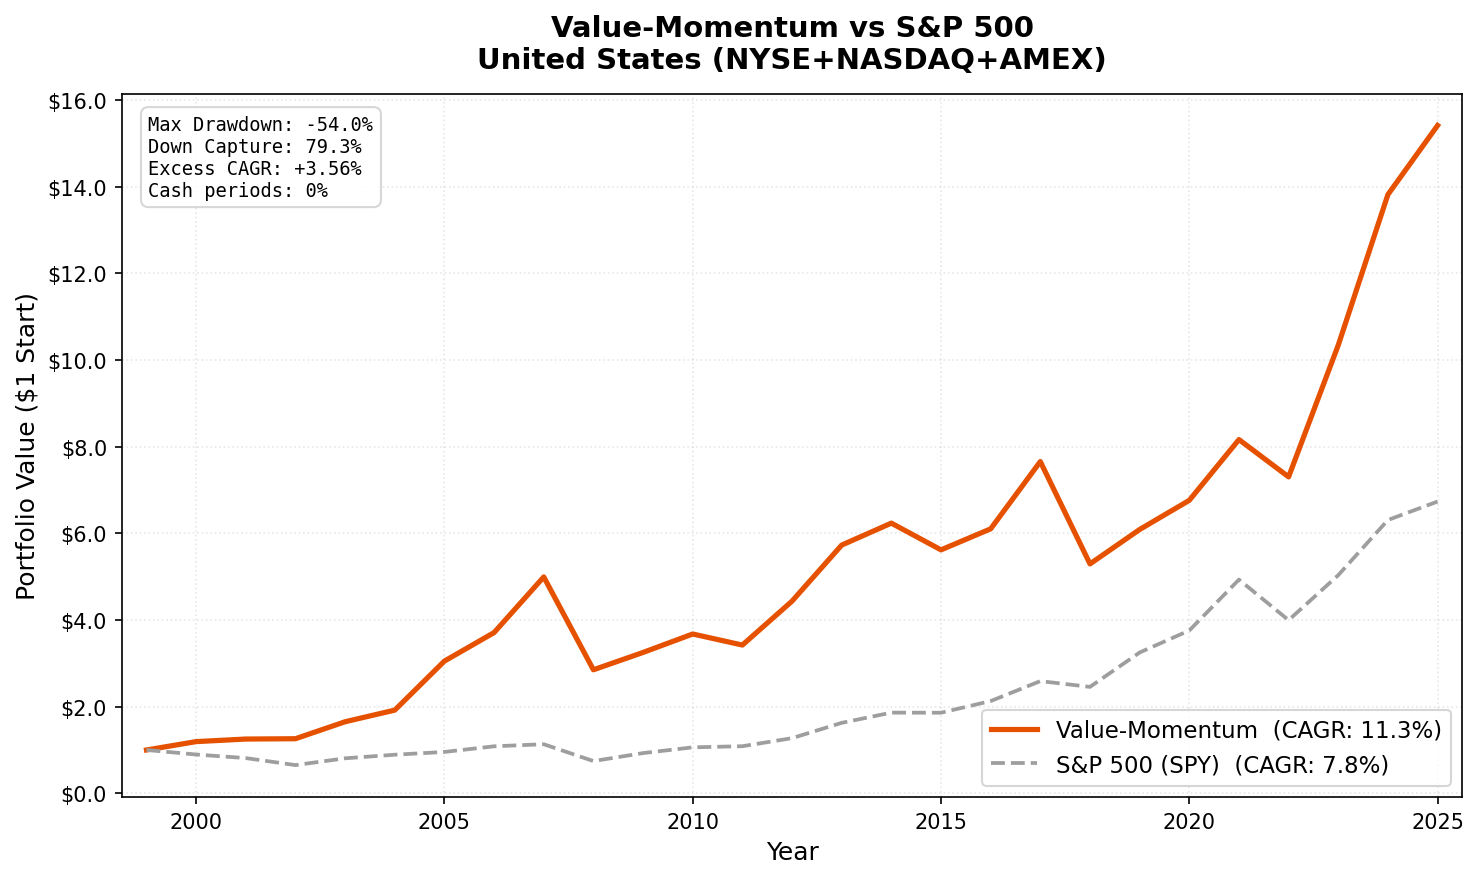
We combined two of the oldest factors in finance, value and momentum, into a single composite screen and backtested it on all US exchanges from 2000 to 2025. Value-Momentum returned 11.32% annually vs 7.77% for the S&P 500, a 3.56% annual excess return with zero cash periods across 51 rebalance cycles.
Contents
- Method
- What is Value-Momentum?
- The Screen
- Value-Momentum Screen (SQL)
- What We Found
- 25 years of data. 3.6% annual excess return over the S&P 500.
- Year-by-year returns
- The golden era: 2000-2007
- The financial crisis: 2008
- The struggle: 2018-2021
- The recovery: 2022-2025
- Backtest Methodology
- Limitations
- Takeaway
- Part of a Series
- References
- Run This Screen Yourself
Data: FMP financial data warehouse, 2000–2025. Updated May 2026.
Method
Data source: Ceta Research (FMP financial data warehouse) Universe: All US exchanges (NYSE, NASDAQ, AMEX), market cap > $1B USD Period: 2000-2025 (25 years, 51 semi-annual periods) Rebalancing: Semi-annual (January, July), equal weight, top 30 by composite rank Benchmark: S&P 500 Total Return (SPY) Cash rule: Hold cash if fewer than 10 stocks qualify
12-month momentum computed with a 1-month skip to avoid short-term reversal. Financial data lagged 45 days to prevent look-ahead bias. Transaction costs are size-tiered (0.1-0.5% one-way based on market cap). Entry uses next-day close (MOC execution model).
What is Value-Momentum?
The academic foundation comes from Asness, Moskowitz, and Pedersen (2013), who showed that value and momentum factors are negatively correlated across asset classes and geographies. When value stocks underperform, momentum stocks tend to pick up the slack, and vice versa. Combining them creates a natural hedge that neither factor offers alone.
Our screen works in three steps.
Step 1: Value Filter
| Criterion | Metric | Threshold |
|---|---|---|
| Cheap earnings | P/E Ratio | Between 0 and 20 |
| Capital efficiency | Return on Equity | > 10% |
| Balance sheet safety | Debt-to-Equity | < 1.0 |
| Institutional grade | Market Cap | > $1B USD |
Step 2: Momentum Signal
12-month price return with a 1-month skip. The skip avoids the well-documented short-term reversal effect. Stocks that have been rising for a year (but not just the last month) tend to keep rising.
Step 3: Composite Ranking
Every stock that passes the value filter gets two percentile scores: one for P/E (ascending, cheaper is better) and one for 12-month momentum (descending, higher is better). We average those two percentile ranks and take the top 30.
The result is a portfolio of cheap, profitable, low-leverage companies with strong recent price trends.
The Screen
Value-Momentum Screen (SQL)
SELECT
    k.symbol,
    p.companyName,
    f.priceToEarningsRatioTTM as pe_ratio,
    k.returnOnEquityTTM * 100 as roe_pct,
    f.debtToEquityRatioTTM as debt_to_equity,
    k.marketCap / 1e9 as market_cap_billions
FROM key_metrics_ttm k
JOIN financial_ratios_ttm f ON k.symbol = f.symbol
JOIN profile p ON k.symbol = p.symbol
WHERE f.priceToEarningsRatioTTM > 0
    AND f.priceToEarningsRatioTTM < 20
    AND k.returnOnEquityTTM > 0.10
    AND f.debtToEquityRatioTTM >= 0
    AND f.debtToEquityRatioTTM < 1.0
    AND k.marketCap > 1e9
    AND p.exchange IN ('NYSE', 'NASDAQ', 'AMEX')
ORDER BY f.priceToEarningsRatioTTM ASC
LIMIT 100
Run this query on Ceta Research
This gives you the value-filtered universe. The full backtest adds 12-month momentum ranking and selects the top 30 by composite score.
What We Found

25 years of data. 3.6% annual excess return over the S&P 500.
| Metric | Value-Momentum (US) | S&P 500 |
|---|---|---|
| CAGR | 11.32% | 7.77% |
| Total Return | 1441% | 573% |
| Volatility | 21.4% | 15.3% |
| Max Drawdown | -53.95% | -38.01% |
| Sharpe Ratio | 0.436 | 0.376 |
| Sortino Ratio | 0.707 | 0.633 |
| Calmar Ratio | 0.210 | 0.204 |
| Beta | 0.96 | 1.00 |
| Alpha (annualized) | 3.81% | - |
| Up Capture | 126.4% | - |
| Down Capture | 79.4% | - |
| Win Rate (semi-annual) | 52.9% | - |
| Avg Stocks per Period | 29.6 | - |
| Cash Periods | 0 of 51 | - |
Value-Momentum turned $10,000 into roughly $154,000. The S&P 500 turned it into $67,000. The strategy was fully invested every period, averaging 29.6 stocks per rebalance.
The alpha story is clear: 3.81% annualized alpha with a beta of 0.96. The down capture ratio of 79.4% means the portfolio absorbed about 79% of the market's losses during down periods, while the up capture of 126.4% grabbed more than the full upside during rallies. That asymmetry is the core value proposition.
The tradeoff is volatility. At 21.4% vs 15.3% for the S&P 500, this portfolio swings harder. The max drawdown of -53.95% during the financial crisis was deeper than the benchmark's -38.01%. This is a concentrated 30-stock portfolio of value names with momentum tilt. When both factors sell off together, the damage is real.
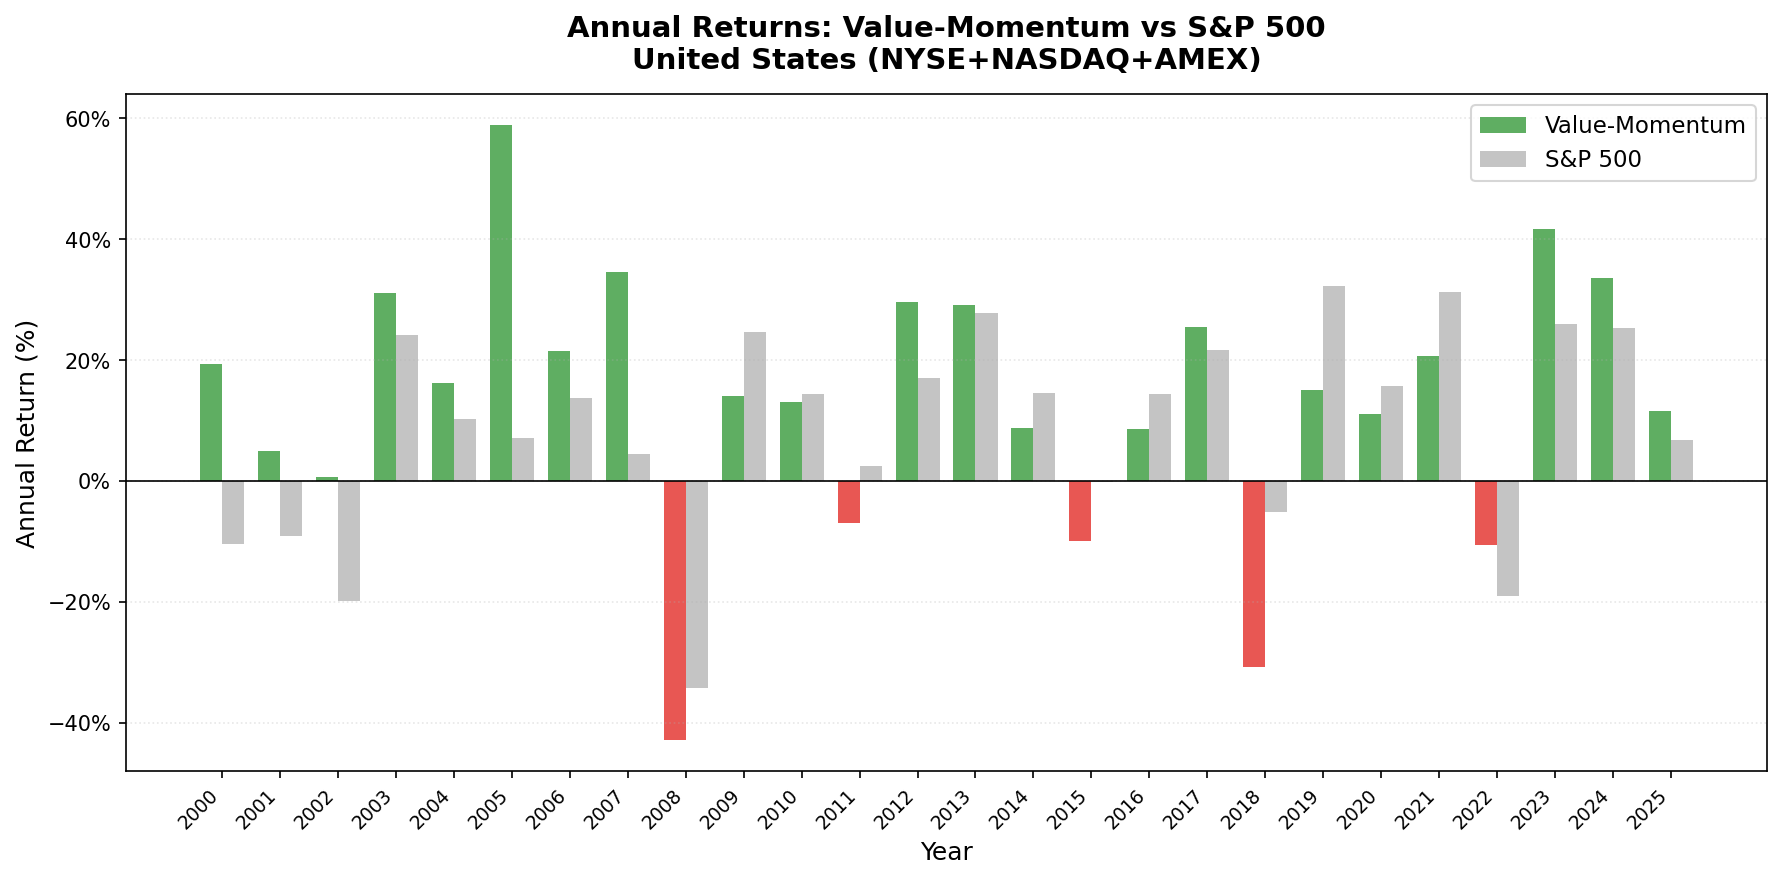
Year-by-year returns
| Year | Value-Momentum | S&P 500 | Excess |
|---|---|---|---|
| 2000 | +19.30% | -10.50% | +29.80% |
| 2001 | +4.96% | -9.17% | +14.12% |
| 2002 | +0.61% | -19.92% | +20.53% |
| 2003 | +31.09% | +24.12% | +6.97% |
| 2004 | +16.24% | +10.24% | +6.01% |
| 2005 | +58.95% | +7.17% | +51.78% |
| 2006 | +21.56% | +13.65% | +7.92% |
| 2007 | +34.61% | +4.40% | +30.21% |
| 2008 | -42.91% | -34.31% | -8.60% |
| 2009 | +14.03% | +24.73% | -10.71% |
| 2010 | +13.10% | +14.31% | -1.20% |
| 2011 | -6.94% | +2.46% | -9.40% |
| 2012 | +29.62% | +17.09% | +12.53% |
| 2013 | +29.17% | +27.77% | +1.39% |
| 2014 | +8.84% | +14.50% | -5.65% |
| 2015 | -9.89% | -0.12% | -9.77% |
| 2016 | +8.63% | +14.45% | -5.82% |
| 2017 | +25.44% | +21.64% | +3.80% |
| 2018 | -30.85% | -5.15% | -25.70% |
| 2019 | +15.00% | +32.31% | -17.32% |
| 2020 | +11.06% | +15.64% | -4.58% |
| 2021 | +20.74% | +31.26% | -10.52% |
| 2022 | -10.55% | -18.99% | +8.44% |
| 2023 | +41.64% | +26.00% | +15.64% |
| 2024 | +33.59% | +25.28% | +8.31% |
| 2025 | +11.54% | +6.76% | +4.79% |
The golden era: 2000-2007
The first eight years of the backtest were spectacular. The value filter kept bubble-era tech stocks out of the portfolio entirely. Companies trading at P/E ratios above 20 never entered the screen. Meanwhile, the momentum component selected the strongest trending names among the value-filtered universe.
| Year | Value-Momentum | S&P 500 | Excess |
|---|---|---|---|
| 2000 | +19.30% | -10.50% | +29.80% |
| 2001 | +4.96% | -9.17% | +14.12% |
| 2002 | +0.61% | -19.92% | +20.53% |
While the S&P 500 lost a cumulative 35% during the dot-com bust, Value-Momentum returned a cumulative +25%. The P/E cap was the key filter: it excluded stocks trading at triple-digit multiples. The momentum overlay then picked the best performers among the survivors.
2005 stands out: +58.95% vs +7.17% for the S&P 500. That 51.78% excess return in a single year is the largest annual gap in the entire backtest. Value stocks with strong momentum crushed it during the mid-2000s bull market. 2007 was another banner year at +34.61%, outpacing SPY by 30.21%.
The financial crisis: 2008
2008 was painful. The portfolio lost 42.91% vs the S&P 500's -34.31%. This is the one crisis where Value-Momentum didn't protect capital. The concentrated 30-stock portfolio amplified the damage compared to the broad-market index. Value and momentum factors both sold off together during the liquidity panic, which is exactly what Asness et al. warned about: in a leverage unwind, factor correlations spike toward 1.0.
The recovery was slower too. 2009 returned +14.03% vs SPY's +24.73%. The screen selected value names that bounced less aggressively than the growth stocks that led the initial recovery.
The struggle: 2018-2021
| Year | Value-Momentum | S&P 500 | Excess |
|---|---|---|---|
| 2018 | -30.85% | -5.15% | -25.70% |
| 2019 | +15.00% | +32.31% | -17.32% |
| 2020 | +11.06% | +15.64% | -4.58% |
| 2021 | +20.74% | +31.26% | -10.52% |
This was the worst stretch in the backtest. 2018 was the single worst year: -30.85% vs SPY's -5.15%. Small and mid-cap value stocks with fading momentum got crushed during the Q4 2018 sell-off. The P/E and market cap filters created a portfolio exposed to exactly the companies that were hit hardest.
2019-2021 wasn't much better. The strategy kept lagging by double digits in 2019 and single digits in 2020-2021. The cause: megacap growth stocks (FAANG, NVIDIA, Tesla) drove the bulk of S&P 500 returns. These companies had P/E ratios well above 20 and never entered the screen. The down capture ratio of 79.4% shows the strategy did absorb more downside than ideal, and missing the biggest rallies in a handful of tech names was the dominant factor.
The recovery: 2022-2025
| Year | Value-Momentum | S&P 500 | Excess |
|---|---|---|---|
| 2022 | -10.55% | -18.99% | +8.44% |
| 2023 | +41.64% | +26.00% | +15.64% |
| 2024 | +33.59% | +25.28% | +8.31% |
| 2025 | +11.54% | +6.76% | +4.79% |
The rotation back to value started in 2022, and Value-Momentum caught it. The composite screen delivered +41.64% in 2023 and +33.59% in 2024, beating the S&P 500 in both years. Rising interest rates punished long-duration growth stocks and rewarded the kind of profitable, low-leverage, reasonably-priced companies that populate this portfolio.
The strategy has now outperformed in four consecutive years. Whether that streak continues depends on rate policy and whether the value rotation holds. But the recent results show the screen still works when market conditions favor its factors.
Backtest Methodology
| Parameter | Choice |
|---|---|
| Universe | NYSE + NASDAQ + AMEX, Market Cap > $1B USD |
| Value Signal | P/E 0-20, ROE > 10%, D/E < 1.0 |
| Momentum Signal | 12-month price return, 1-month skip |
| Composite Rank | avg(P/E percentile ASC + momentum percentile DESC) |
| Portfolio | Top 30 by composite rank, equal weight |
| Rebalancing | Semi-annual (January, July) |
| Cash rule | Hold cash if < 10 qualify |
| Transaction Costs | Size-tiered: 0.1-0.5% one-way |
| Benchmark | S&P 500 Total Return (SPY) |
| Period | 2000-2025 (25 years, 51 periods) |
| Data | Point-in-time (45-day lag for financial statements) |
Limitations
Higher drawdown than the benchmark. The max drawdown of -53.95% is much deeper than the S&P 500's -38.01%. A 30-stock concentrated portfolio will always swing harder than a 500-stock index. Investors need to stomach larger losses during crises.
2018 crash risk. The worst year saw -30.85% vs SPY's -5.15%. When small/mid-cap value stocks with fading momentum sell off, the damage can be severe. This is the strategy's tail risk.
Value trap exposure. Stocks with low P/E ratios and positive 12-month momentum can still be value traps. The ROE and D/E filters reduce this risk but don't eliminate it. A stock can look cheap and trending up right until it falls off a cliff.
Momentum whipsaws. The 12-month lookback with 1-month skip is standard but not immune to whipsaws. Sudden trend reversals between rebalance dates can leave the portfolio holding stocks that have already started declining.
Win rate just above 50%. The semi-annual win rate is 52.9%. The strategy wins slightly more than half the time, and wins bigger when it wins. This requires psychological discipline to hold through losing stretches.
Survivorship bias. Exchange membership uses current profiles, not historical. IPOs and delistings aren't tracked over time.
Takeaway
Value-Momentum on US stocks delivered 11.32% CAGR over 25 years, 3.56% above the S&P 500. The academic insight holds up in practice: combining value and momentum creates a better portfolio than either factor alone. The negative correlation between the two factors smooths out the return stream, even if it doesn't eliminate drawdowns.
The strategy's weakness is concentration risk. Thirty stocks is enough to diversify idiosyncratic risk but not enough to avoid factor-level drawdowns. 2008 and 2018 both showed what happens when the factors turn against you simultaneously.
The recent four-year run (2022-2025) of consistent outperformance is encouraging, but the 2018-2021 stretch is a reminder that patience is required. This is a strategy that rewards investors who can hold through the bad years. Over 25 years, the math worked.
Part of a Series
This analysis is part of our Value-Momentum global exchange comparison. We tested the same composite screen on multiple markets worldwide: - Value-Momentum on Indian Stocks (BSE + NSE) - Value-Momentum on South African Stocks (JNB) - Value-Momentum on Swedish Stocks (STO) - Value-Momentum on Hong Kong Stocks (HKSE) - Value-Momentum on Canadian Stocks (TSX) - Value-Momentum on German Stocks (XETRA) - Value-Momentum: Global Exchange Comparison
References
- Asness, C., Moskowitz, T. & Pedersen, L. (2013). "Value and Momentum Everywhere." Journal of Finance, 68(3), 929-985.
- Jegadeesh, N. & Titman, S. (1993). "Returns to Buying Winners and Selling Losers: Implications for Stock Market Efficiency." Journal of Finance, 48(1), 65-91.
- Fama, E. & French, K. (1992). "The Cross-Section of Expected Stock Returns." Journal of Finance, 47(2), 427-465.
Run This Screen Yourself
Via web UI: Run the Value-Momentum screen on Ceta Research. The query is pre-loaded. Hit "Run" and see what passes today.
Via Python:
import requests, time

API_KEY = "your_api_key"  # get one at cetaresearch.com
BASE = "https://tradingstudio.finance/api/v1"

# Submit the Value-Momentum value filter query
resp = requests.post(f"{BASE}/data-explorer/execute", headers={
    "X-API-Key": API_KEY, "Content-Type": "application/json"
}, json={
    "query": """
        SELECT
            k.symbol,
            p.companyName,
            f.priceToEarningsRatioTTM as pe_ratio,
            k.returnOnEquityTTM * 100 as roe_pct,
            f.debtToEquityRatioTTM as debt_to_equity,
            k.marketCap / 1e9 as market_cap_billions
        FROM key_metrics_ttm k
        JOIN financial_ratios_ttm f ON k.symbol = f.symbol
        JOIN profile p ON k.symbol = p.symbol
        WHERE f.priceToEarningsRatioTTM > 0
            AND f.priceToEarningsRatioTTM < 20
            AND k.returnOnEquityTTM > 0.10
            AND f.debtToEquityRatioTTM >= 0
            AND f.debtToEquityRatioTTM < 1.0
            AND k.marketCap > 1e9
            AND p.exchange IN ('NYSE', 'NASDAQ', 'AMEX')
        ORDER BY f.priceToEarningsRatioTTM ASC
        LIMIT 100
    """,
    "options": {"format": "json", "limit": 100}
})
task_id = resp.json()["taskId"]

# Poll until complete
while True:
    result = requests.get(f"{BASE}/tasks/data-query/{task_id}",
                          headers={"X-API-Key": API_KEY}).json()
    if result["status"] in ("completed", "failed"):
        break
    time.sleep(2)

for r in result["result"]["rows"][:10]:
    print(f"{r['symbol']:8s} P/E={r['pe_ratio']:.1f} ROE={r['roe_pct']:.1f}% D/E={r['debt_to_equity']:.2f}")
Get your API key at cetaresearch.com. The full backtest code (Python + DuckDB) is on GitHub.
Data: Ceta Research, FMP financial data warehouse. Universe: NYSE + NASDAQ + AMEX. Semi-annual rebalance, equal weight, 2000-2025.
Past performance does not guarantee future results. This is research content, not investment advice.


