Beat Streaks in Japan: Strongest Immediate Reaction Globally (+0.90% T+1)
Japan shows the highest T+1 abnormal return of any exchange globally. 5,461 events on JPX from 2009-2025. Streak 3 reaches +2.35% at T+63. The pattern is consistent with Japan's concentrated analyst coverage and slower information diffusion.

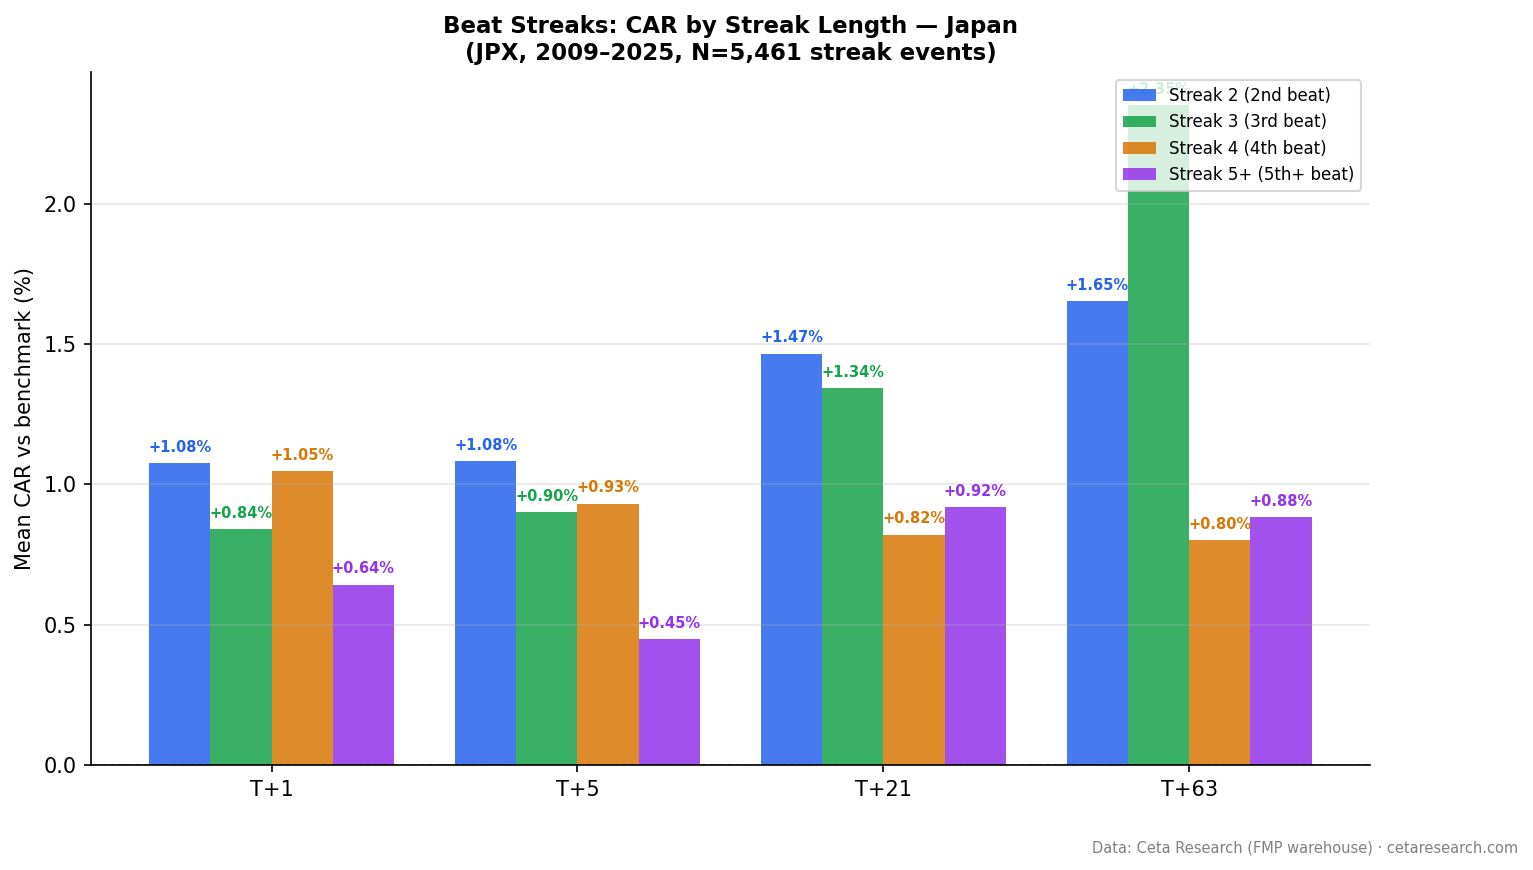
Japanese stocks show the largest single-day response to streak-extending earnings beats of any exchange in this study. We measured 5,461 streak events on JPX (Tokyo, Osaka, Nagoya) from 2009 to 2025 and found +0.90% T+1, +1.21% T+21, and +1.47% T+63 cumulative abnormal return. The drift keeps building for three months. The streak 3 category specifically reaches +2.35% at T+63, the highest 63-day return of any streak category across all exchanges.
Contents
Method
Universe: JPX-listed stocks (Tokyo, Osaka, Nagoya exchanges) with market cap above JPY 100B (approximately USD 650M). We required at least two consecutive quarters of EPS beats. Data sourced from FMP's earnings surprises endpoint, 2009–2025.
Beat definition: epsActual > epsEstimated where ABS(epsEstimated) > 0.01. The floor filters near-zero estimates.
Windows: CAR measured at T+1, T+21, and T+63 trading days after each streak-extending announcement.
Benchmark: EWJ (iShares MSCI Japan ETF). CAR = stock return minus EWJ return over each window.
Coverage note: Japan data starts in 2009 due to FMP coverage. The 16-year history is shorter than US (25 years) and Canada (25 years) but still produces strong statistical significance.
Total events: 5,461
What We Found
The immediate reaction (+0.90% T+1) is the highest of any exchange in this study. Japan's market structure appears to react more sharply to streak-extending beats on the day of announcement, then continues drifting for months.
The T+63 drift of +1.47% is 4.7x the US equivalent (+0.31%). Where US 63-day drift has been compressed by arbitrage, Japan's remains strong. This is consistent with slower information dissemination in Japanese markets: lower short interest, less active options market around earnings, and fewer quant funds running PEAD strategies specifically on JPX names.
| Window | Mean CAR | t-stat | N |
|---|---|---|---|
| T+1 | +0.90% | 13.22 | 5,461 |
| T+21 | +1.21% | 9.85 | ~5,440 |
| T+63 | +1.47% | 7.46 | ~5,400 |
All three windows are statistically significant. The t-stat at T+63 (7.46) is lower than T+1 (13.22), but that's expected as cumulative return variance grows over longer windows. 7.46 is comfortably above any standard threshold.
Streak Length Breakdown
The streak 3 category is the standout. A third consecutive beat in Japan produces +2.35% T+63 CAR, the highest value of any streak-length combination across all exchanges in this study. Streak 2 also performs well at T+63 (+1.65%), and both streak 2 and streak 3 show strong T+21 returns.
| Streak | N | T+1 | T+21 | T+63 |
|---|---|---|---|---|
| Streak 2 | 1,979 | +1.08% | +1.47% | +1.65% |
| Streak 3 | 1,222 | +0.84% | +1.34% | +2.35% |
| Streak 4 | 741 | +1.05% | +0.82% | +0.80% |
| Streak 5+ | 1,450 | +0.64% | +0.92% | +0.88% |
Streak 4 shows the same anomalous dip seen in Canadian data: strong T+1 (+1.05%) but weak T+21 (+0.82%) and T+63 (+0.80%). Streak 5+ recovers partially but at lower levels than streak 2 or 3.
The T+63 trajectory for streak 3 deserves attention. The +2.35% return over 63 trading days (roughly a quarter) after a third consecutive beat is the strongest drift signal in this entire cross-market study. Japan's market under-prices the third consecutive beat more severely than any other streak category globally.
The SQL Screen
This query finds JPX stocks currently on a beat streak of 3 or more consecutive quarters. The market cap filter uses a USD equivalent (~JPY 100B at current rates). For FMP data, Japanese tickers use a .T suffix (e.g., 7203.T for Toyota):
WITH ordered_earnings AS (
    SELECT symbol,
        CAST(date AS DATE) AS event_date,
        epsActual AS actual,
        epsEstimated AS estimated,
        CASE WHEN epsActual > epsEstimated THEN 1 ELSE 0 END AS is_beat,
        ROUND((epsActual - epsEstimated) / ABS(NULLIF(epsEstimated, 0)) * 100, 1) AS surprise_pct,
        ROW_NUMBER() OVER (PARTITION BY symbol ORDER BY date DESC) AS recency_rank
    FROM earnings_surprises
    WHERE epsEstimated IS NOT NULL
      AND ABS(epsEstimated) > 0.01
      AND epsActual IS NOT NULL
),
streak_calc AS (
    SELECT *, SUM(CASE WHEN is_beat = 0 THEN 1 ELSE 0 END)
        OVER (PARTITION BY symbol ORDER BY recency_rank
              ROWS UNBOUNDED PRECEDING) AS streak_breaker
    FROM ordered_earnings
),
streaks AS (
    SELECT symbol,
        COUNT(*) AS current_streak,
        ROUND(AVG(surprise_pct), 1) AS avg_surprise_pct,
        MIN(event_date) AS streak_start,
        MAX(event_date) AS latest_beat
    FROM streak_calc
    WHERE streak_breaker = 0 AND is_beat = 1
    GROUP BY symbol
    HAVING COUNT(*) >= 3
)
SELECT s.symbol, s.current_streak, s.avg_surprise_pct,
    s.streak_start, s.latest_beat,
    ROUND(k.mktCapUSD / 1e9, 1) AS mktcap_bn
FROM streaks s
JOIN key_metrics k ON s.symbol = k.symbol AND k.period = 'TTM'
WHERE k.mktCapUSD > 500000000  -- ~JPY 75B, adjusted conservatively
QUALIFY ROW_NUMBER() OVER (PARTITION BY s.symbol ORDER BY k.date DESC) = 1
ORDER BY s.current_streak DESC, s.avg_surprise_pct DESC
LIMIT 30
Japanese reporting note: Some Japanese companies report semi-annually rather than quarterly, particularly smaller industrials and some financial firms. This affects streak frequency. A company on a "streak 4" in Japan may have a 2-year track record rather than the 1-year implied by quarterly reporting. When interpreting streak length for Japanese stocks, checking the reporting cadence of individual companies matters.
Run this screen live on Ceta Research → (pre-loaded query, no account required)
Why It Works
Japan is a well-documented case of slower-than-average analyst reaction to earnings information. Several structural factors contribute.
Analyst coverage concentration: Japanese brokerage research is dominated by domestic firms (Nomura, Daiwa, SMBC Nikko) with strong coverage of large caps and thin coverage of mid-caps. Foreign analyst coverage of smaller JPX names is limited. Fewer analysts per stock means slower consensus updating after each beat.
Lower short interest and options activity: The Japanese market has lower short interest as a percentage of float compared to the US. Active short sellers and options traders often accelerate PEAD arbitrage. Without this pressure, drift windows stay open longer.
Reporting and language barriers: Japanese earnings are reported in Japanese, and many companies don't provide English-language guidance calls. Foreign institutional investors lag domestic investors in processing the information. This creates a two-stage reaction: domestic first, foreign later, which extends the drift window.
Loh and Warachka (2012) documented under-reaction to streak information across markets. The Japanese data is consistent with their framework: each consecutive beat is treated as somewhat independent, and the cumulative probability signal embedded in a multi-quarter streak is systematically ignored.
Myers, Myers, and Skinner (2007) identified earnings management as a streak-sustaining mechanism. Japanese corporate governance has historically emphasized stability, and companies have strong incentives to show consistent improvement. This cultural pressure on consistent performance may produce streaks that are more genuinely fundamental than in the US, making them more predictive at longer horizons.
Limitations
Coverage starts 2009: The 16-year history is shorter than some other markets. The 2009 starting point means the global financial crisis recovery period is included, which may affect baseline returns.
EWJ as benchmark: EWJ tracks large-cap Japanese equities and is dominated by exporters. If beat-streak stocks skew toward domestic consumption or financials, EWJ may not capture the relevant sector exposure. Yen movements versus USD also affect EWJ returns in ways that don't apply to domestic JPX stocks.
Semi-annual reporters: Some Japanese companies don't report quarterly. Including them in a streak study based on quarterly beats could misrepresent the true streak length. The FMP data doesn't always flag reporting frequency explicitly.
Market cap floor in USD: The JPY 100B threshold was translated to USD 500–650M depending on exchange rate. USDJPY volatility means this filter isn't as stable as a yen-denominated threshold would be.
Smaller subcategories: Streak 4 (741 events) and streak 3 (1,222 events) have fewer observations than the US equivalents. The streak 3 T+63 result (+2.35%) is striking, but it rests on ~1,200 events. That's enough to be statistically significant, but replication risk is higher than in the US data.
Takeaway
Japan shows the strongest immediate reaction to beat-streak announcements globally (+0.90% T+1) and the most persistent post-announcement drift at streak 3 (+2.35% T+63). The market under-prices the third consecutive beat in Japan more severely than anywhere else in this study.
Structural factors, including lower analyst coverage per stock, limited foreign language earnings access, and reduced arbitrage pressure from short sellers and options traders, create conditions where PEAD persists much longer than in the US.
For investors screening JPX, streak 2 and streak 3 are the strongest entry points. Streak 4 shows anomalous weakness consistent with the Canada pattern. The T+63 drift being stronger than T+21 suggests the full drift hasn't resolved even by the three-month mark, which is unusual and indicates a particularly slow information absorption rate in this market.
Part of a series: Beat streaks analyzed across 16 exchanges. See US, Canada, Taiwan, India, Brazil, and the global comparison.
Data: FMP earnings surprises + key metrics, 2009–2025. JPX (Tokyo, Osaka, Nagoya). Market cap > JPY 100B (~USD 650M). 5,461 streak events. Benchmark: EWJ.