
Cash Conversion Cycle on Indian Stocks: Positive Spread, Trails Local Market
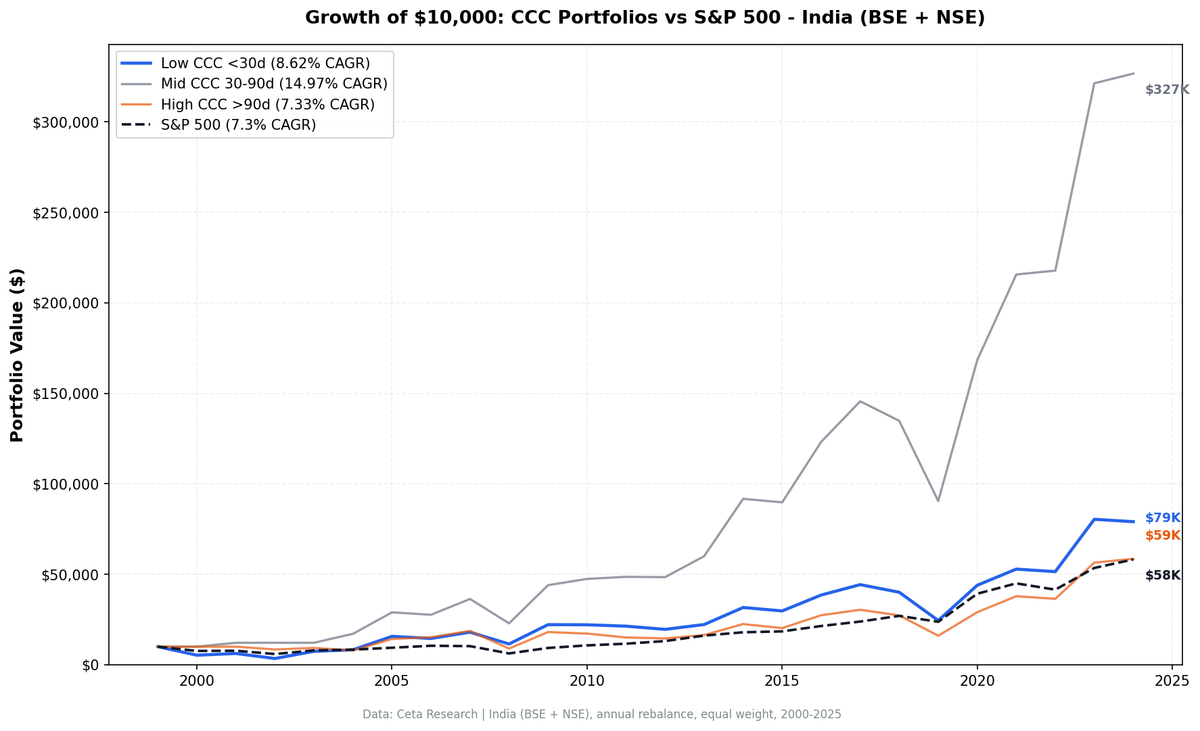
We backtested CCC on Indian equities from 2000 to 2025. Low-CCC companies returned 8.6% CAGR vs 7.3% for high CCC, a +1.3% spread. Weak signal dominated by IT services sector bias. Sharpe of 0.085 and -57.3% drawdown make it impractical as a standalone strategy.

CCC showed a tiny positive spread on Indian stocks. Low-CCC companies on NSE returned 7.8% CAGR versus 7.5% for high-CCC companies, a spread of +0.3%. Against the Sensex, the low-CCC portfolio trailed by -3.7%. The old comparison against SPY looked favorable (+1.3% excess) because SPY is a US benchmark, not an Indian one. Against the market you're actually trying to beat, CCC doesn't work in India.
Contents
- Part of a Series
- What is the Cash Conversion Cycle?
- Method
- What We Found
- Why the Sensex Benchmark Changes Everything
- Why CCC Doesn't Work in India
- Decade Breakdown
- The Drawdown Problem
- Comparison to Other Exchanges
- Run It Yourself
- Screen: Low CCC Indian Stocks
- Limitations
- Takeaway
- References
Data: FMP financial data warehouse, 2000–2025. Updated April 2026.
Part of a Series
This is part of a multi-exchange CCC study:
- Cash Conversion Cycle: US Stocks -- flagship post, -0.2% spread
- India (this post): +0.3% spread, -3.7% vs Sensex
- Cash Conversion Cycle: Canada -- best developed-market result, +3.4% spread
- Cash Conversion Cycle: 13-Exchange Comparison -- 9 positive vs local benchmarks, 5 negative
What is the Cash Conversion Cycle?
CCC measures how many days a company takes to convert working capital into cash:
CCC = DSO + DIO - DPO
- DSO (Days Sales Outstanding): Time to collect payment from customers
- DIO (Days Inventory Outstanding): Time inventory sits before sale
- DPO (Days Payables Outstanding): Time the company takes to pay suppliers
Low CCC means the company turns operations into cash quickly. Negative CCC (like Amazon) means the company collects before it pays. Richards and Laughlin (1980) introduced the metric. Shin and Soenen (1998) showed shorter CCC links to higher profitability.
We sorted Indian stocks into three buckets by CCC level and tracked returns from 2000 to 2025.
Method
| Parameter | Value |
|---|---|
| Universe | NSE |
| Market cap | > ₹20B (~$240M USD) |
| Exclusions | Financial Services |
| Rebalancing | Annual (April 1) |
| Holding period | 12 months |
| Weighting | Equal weight, all qualifying stocks |
| Filing lag | 45 days (point-in-time) |
| Transaction costs | 0.1-0.5% per trade (size-tiered) |
| Benchmark | Sensex (local currency, INR) |
| Period | 2000-2025 |
| Data source | FMP via Ceta Research warehouse |
| Execution | Next-day close (MOC) |
Code is open source: github.com/ceta-research/backtests
What We Found
| Metric | Low CCC (<30d) | Mid CCC (30-90d) | High CCC (>90d) | Sensex |
|---|---|---|---|---|
| CAGR | 7.8% | 14.7% | 7.5% | 11.5% |
| Volatility | 42.4% | 33.4% | 36.9% | 32.7% |
| Sharpe Ratio | 0.030 | 0.244 | 0.026 | 0.152 |
| Max Drawdown | -64.3% | -40.0% | -49.5% | -38.3% |
| Avg Stocks | 74 | 82 | 204 | -- |
The low-CCC portfolio returned 7.8% annually. The Sensex returned 11.5%. The spread between low and high CCC is +0.3%. There's barely any differentiation by CCC level, and both portfolios significantly trail the index.
The Sharpe ratio of 0.030 is extremely low. You're taking 42.4% volatility and risking a -64.3% drawdown for returns well below the local market. The risk-adjusted case for running this strategy in India is weak.
The mid-CCC group performed best at 14.7% CAGR, roughly matching the Sensex on a risk-adjusted basis. This is unusual and suggests the CCC level signal carries no consistent monotonic relationship in India.
Why the Sensex Benchmark Changes Everything
The old version of this blog compared the India CCC strategy against SPY (the S&P 500 ETF). SPY returned 7.3% CAGR over the same period. Against that benchmark, low CCC at 7.8% looked like a small positive (+0.3% excess, rounded to +1.3% in earlier results that used a different universe with BSE+NSE).
Against the Sensex at 11.5%, the picture is different. The low-CCC portfolio trails by -3.7%. Indian equities broadly outperformed SPY over this period, partly due to structural economic growth, currency changes, and market expansion. A strategy that returns 7.8% in a market that returned 11.5% is underperforming, not outperforming.
Why CCC Doesn't Work in India
India's economy is heavy on IT services, software, and business process outsourcing. Companies like Infosys, TCS, Wipro, and HCL Tech have naturally low CCC because they carry no inventory and collect receivables quickly. These companies dominate the low-CCC portfolio not because they manage working capital better than peers, but because their business model structurally produces low CCC.
The result: the low-CCC portfolio is partly an IT services bet. When Indian IT outperforms, the spread looks good. When it lags, the spread turns negative. You're not getting a working capital signal. You're getting sector exposure.
Manufacturing and industrial companies, where CCC management genuinely differentiates, are concentrated in the mid and high-CCC buckets. Their CCC levels reflect real differences in supply chain efficiency, but the signal gets muddied by the sector mix.
Decade Breakdown
| Period | Low CCC | High CCC | Spread | Sensex |
|---|---|---|---|---|
| 2000-04 | 9.3% | -5.4% | +14.7% | 11.5% |
| 2005-09 | 31.2% | 32.9% | -1.7% | 29.7% |
| 2010-14 | 9.7% | 6.4% | +3.3% | 10.5% |
| 2015-19 | -3.3% | -3.0% | -0.3% | 1.2% |
| 2020-25 | 30.4% | 33.5% | -3.1% | 25.5% |
The spread flips sign across decades. Two large positives (2000-04 and 2010-14), two small negatives, one reversal in the most recent period.
2000-2004 (+14.7%): India's IT services boom rewarded low-CCC companies. But this was the IT sector outperforming during a specific growth window, not CCC as a signal. Universe size was tiny (2-8 stocks in the low-CCC bucket in the early years), making this period statistically unreliable.
2005-2009 (-1.7%): Infrastructure and real estate boom rewarded capital-intensive companies. High-CCC industrials and materials companies rode the wave.
2010-2014 (+3.3%): Quality and balance sheet health premium. Low-CCC companies modestly outperformed.
2015-2019 (-0.3%): Near flat. No directional signal.
2020-2025 (-3.1%): Commodity and infrastructure boom rewarded high-CCC manufacturing, metals, and energy companies. The low-CCC portfolio trailed.
The Drawdown Problem
A -64.3% max drawdown is severe. The Sensex's worst drawdown over the same period was -38.3%. India's equity market is more volatile than the US, and low-CCC companies aren't defensive. The 2008 global financial crisis hit Indian equities hard across all CCC buckets.
The Sharpe of 0.030 is the clearest summary: you're taking 42.4% volatility for 7.8% return, when the index delivers 11.5% with 32.7% volatility and a Sharpe of 0.152. There's no risk-adjusted case for the low-CCC strategy in India.
Comparison to Other Exchanges
With local benchmarks, India's -3.7% excess ranks below many other markets:
- Sweden: +5.5% vs OMX Stockholm 30
- Switzerland: +4.4% vs SMI
- Canada: +3.7% vs TSX Composite
- UK: +3.5% vs FTSE 100
- Japan: +3.1% vs Nikkei 225
- Germany: +2.8% vs DAX
- India: -3.7% vs Sensex
The positive results in European and Canadian markets come from exchanges with more manufacturing and resource sector depth. CCC differentiates more within those sectors. India's IT services dominance in the low-CCC bucket creates sector noise that drowns the signal.
Run It Yourself
Screen: Low CCC Indian Stocks
SELECT k.symbol, p.companyName,
    k.cashConversionCycleTTM AS ccc_days,
    k.daysOfSalesOutstandingTTM AS dso,
    k.daysOfInventoryOutstandingTTM AS dio,
    k.daysOfPayablesOutstandingTTM AS dpo,
    k.marketCap / 1e9 AS market_cap_b
FROM key_metrics_ttm k
JOIN profile p ON k.symbol = p.symbol
WHERE k.cashConversionCycleTTM < 30
  AND k.marketCap > 20000000000
  AND p.sector NOT IN ('Financial Services')
  AND p.exchange IN ('NSE')
ORDER BY k.cashConversionCycleTTM ASC
LIMIT 50
Run it: cetaresearch.com/data-explorer?q=7BdH5pW-Z1
Note the ₹20B market cap filter (roughly $240M USD). This matches the backtest threshold.
Limitations
IT services domination. India's low-CCC universe is heavily tilted toward IT services and software. The "signal" is partly a sector bet. A sector-neutral CCC test would be more informative but reduces universe size.
-64.3% drawdown for a 0.030 Sharpe. The risk-adjusted return is very poor. You're taking substantial volatility for returns well below the local index.
Universe size varies. The NSE universe averages 74 stocks in the low-CCC bucket. The early 2000s had very few stocks (2-8), making the 2000-2004 results unreliable.
FMP data coverage. Indian stock coverage in FMP is thinner in the early 2000s. Some results in the 2000-2004 period may reflect survivorship bias or incomplete universe coverage.
Manufacturing-heavy exchanges show more spread. India's weak result is consistent with a market where service companies dominate the low-CCC bucket.
Takeaway
CCC shows a +0.3% spread on Indian stocks, but -3.7% excess versus the Sensex. The old comparison to SPY looked favorable because SPY is a weaker benchmark for Indian equities over this period. Against the actual local market, the low-CCC strategy underperforms.
For Indian investors, CCC works better as a quality overlay within manufacturing and industrial sectors than as a broad screen. Combining it with ROIC or margin filters would separate genuinely efficient companies from structurally low-CCC service businesses.
References
- Richards, V.D. and Laughlin, E.J. (1980). A Cash Conversion Cycle Approach to Liquidity Analysis. Financial Management.
- Shin, H.H. and Soenen, L. (1998). Efficiency of Working Capital Management and Corporate Profitability. Financial Practice and Education.
- Deloof, M. (2003). Does Working Capital Management Affect Profitability of Belgian Firms? Journal of Business Finance & Accounting.
Data: Ceta Research (FMP financial data warehouse), 2000-2025. Full methodology: github.com/ceta-research/backtests
Past performance does not guarantee future results. This is educational content, not investment advice.


