
Compounding Equity Screen Canada: +2.07% Annual Alpha Over TSX Composite
We backtested the Compounding Equity Screen on TSX stocks from 2000 to 2025. 6.02% CAGR vs 3.95% for the TSX Composite, a +2.07% annual excess. Strong outperformance in the first decade and in recovery years (2009, 2010, 2020), with a severe 2008 drawdown of -40.6%.

We backtested the Compounding Equity Screen on TSX stocks from 2000 to 2025. The portfolio returned 6.02% annually vs 3.95% for the TSX Composite. That +2.07% annual excess puts Canada solidly in outperforming territory when measured against its local benchmark.
Contents
- Method
- Signal and Filters
- Results
- The First Decade: Strong Signal
- The 2008 Problem
- Post-2008 Pattern
- Full Annual Returns
- The Screen
- Limitations
- Takeaway
The story has two distinct halves. The first decade was strong. 2000-2007 showed the equity compounding signal working largely as expected: the 2000 dot-com year was a cash period, then strong outperformance in 2001 and continued advantage through the mid-2000s commodity boom. Then 2008 arrived and hit TSX equity compounders hard: -40.6% in a single year, the full max drawdown in one period.
Data: FMP financial data warehouse, 2000-2025. Updated July 2026.
Method
Data source: Ceta Research (FMP financial data warehouse) Universe: Toronto Stock Exchange (TSX), market cap > CAD 500M Period: 2000-2025 (25 annual rebalance periods, 1 cash) Rebalancing: Annual (July), equal weight top 30 by highest equity CAGR Benchmark: TSX Composite (^GSPTSE), returns in CAD Cash rule: Hold cash if fewer than 10 stocks qualify Transaction costs: Size-tiered model adapted for TSX costs
Financial data uses a 45-day lag from the rebalance date for point-in-time correctness. Full methodology: backtests/METHODOLOGY.md
Signal and Filters
| Criterion | Metric | Threshold | Why |
|---|---|---|---|
| Value creation | Shareholders' equity CAGR (5yr) | > 10% | Core compounding signal |
| Quality overlay | Return on Equity (TTM) | > 8% | Growth from operations |
| Quality overlay | Operating Profit Margin (TTM) | > 8% | Pricing power confirmed |
| Liquidity | Market Cap | > CAD 500M | Investable universe |
Results
| Metric | Portfolio | TSX Composite |
|---|---|---|
| CAGR | 6.02% | 3.95% |
| Total Return | 331.14% | -- |
| Max Drawdown | -40.6% | -- |
| Volatility | 22.2% | -- |
| Sharpe Ratio | 0.158 | -- |
| Down Capture | 119.41% | -- |
| Up Capture | 146.79% | -- |
| Win Rate (vs TSX) | 56% | -- |
| Cash Periods | 1/25 | -- |
| Avg Stocks | 22.5 | -- |
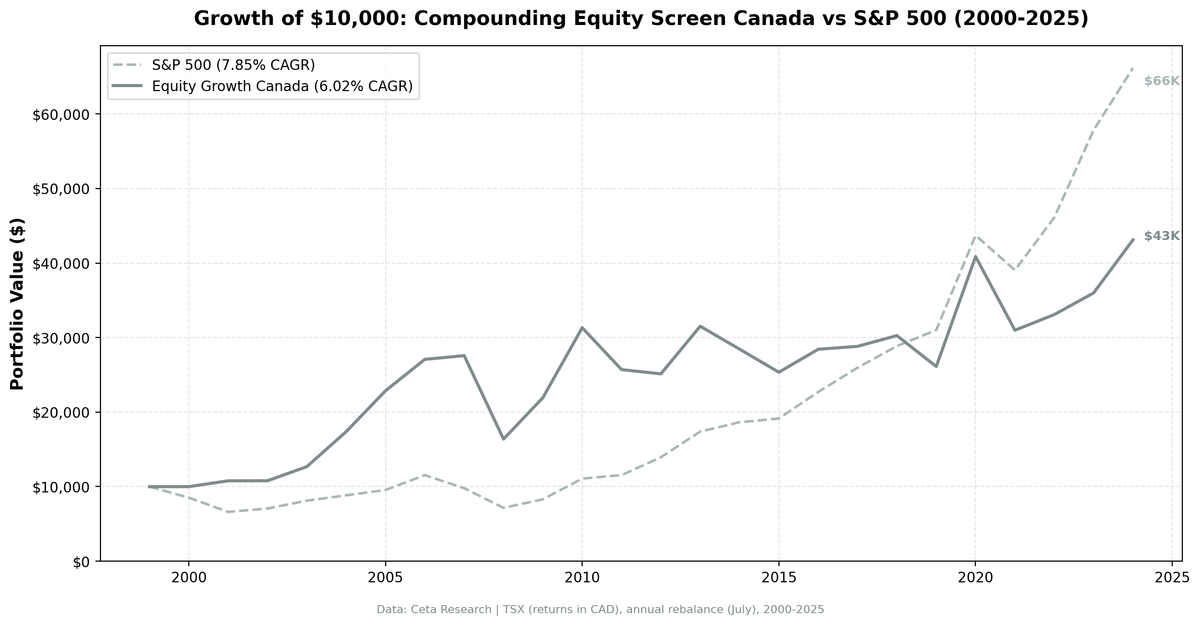
$10,000 invested in July 2000 grew to approximately $43,100. The strategy outperformed the TSX Composite by +2.07% annually over the 25-year period.
The First Decade: Strong Signal
Canada 2000-2007 showed what equity compounding can do in a resource-heavy market during the right macro environment.
Dot-Com Crash (2000-2001):
| Year | Portfolio | TSX Composite | Excess |
|---|---|---|---|
| 2000 | 0.00% (cash) | -24.12% | +24.12% |
| 2001 | +7.81% | -9.35% | +17.16% |
In 2000 the screen found too few qualifying names, so the portfolio held cash while the TSX Composite fell 24%. By 2001, a portfolio of energy producers, financial services, and industrials that had been compounding book value for five years gained 7.8% while the index kept falling. No speculative tech exposure meant these businesses kept growing book value while the dot-com bubble unwound.
Commodity Boom (2004-2007):
| Year | Portfolio | TSX Composite | Excess |
|---|---|---|---|
| 2004 | +37.04% | +17.14% | +19.90% |
| 2005 | +31.58% | +18.02% | +13.56% |
| 2007 | +1.84% | -0.22% | +2.06% |
Canadian equity compounders rode the commodity supercycle. Energy companies and materials producers had been compounding equity at 10%+ through the 2000s as oil and commodity prices rose. The signal captured this cycle at its best.
The 2008 Problem
The same commodity concentration that drove outperformance through 2007 created the 2008 collapse:
| Year | Portfolio | TSX Composite | Excess |
|---|---|---|---|
| 2008 | -40.61% | -26.99% | -13.62% |
When commodity prices collapsed in H2 2008, TSX equity compounders took a full hit. The companies that had been growing book value most rapidly through the commodity boom were now the most exposed to the price reversal. A -40.6% single-year return is the full max drawdown. It happened in one period.
The signal did its job: it selected companies with 5 years of strong equity growth and high ROE/OPM. But the ROE and margin thresholds were calibrated to the commodity cycle peak. When the cycle turned, those thresholds couldn't filter out the coming deterioration fast enough with annual rebalancing.
Post-2008 Pattern
The portfolio recovered and tracked the TSX reasonably well through the 2010s, with several strong outperformance years:
| Year | Portfolio | TSX Composite | Excess |
|---|---|---|---|
| 2009 | +33.89% | +9.27% | +24.62% |
| 2010 | +42.84% | +19.56% | +23.28% |
| 2013 | +25.42% | +24.89% | +0.53% |
| 2020 | +56.50% | +29.47% | +27.03% |
| 2024 | +19.80% | +22.39% | -2.59% |
Notably, 2020 showed +56.50% vs +29.47% for the TSX, a large outperformance during the post-COVID recovery. 2009 and 2010 were also standout years: both posted 20%+ excess returns as the strategy's quality holdings recovered faster than the commodity-heavy index. The recent data is more mixed; 2024 was slightly below the TSX.
Weak periods:
| Year | Portfolio | TSX Composite | Excess |
|---|---|---|---|
| 2011 | -17.94% | -11.49% | -6.45% |
| 2012 | -2.22% | +2.78% | -5.00% |
| 2019 | -13.71% | -5.15% | -8.56% |
| 2021 | -24.19% | -5.92% | -18.27% |
2021 stands out: -24.19% while the TSX fell only -5.92% (July 2021 to July 2022 includes the rate hike period). Canadian equity compounders were hit harder than the benchmark during the rate-rise environment, suggesting meaningful interest-rate sensitivity, likely from financial sector concentration.
Full Annual Returns
| Year | Portfolio | TSX Composite | Excess |
|---|---|---|---|
| 2000 | 0.00% (cash) | -24.12% | +24.12% |
| 2001 | +7.81% | -9.35% | +17.16% |
| 2002 | +0.07% | -0.33% | +0.40% |
| 2003 | +17.53% | +21.42% | -3.89% |
| 2004 | +37.04% | +17.14% | +19.90% |
| 2005 | +31.58% | +18.02% | +13.56% |
| 2006 | +18.43% | +19.87% | -1.44% |
| 2007 | +1.84% | -0.22% | +2.06% |
| 2008 | -40.61% | -26.99% | -13.62% |
| 2009 | +33.89% | +9.27% | +24.62% |
| 2010 | +42.84% | +19.56% | +23.28% |
| 2011 | -17.94% | -11.49% | -6.45% |
| 2012 | -2.22% | +2.78% | -5.00% |
| 2013 | +25.42% | +24.89% | +0.53% |
| 2014 | -9.75% | -3.76% | -5.99% |
| 2015 | -10.89% | -2.59% | -8.30% |
| 2016 | +12.17% | +6.11% | +6.06% |
| 2017 | +1.37% | +7.49% | -6.12% |
| 2018 | +5.00% | +1.28% | +3.72% |
| 2019 | -13.71% | -5.15% | -8.56% |
| 2020 | +56.50% | +29.47% | +27.03% |
| 2021 | -24.19% | -5.92% | -18.27% |
| 2022 | +6.77% | +6.18% | +0.59% |
| 2023 | +8.79% | +8.66% | +0.13% |
| 2024 | +19.80% | +22.39% | -2.59% |
The Screen
Run this screen live on Ceta Research →
-- (Same SQL as UK screen but filtered to TSX and CAD 500M market cap)
  AND k.marketCap > 500000000
  AND p.exchange = 'TSX'
Limitations
Commodity cycle concentration. TSX equity compounders during commodity booms skew heavily toward energy and materials. The 5-year equity CAGR signal will select these companies at peak earnings, creating concentration right before cycle reversals. Annual rebalancing can't react fast enough.
CAD/USD effects. Returns are in CAD. The Canadian dollar tracked USD closely until 2008, then diverged. Currency effects add meaningful volatility for non-CAD investors.
High drawdown. -40.6% max drawdown is severe for a strategy premised on quality and compounding. The crisis hit harder than the benchmark.
Takeaway
Canada delivered 6.02% CAGR vs 3.95% for the TSX Composite, a +2.07% annual excess over 25 years. The strategy worked well in the first decade (2000-2007), capturing the quality advantage during the dot-com bust and commodity boom. The 2008 collapse was severe: -40.6% in a single year, 13.62% worse than the benchmark.
The post-2008 record is mixed. 2009, 2010, and 2020 were standout years with 20%+ excess returns. But 2011, 2012, 2019, and 2021 saw meaningful underperformance. The commodity-heavy market structure creates cyclical boom-bust distortions that the annual rebalancing can't escape. The overall +2.07% excess is real, but it came with a rough ride. If you run this screen in Canada, watch for commodity cycle exposure in the qualifying list.
Data: Ceta Research (FMP financial data warehouse), 2000-2025. Universe: Toronto Stock Exchange (TSX). Returns in CAD. Full methodology: METHODOLOGY.md. Past performance does not guarantee future results. This is educational content, not investment advice.


