Compounding Equity Screen US: Why Equity Growth Doesn't Beat the

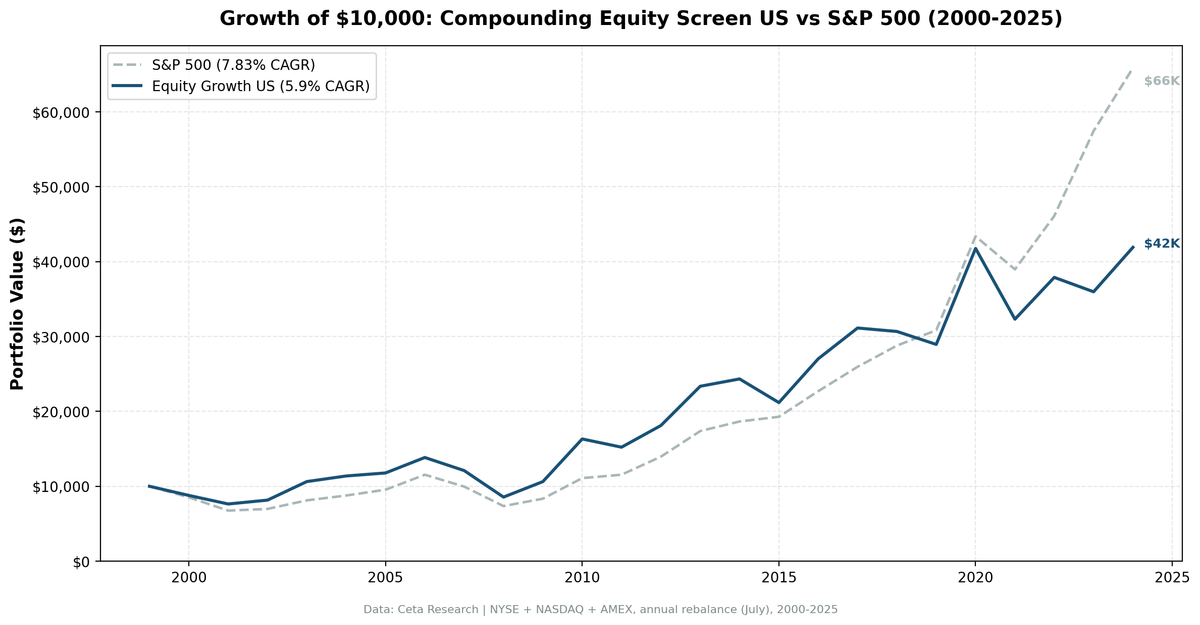
We ran the Compounding Equity Screen on all US exchanges (NYSE, NASDAQ, AMEX) from 2000 to 2025. The portfolio returned 5.90% annually vs 7.83% for the S&P 500. $10,000 grew to $41,900 vs $65,900 for the benchmark. The strategy underperforms by 1.93% annually.
Contents
- Method
- The Signal
- What Research Shows
- The Screen
- Advanced Screen (SQL)
- Results
- Where It Works
- Where It Fails. The Real Story
- Full Annual Returns
- Why This Happens in the US
- Limitations
- Run It Yourself
- Backtest
- Takeaway
- References
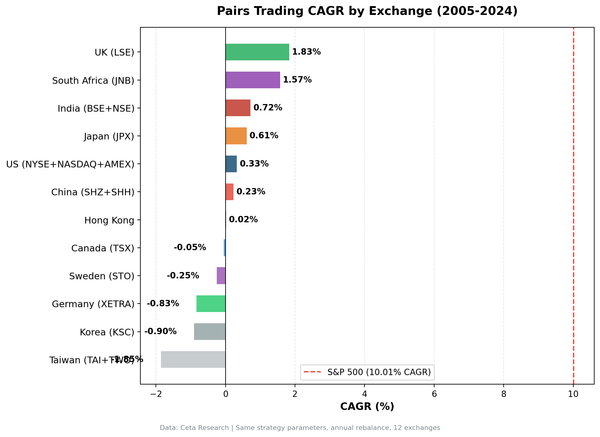
This is the honest result. We're publishing it because understanding why a signal fails somewhere tells you as much as understanding why it works. The equity compounding signal is real, it's the strongest performer in our 14-country test for the UK. But in US markets, it doesn't overcome the structural gravity of mega-cap tech concentration. The data shows exactly where and why.
Method
- Data source: Ceta Research (FMP financial data warehouse)
- Universe: All US exchanges (NYSE, NASDAQ, AMEX), market cap > $1B
- Period: 2000-2025 (25 annual rebalance periods)
- Rebalancing: Annual (July), equal weight top 30 by highest equity CAGR
- Benchmark: S&P 500 Total Return (SPY)
- Cash rule: Hold cash if fewer than 10 stocks qualify
- Transaction costs: Size-tiered model (0.1% mega-cap, 0.3% large-cap, 0.5% mid-cap)
- Data quality guards: Entry price > $1, single-period return capped at 200%
Financial data uses a 45-day lag from the rebalance date for point-in-time correctness. Full methodology: backtests/METHODOLOGY.md
The Signal
Shareholders' equity grows when retained earnings exceed distributions. Consistent 10%+ equity CAGR over five years requires the company to earn above its cost of capital and reinvest the proceeds. The signal identifies companies that have been doing this without interruption.
Filters:
| Criterion | Metric | Threshold | Why |
|---|---|---|---|
| Value creation | Shareholders' equity CAGR (5yr) | > 10% | Core compounding signal |
| Quality overlay | Return on Equity (TTM) | > 8% | Growth from operations |
| Quality overlay | Operating Profit Margin (TTM) | > 8% | Pricing power confirmed |
| Liquidity | Market Cap | > $1B | Liquid, investable stocks |
Ranking: Top 30 by equity CAGR descending, equal weight.
What Research Shows
Warren Buffett used book value per share CAGR as his primary measure of Berkshire's intrinsic value growth. The sustainable growth rate formula (ROE × retention ratio) formalizes why: a company earning 15% ROE and retaining 80% of earnings grows book value at 12% annually without any external funding. Five consecutive years of 10%+ equity CAGR is strong evidence that a business has this property.
Asness, Frazzini and Pedersen (2019) show that equity growth is a quality signal with predictive power for future returns globally. Cooper, Gulen and Schill (2008) found related evidence in asset growth. The signal has academic support. It just doesn't translate as cleanly to US markets as it does elsewhere.
The Screen
Advanced Screen (SQL)
WITH curr_eq AS (
 SELECT symbol, totalStockholdersEquity AS eq_curr, dateEpoch AS epoch_curr,
 ROW_NUMBER() OVER (PARTITION BY symbol ORDER BY dateEpoch DESC) AS rn
 FROM balance_sheet
 WHERE period = 'FY' AND totalStockholdersEquity > 0
),
prior_5yr AS (
 SELECT c.symbol,
 b.totalStockholdersEquity AS eq_prior,
 (c.epoch_curr - b.dateEpoch) / 31536000.0 AS years_gap,
 POWER(
 c.eq_curr / b.totalStockholdersEquity,
 1.0 / ((c.epoch_curr - b.dateEpoch) / 31536000.0)
 ) - 1 AS eq_cagr,
 ROW_NUMBER() OVER (
 PARTITION BY c.symbol
 ORDER BY ABS((c.epoch_curr - b.dateEpoch) / 31536000.0 - 5) ASC
 ) AS best_match
 FROM curr_eq c
 JOIN balance_sheet b ON c.symbol = b.symbol AND c.rn = 1
 AND b.period = 'FY' AND b.totalStockholdersEquity > 0
 AND b.dateEpoch < c.epoch_curr - 4 * 31536000
 AND b.dateEpoch > c.epoch_curr - 7 * 31536000
)
SELECT pr.symbol, p.companyName, p.sector,
 ROUND(pr.eq_cagr * 100, 2) AS eq_cagr_pct,
 ROUND(pr.years_gap, 1) AS years_measured,
 ROUND(k.returnOnEquityTTM * 100, 2) AS roe_pct,
 ROUND(f.operatingProfitMarginTTM * 100, 2) AS opm_pct,
 ROUND(k.marketCap / 1e9, 2) AS mktcap_b
FROM prior_5yr pr
JOIN profile p ON pr.symbol = p.symbol
JOIN key_metrics_ttm k ON pr.symbol = k.symbol
JOIN financial_ratios_ttm f ON pr.symbol = f.symbol
WHERE pr.best_match = 1 AND pr.years_gap BETWEEN 3.5 AND 7.0
 AND pr.eq_cagr > 0.10 AND pr.eq_cagr < 1.00
 AND k.returnOnEquityTTM > 0.08
 AND f.operatingProfitMarginTTM > 0.08
 AND k.marketCap > 1000000000
 AND p.exchange IN ('NYSE', 'NASDAQ', 'AMEX')
 AND p.isActivelyTrading = true
ORDER BY pr.eq_cagr DESC
LIMIT 30
Results
| Metric | Portfolio | S&P 500 |
|---|---|---|
| CAGR | 5.90% | 7.83% |
| Total Return | 319% | 559% |
| Max Drawdown | -38.2% | -36.3% |
| Volatility | 20.6% | 16.2% |
| Sharpe Ratio | 0.190 | 0.360 |
| Sortino Ratio | 0.379 | 0.654 |
| Down Capture | 104.9% | -- |
| Up Capture | 91.0% | -- |
| Win Rate (vs SPY) | 48% | -- |
| Cash Periods | 0/25 | -- |
| Avg Stocks | 26.8 | -- |
The numbers are clear: the portfolio underperforms with more volatility and slightly worse maximum drawdown. The down capture of 104.9% means it loses slightly more than the benchmark during bad years. Win rate of 48% means less than half of years beat SPY.
Where It Works
The strategy isn't uniformly bad. It had strong periods, particularly in the first decade.
2000-2001 (Dot-Com Bust): The only early period with reasonable crisis protection.
| Year | Portfolio | S&P 500 | Excess |
|---|---|---|---|
| 2000 | -12.2% | -14.8% | +2.6% |
| 2001 | -13.0% | -20.8% | +7.7% |
Relative protection during the tech bust, though both directions were down.
2003 and 2010 (Post-Crash Recovery):
| Year | Portfolio | S&P 500 | Excess |
|---|---|---|---|
| 2003 | +30.4% | +16.4% | +14.0% |
| 2009 | +24.1% | +13.4% | +10.7% |
| 2010 | +53.6% | +32.9% | +20.7% |
| 2013 | +29.0% | +24.5% | +4.5% |
The early-cycle recoveries favored quality compounders. 2010 was an outstanding year: +53.6% vs +32.9% for SPY.
Where It Fails. The Real Story
The failure pattern is concentrated in recent years and follows a specific dynamic: mega-cap tech concentration in SPY.
2018-2019:
| Year | Portfolio | S&P 500 | Excess |
|---|---|---|---|
| 2018 | -1.5% | +10.9% | -12.4% |
| 2019 | -5.6% | +7.1% | -12.8% |
2021 and 2023:
| Year | Portfolio | S&P 500 | Excess |
|---|---|---|---|
| 2021 | -22.6% | -10.2% | -12.4% |
| 2023 | -5.1% | +24.6% | -29.7% |
2023 is the starkest example. The portfolio returned -5.07% while SPY gained 24.6%. A -29.67% excess in a single year. This was the year AI enthusiasm drove Nvidia, Microsoft, Meta, and Alphabet to extraordinary returns. The S&P 500's gains were concentrated in seven stocks (the Magnificent Seven) that collectively drove most of the index's performance.
A portfolio of 30 equal-weighted equity compounders, predominantly mid-cap quality businesses in financial services, healthcare, industrials, and consumer sectors, couldn't compete with that concentration. The equity compounders were real businesses generating real returns. They just weren't in the right seven stocks.
2015:
| Year | Portfolio | S&P 500 | Excess |
|---|---|---|---|
| 2015 | -13.0% | +3.4% | -16.3% |
An outlier year where the portfolio underperformed while the market held flat. Energy and commodity names that had been compounding equity through the commodity supercycle entered the portfolio as their equity CAGRs peaked, then the commodity bust hit.
Full Annual Returns
| Year | Portfolio | S&P 500 | Excess |
|---|---|---|---|
| 2000 | -12.2% | -14.8% | +2.6% |
| 2001 | -13.0% | -20.8% | +7.7% |
| 2002 | +6.7% | +3.3% | +3.4% |
| 2003 | +30.4% | +16.4% | +14.0% |
| 2004 | +7.0% | +7.9% | -0.9% |
| 2005 | +3.5% | +8.9% | -5.3% |
| 2006 | +17.5% | +21.0% | -3.4% |
| 2007 | -12.6% | -13.7% | +1.1% |
| 2008 | -29.3% | -26.1% | -3.1% |
| 2009 | +24.1% | +13.4% | +10.7% |
| 2010 | +53.6% | +32.9% | +20.7% |
| 2011 | -6.7% | +4.1% | -10.8% |
| 2012 | +19.0% | +20.9% | -1.9% |
| 2013 | +29.0% | +24.5% | +4.5% |
| 2014 | +4.2% | +7.4% | -3.2% |
| 2015 | -13.0% | +3.4% | -16.3% |
| 2016 | +27.6% | +17.7% | +9.9% |
| 2017 | +15.2% | +14.3% | +0.9% |
| 2018 | -1.5% | +10.9% | -12.4% |
| 2019 | -5.6% | +7.1% | -12.8% |
| 2020 | +44.3% | +40.7% | +3.6% |
| 2021 | -22.6% | -10.2% | -12.4% |
| 2022 | +17.3% | +18.3% | -1.0% |
| 2023 | -5.1% | +24.6% | -29.7% |
| 2024 | +16.5% | +14.7% | +1.8% |
Note: Returns measured July-to-July (annual rebalance). SPY return differs from calendar-year SPY performance.
Why This Happens in the US
Three structural factors explain the underperformance:
1. Mega-cap tech concentration. The S&P 500 became increasingly concentrated in a handful of technology companies from 2018 onward. By 2023, the Magnificent Seven (Apple, Microsoft, Nvidia, Alphabet, Amazon, Meta, Tesla) represented ~30% of the index. Equal-weighted equity compounders don't hold this concentration. When seven stocks drive 70-80% of index gains, a diversified quality portfolio structurally can't keep pace.
2. The companies compounding equity fastest aren't the biggest return drivers. US equity compounders tend to be mid-cap industrials, financial services companies, and consumer businesses. Not the high-multiple tech names that drove SPY returns from 2018-2023. The signal selects quality businesses, not momentum leaders.
3. Share buybacks distort the signal. US companies returned record amounts of capital through buybacks from 2015-2023. Buybacks reduce equity (they shrink the denominator). Companies with aggressive buyback programs can have negative equity growth even while earnings and intrinsic value grow. This creates a selection bias: high-equity-CAGR US companies are specifically those that didn't buy back shares aggressively, which may exclude many of the highest-quality US names.
Limitations
Underperforms its own premise. The core argument for equity compounding is that it identifies companies building long-term value. In the US, those companies underperformed the index for the last decade. The signal may work again, the Magnificent Seven concentration in SPY is historically unusual, but that's speculative.
No sector tilt control. Equal-weighting 30 stocks without sector constraints means the portfolio can concentrate in sectors where equity CAGR is structurally high (financials, healthcare) and miss sectors where the index return is concentrated.
Annual rebalancing misses intra-year changes. Rebalancing once in July means holding positions through a full year of potential deterioration.
Part of a Series: UK | India | Screen Global | Germany | Canada
Run It Yourself
Run this screen live on Ceta Research →
Backtest
git clone https://github.com/ceta-research/backtests.git
cd backtests

# US backtest
python3 equity-growth/backtest.py --preset us --output results.json --verbose
Takeaway
The Compounding Equity Screen underperforms in US markets: 5.90% CAGR vs 7.83% for the S&P 500 over 25 years. This isn't a data artifact or a methodology flaw. It reflects a structural feature of US markets: the index became increasingly concentrated in technology companies that don't fit the "steady equity compounder" profile.
Equity compounding as a signal isn't broken. It works in the UK (the only outperformer in our 14-country test) and shows up in other markets with specific characteristics. In the US, the combination of mega-cap tech concentration in SPY and aggressive share buybacks among quality businesses makes the signal insufficient to overcome the index's structural drift.
The honest version of factor investing includes the ones that don't work in every market.
Run It Yourself
Explore the data behind this analysis on Ceta Research. Query our financial data warehouse with SQL, build custom screens, and run your own backtests across 70,000+ stocks on 20 exchanges.
Data: Ceta Research (FMP financial data warehouse), 2000-2025. Universe: NYSE + NASDAQ + AMEX. Full methodology: METHODOLOGY.md. Past performance doesn't guarantee future results. This is educational content, not investment advice.
References
- Asness, C., Frazzini, A. & Pedersen, L. (2019). "Quality Minus Junk." Review of Accounting Studies, 24(1), 34-112.
- Buffett, W. (1977-2023). Berkshire Hathaway Annual Letters.
- Gordon, M. & Shapiro, E. (1956). "Capital Equipment Analysis: The Required Rate of Profit." Management Science, 3(1), 102-110.
- Lakonishok, J., Shleifer, A. & Vishny, R. (1994). "Contrarian Investment, Extrapolation, and Risk." Journal of Finance, 49(5), 1541-1578.