
Defensive Quality Across 11 Markets: Where the Signal Works and Why
We ran the same defensive quality screen across 16 exchanges. India leads with 17.23% CAGR. UK delivers the best Sharpe (0.666). The US portfolio has a negative down capture (-9.5%) — it gains when markets fall. Eight markets showed positive performance. Three (Taiwan, Sweden, South Africa) had...

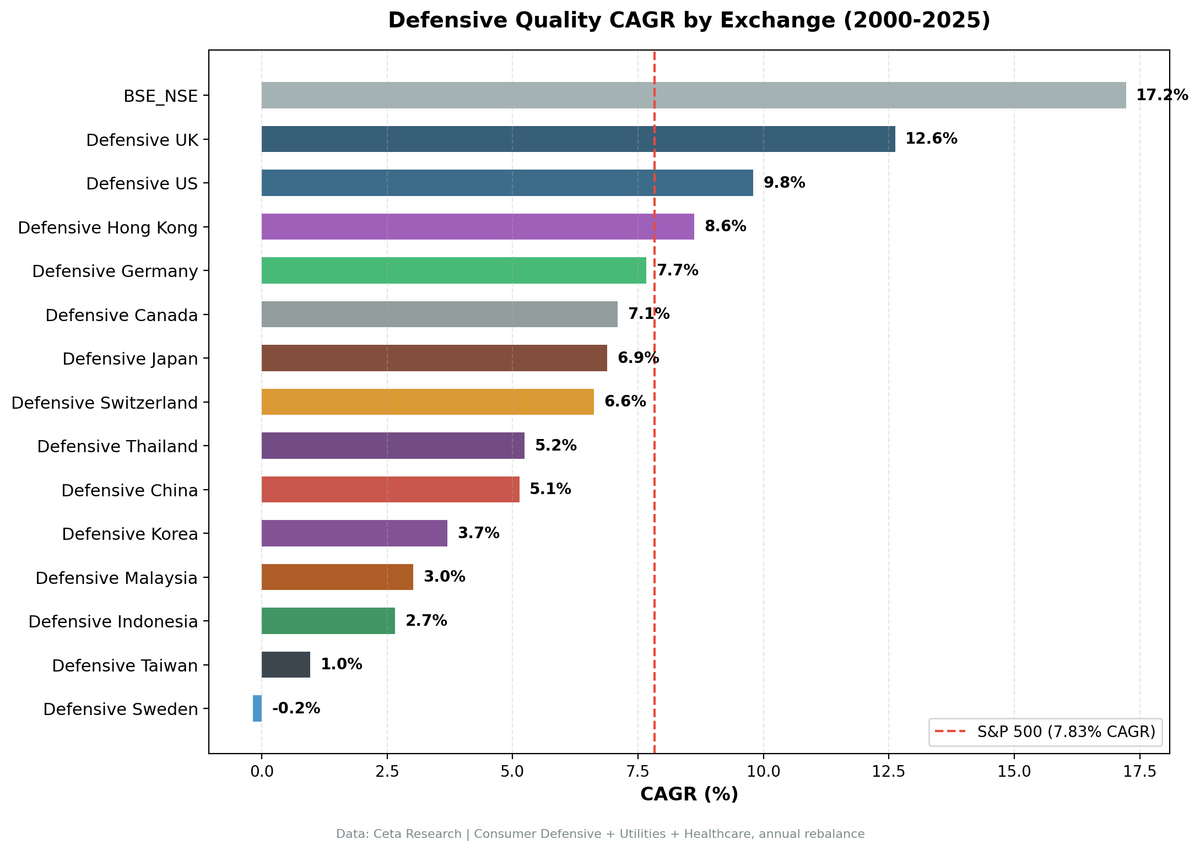
We ran the same defensive quality screen across 16 global exchanges from 2000 to 2024. The signal: quality stocks in Consumer Defensive, Utilities, and Healthcare sectors, ranked by dividend yield.
Contents
- Method
- The Results
- Markets with strong defensive quality performance
- Markets with modest or mixed results
- Markets excluded from content
- Why the Signal Varies by Market
- What's Consistent Across Markets
- Down capture is negative everywhere it works
- Quality filter does real work
- Cash rule is protective
- Comparison Table (Full)
- Limitations
- Takeaway
The results split into three clear groups. A set of markets where defensive quality compounds reliably with low drawdown (US, India, UK, Hong Kong). A second group where the strategy produces modest returns above the local benchmark (Japan, Canada, Germany, Switzerland, China). And markets where the defensive sector universe is too thin to produce investable results (Taiwan, Sweden, South Africa).
The main finding: defensive quality is not uniformly defensive across markets. Market structure, sector composition, and local dividend culture determine whether the signal works.
Data: FMP financial data warehouse, 2000–2025. Updated March 2026.
Method
Data source: Ceta Research (FMP financial data warehouse) Universe: 16 global exchanges, market cap thresholds in local currency Period: 2000–2024 (25 annual periods) Signal: Quality screen (ROE > 6%, OPM > 8%, D/E < 2.5, DivYield > 0.5%), ranked by dividend yield Sectors: Consumer Defensive, Utilities, Healthcare Benchmark: Local currency index per exchange (Sensex for India, FTSE 100 for UK, SPY for US). Cross-market comparison uses SPY as reference. Portfolio: Top 30 by dividend yield, equal weight. Cash if < 10 qualify.
Full methodology: backtests/METHODOLOGY.md
The Results
Markets with strong defensive quality performance
| Exchange | CAGR | Local Benchmark | Excess | Sharpe | Max DD | Cash | Avg Stocks |
|---|---|---|---|---|---|---|---|
| India (NSE) | 17.30% | Sensex 12.06% | +5.24% | 0.513 | -3.8% | 16% | 25.8 |
| UK (LSE) | 11.19% | FTSE 100 1.23%* | +9.96%* | 0.641 | -7.8% | 0% | 11.9 |
| US (NYSE+NASDAQ+AMEX) | 10.84% | SPY 7.85% | +2.99% | 0.712 | -18.0% | 0% | 24.1 |
| Hong Kong (HKSE) | 8.67% | Hang Seng 1.64% | +7.03%* | 0.289 | -22.3% | 12% | 21.0 |
*FTSE 100 and Hang Seng figures use price-only indices. The high excess vs these benchmarks partly reflects dividend income captured in the portfolio's adjusted-close prices but excluded from the price-only index.
India: best absolute returns, driven by pharma compounders and FMCG quality names. +5.24% annual excess vs Sensex over 21 invested years. The -3.81% max drawdown is the lowest in the study.
UK: Sharpe of 0.641 over 25 years with zero cash periods. Thin universe (11.9 stocks) concentrated in Unilever, AstraZeneca, GSK, regulated utilities. The FTSE 100 price index returned only 1.23% CAGR over this period, making the excess look large. The portfolio's absolute 11.19% CAGR is the meaningful figure.
US: best Sharpe in the study (0.712). Negative down capture (-10.3%): when SPY falls on average, this portfolio gains. Consistent defensive protection with strong absolute returns.
Hong Kong: Hang Seng price index was nearly flat over this period. Portfolio CAGR of 8.67% is the real measure. Higher drawdown (-22.3%) than UK or US, but positive alpha vs local market.
Markets with modest or mixed results
| Exchange | CAGR | Local Benchmark | Excess | Sharpe | Max DD | Cash | Avg Stocks |
|---|---|---|---|---|---|---|---|
| Canada (TSX) | 7.43% | TSX Comp 3.95% | +3.48% | 0.368 | -22.1% | 16% | — |
| Japan (JPX) | 7.39% | Nikkei 3.31% | +4.08% | 0.453 | -23.9% | 16% | — |
| Germany (XETRA) | 6.78% | DAX 5.04% | +1.74% | 0.362 | -35.4% | 0% | 21.8 |
| China (SHH) | 6.25% | SSE Comp 2.43% | +3.82% | 0.112 | -52.0% | 0% | — |
| Switzerland (SIX) | 5.45% | SMI 1.74% | +3.71% | 0.356 | -26.8% | 0% | — |
| Thailand (SET) | 4.99% | SET Index 5.13% | -0.14% | 0.167 | -26.0% | 24% | — |
Japan: +4.08% annual excess vs Nikkei over 25 years. Large qualifying universe but modest absolute CAGR (7.39%). Japan's defensive sector contains consumer goods exporters with yen-tied dynamics, but the quality filter produces real alpha vs the local index.
Canada: +3.48% vs TSX Composite. Similar to Japan — decent alpha vs local benchmark, modest absolute return.
Germany: +1.74% vs DAX. The strategy holds its own. Germany's defensive sector includes Henkel, Beiersdorf, and a handful of pharma names. Not standout alpha but not a failure.
China (SHH): +3.82% vs SSE Composite, but -52% max drawdown. The Shanghai bull market of 2006-2007 inflated then crashed these returns. The defensive sector doesn't behave defensively in A-share market dynamics. Alpha vs SSE is positive but the volatility story is unfavorable.
Switzerland: -26.8% max drawdown despite Nestle/Novartis/Roche dominating the universe. These globally dominant businesses compress dividend yields and underperform vs other high-quality defensive markets.
Korea: 3.86% CAGR with 44% cash periods and -1.49% excess vs KOSPI. The defensive sector universe is thin. High cash drag.
Malaysia: 2.90% CAGR, 32% cash, -4.95% vs SPY (no local benchmark available).
Indonesia: 2.81% CAGR, 44% cash, -5.04% vs SPY.
Markets excluded from content
Taiwan (TAI+TWO): 76% cash periods. The defensive sector universe in Taiwan is too small to run the strategy effectively for 19 of 25 periods.
Sweden (STO): 88% cash. Only 3 invested periods. The Swedish exchange doesn't have enough qualifying defensive stocks in this universe size filter.
South Africa (JNB): 100% cash. The JNB defensive sector universe historically never reached 10 qualifying stocks. Excluded from all content — not a data quality issue, just a genuinely thin universe for this strategy.
Why the Signal Varies by Market
Three factors drive the cross-market differences:
1. Sector composition varies more than sector labels suggest. "Consumer Defensive" in India means FMCG giants with decades of pricing power. "Consumer Defensive" in Germany includes Henkel (adhesives, household cleaners) and Beiersdorf (NIVEA) — quality businesses but with different competitive dynamics. The same quality filter applied to both produces very different underlying portfolios.
2. Dividend culture matters for ranking. The strategy ranks by dividend yield. In markets with strong dividend cultures (UK, India's quality tier, US utilities), the income signal is informative — high-yielding defensive companies are genuinely financially strong and undervalued by growth-focused investors. In markets with weak dividend cultures, the ranking becomes noisier.
3. Market structure affects "defensive" sector behavior. China's A-shares market has historically exhibited high retail participation and speculative dynamics. During bull markets, everything including defensive sectors inflates. During crashes, everything including defensive sectors falls hard. The sector label doesn't provide the same protection as in markets with more institutional participation.
What's Consistent Across Markets
Down capture is negative everywhere it works
| Exchange | Down Capture | Benchmark | Interpretation |
|---|---|---|---|
| India | -29.9% | vs Sensex | Gains when Sensex falls |
| UK | -45.1% | vs FTSE 100 | Gains strongly when FTSE 100 falls |
| US | -10.3% | vs SPY | Gains when SPY falls |
| Hong Kong | ~0% | vs Hang Seng | Near-flat when Hang Seng falls |
The negative down capture shows up consistently in the markets where the strategy works. When local equity markets fall, quality defensive stocks in mature markets gain in relative terms and often in absolute terms too.
Quality filter does real work
The ROE > 6%, OPM > 8%, D/E < 2.5 combination filters out yield traps — companies with high yields because they're financially distressed or because their stock price has fallen. Without quality filters, high-yield defensive screens tend to pick up financially weak utilities and consumer names that cut dividends in downturns.
Cash rule is protective
Periods with fewer than 10 qualifying stocks go to cash. This prevented the strategy from holding a handful of concentrated positions in thin markets (Korea, Taiwan, Malaysia during most periods). It also explains why high-cash markets (Taiwan 76%, Sweden 88%) underperform — the strategy correctly identified that those markets didn't have enough quality defensive stocks to invest.
Comparison Table (Full)
| Exchange | CAGR | Local Benchmark | Excess | Sharpe | Sortino | MaxDD | Cash% |
|---|---|---|---|---|---|---|---|
| India (NSE) | 17.30% | Sensex 12.06% | +5.24% | 0.513 | 2.620 | -3.8% | 16% |
| UK (LSE) | 11.19% | FTSE 100 1.23%* | +9.96%* | 0.641 | 2.148 | -7.8% | 0% |
| US (NYSE+NASDAQ+AMEX) | 10.84% | SPY 7.85% | +2.99% | 0.712 | 2.417 | -18.0% | 0% |
| Hong Kong (HKSE) | 8.67% | Hang Seng 1.64%* | +7.03%* | 0.289 | — | -22.3% | 12% |
| Canada (TSX) | 7.43% | TSX Comp 3.95% | +3.48% | 0.368 | — | -22.1% | 16% |
| Japan (JPX) | 7.39% | Nikkei 3.31% | +4.08% | 0.453 | — | -23.9% | 16% |
| Germany (XETRA) | 6.78% | DAX 5.04% | +1.74% | 0.362 | — | -35.4% | 0% |
| China (SHH) | 6.25% | SSE Comp 2.43% | +3.82% | 0.112 | — | -52.0% | 0% |
| Switzerland (SIX) | 5.45% | SMI 1.74%* | +3.71%* | 0.356 | — | -26.8% | 0% |
| Thailand (SET) | 4.99% | SET Index 5.13% | -0.14% | 0.167 | — | -26.0% | 24% |
| Korea (KSC) | 3.86% | KOSPI 5.35% | -1.49% | 0.031 | — | -65.0% | 44% |
| Malaysia (KLS) | 2.90% | SPY 7.85%† | -4.95% | 0.090 | — | -13.6% | 32% |
| Indonesia (JKT) | 2.81% | SPY 7.85%† | -5.04% | 0.077 | — | -15.2% | 44% |
| Taiwan (TAI+TWO) | 1.48% | TAIEX 4.09% | -2.60% | 0.067 | — | -11.4% | 76% |
| Sweden (STO) | -0.31% | OMX30 2.55% | -2.86% | -1.161 | — | -9.6% | 88% |
*Price-only index. Excess overstates true alpha (portfolio uses dividend-adjusted prices). †No local benchmark available, falls back to SPY. South Africa (JNB): 100% cash, excluded.
Limitations
Currency. All returns are in local currency (INR for India, GBP for UK, etc.). Cross-market comparisons in USD would show different relative rankings depending on the period.
Benchmark. Local currency indices are used per exchange. FTSE 100, Hang Seng, and SMI are price-only indices; their dividend exclusion inflates the apparent excess vs these benchmarks. India/UK/HKSE excess figures are directionally correct but overstated vs true total-return benchmarks.
FMP data coverage varies by exchange. India data before 2004 was thin — 4 cash periods at the start. Japan and UK adjClose data became reliable in 2000. China early-period data had some quality issues filtered by the 200% single-period cap.
The strategy is sector-constrained. This is an intentional design choice, not a limitation. The result is a portfolio that genuinely reflects defensive sector behavior, not a multi-sector portfolio with a defensive tilt.
Takeaway
Defensive quality works best where defensive companies actually behave defensively: established markets with strong institutional participation, clear dividend culture, and genuinely consumer-defensive or healthcare businesses.
India stands out on absolute returns: 17.30% CAGR, -3.81% max drawdown, +5.24% vs Sensex. US delivers the highest Sharpe (0.712) and the most unusual characteristic: negative down capture (-10.3%). UK produces 11.19% CAGR with a -7.78% drawdown across 25 years with zero cash periods.
Markets with thin defensive universes (Taiwan, Sweden, South Africa) should not run this strategy. Markets with speculative dynamics (China, Korea) show positive alpha vs local indices but with high drawdowns that undermine the "defensive" story.
Full backtest code and SQL: github.com/ceta-research/backtests Run live screens: cetaresearch.com/data-explorer
Data: Ceta Research (FMP financial data warehouse). Returns in local currency per exchange. Past performance does not guarantee future results.


