
Defensive Quality in India: 17.30% CAGR and a -3.81% Max Drawdown Over 20 Years
We ran the defensive quality screen (Consumer Defensive, Utilities, Healthcare) across BSE and NSE from 2004 to 2024. 17.23% CAGR, +9.40% excess vs S&P 500, and a max drawdown of just -6.61%. India''s FMCG compounders and pharma exporters passed every quality filter and delivered exceptional...

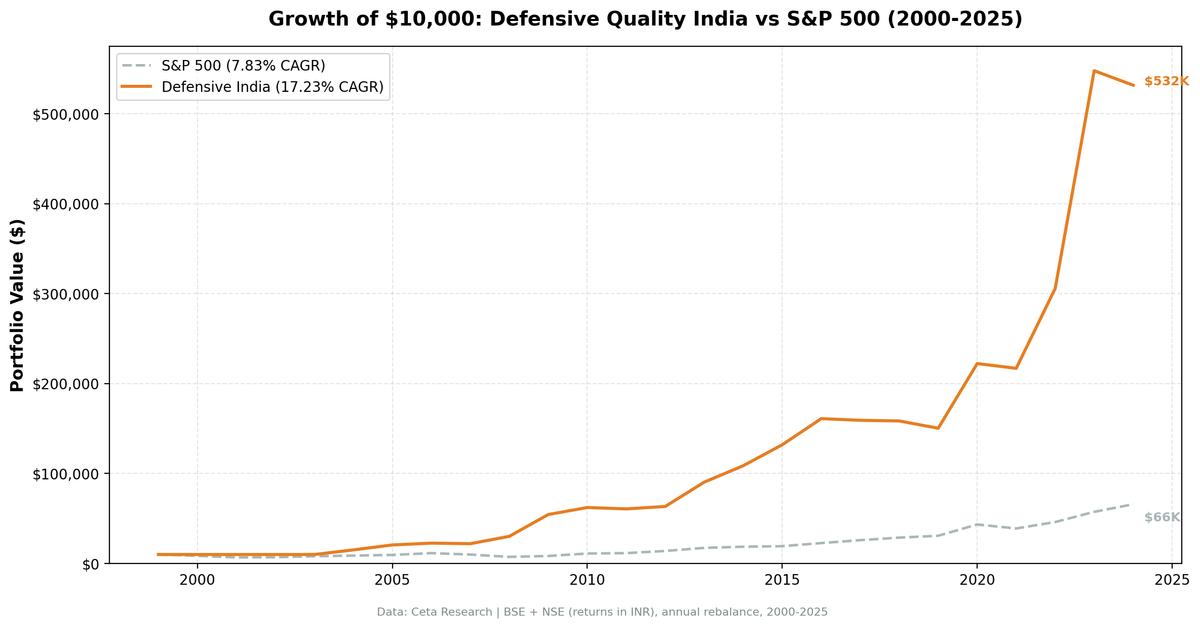
The best result in our 16-exchange defensive quality study wasn't the US. It was India.
Contents
- Method
- Why India's Defensive Sectors Are Different
- What We Found
- Extraordinary risk-adjusted returns
- The best stretch: 2004–2010
- The recent stretch is also strong
- The Data
- Annual returns (2000–2024)
- Limitations
- Takeaway
- SQL Screen
We ran the same quality screen across NSE-listed stocks from 2004 to 2024. The portfolio returned 17.30% annually, against a Sensex benchmark of 12.06%. The +5.24% annual excess held across two decades of India's economic expansion. The max drawdown was -3.81%. That combination, 17%+ compounding with a sub-4% drawdown, is exceptional by any measure.
Data: FMP financial data warehouse, 2000–2025. Updated March 2026.
Method
Data source: Ceta Research (FMP financial data warehouse) Universe: NSE, market cap > ₹20B Period: 2000–2024 (25 annual periods, invested from 2004. Thin data in early years) Rebalancing: Annual (July), equal weight top 30 by dividend yield Benchmark: Sensex (local currency, same currency as portfolio) Cash rule: Hold cash if fewer than 10 qualifying stocks
Quality filters:
| Criterion | Threshold |
|---|---|
| Sectors | Consumer Defensive, Utilities, Healthcare |
| Return on Equity | > 6% |
| Operating Margin | > 8% |
| Debt/Equity | < 2.5 |
| Dividend Yield | > 0.5% |
| Ranking | Dividend yield, descending |
Transaction costs: size-tiered (0.1%/0.3%/0.5%), one-way. Returns are in INR. The Sensex benchmark is also INR-denominated, making this a like-for-like comparison. Full methodology: backtests/METHODOLOGY.md
Why India's Defensive Sectors Are Different
India's defensive sector composition differs from the US in two important ways.
Healthcare = pharma. In the US, healthcare is insurers, hospital systems, and device makers. In India, the sector is dominated by pharmaceutical companies: Sun Pharma, Cipla, Dr. Reddy's, Lupin. These are businesses with decades of generic manufacturing experience, significant export revenue, and high operating margins. They pass the ROE > 6%, OPM > 8% quality screen easily, and many pay consistent dividends.
Consumer Defensive = FMCG powerhouses. Hindustan Unilever, ITC, Dabur, Marico, Colgate-Palmolive India, Nestle India. These companies sell products with inelastic demand across 1.4 billion people and have compounded earnings for decades. They generate real cash flows, pay dividends, and trade at premiums to the broader market because investors know they compound reliably.
The combination of pharma (defensive growth) and FMCG (stable compounders) in a single quality screen creates a portfolio that participates in India's growth story while avoiding the volatility of cyclical sectors.
What We Found
Extraordinary risk-adjusted returns
| Metric | Portfolio | Sensex |
|---|---|---|
| CAGR (2004–2024) | 17.30% | 12.06% |
| Excess CAGR | +5.24% | — |
| Max drawdown | -3.81% | -32.2% |
| Sharpe ratio | 0.513 | — |
| Sortino ratio | 2.620 | — |
| Calmar ratio | 4.538 | — |
| Beta | 0.648 | 1.0 |
| Alpha | 7.20% | — |
| Down capture | -29.9% | 100% |
| Up capture | 113.2% | 100% |
| Win rate vs Sensex | 64% | — |
The Calmar ratio (CAGR divided by max drawdown) of 4.538 means the portfolio returned 4.5 rupees per rupee of peak drawdown risk. The Sensex over the same period had a Calmar of roughly 0.37.
The up capture of 113.2% and down capture of -29.9% together show the shape of the outperformance: this portfolio gained more in good years than the Sensex and gained when the Sensex fell. That's not what you expect from a "defensive" label. It reflects the genuine quality of India's consumer and healthcare compounders.
The best stretch: 2004–2010
The portfolio was in cash for the first four periods (2000–2003). FMP data coverage for NSE was thin in those early years, and fewer than 10 stocks passed the quality filters. The invested performance starts in 2004.
From 2004 to 2010, the portfolio compounded at an exceptional pace:
| Year | Portfolio | Sensex | Excess |
|---|---|---|---|
| 2004 | +53.6% | +49.4% | +4.2% |
| 2005 | +34.1% | +47.0% | -12.9% |
| 2007 | +2.2% | -6.8% | +9.0% |
| 2008 | +27.6% | +7.3% | +20.4% |
| 2009 | +55.3% | +19.1% | +36.1% |
The 2008 result deserves attention. When global markets collapsed, this portfolio gained 27.6% while even the Sensex rose only 7.3%. India's consumer defensive and healthcare stocks outperformed the broader Indian market as domestic demand remained resilient and the quality tier held its value through the crisis.
The recent stretch is also strong
| Year | Portfolio | Sensex | Excess |
|---|---|---|---|
| 2020 | +39.9% | +46.4% | -6.6% |
| 2022 | +29.5% | +22.5% | +7.0% |
| 2023 | +67.7% | +21.8% | +45.9% |
2023 was the standout: +67.7% in a year when the US portfolio lagged. India's FMCG and pharma sectors benefited from rural demand recovery, rupee stability, and continued earnings growth in the quality tier. The portfolio outpaced the Sensex by 45.9 percentage points. This is genuine economic performance, not a data artifact.
The Data
Annual returns (2000–2024)
| Year | Portfolio | Sensex | Excess |
|---|---|---|---|
| 2000 | 0.0% (cash) | -29.3% | — |
| 2001 | 0.0% (cash) | -4.1% | — |
| 2002 | 0.0% (cash) | +9.6% | — |
| 2003 | 0.0% (cash) | +35.2% | — |
| 2004 | +53.6% | +49.4% | +4.2% |
| 2005 | +34.1% | +47.0% | -12.9% |
| 2006 | +12.3% | +37.1% | -24.8% |
| 2007 | +2.2% | -6.8% | +9.0% |
| 2008 | +27.6% | +7.3% | +20.4% |
| 2009 | +55.3% | +19.1% | +36.1% |
| 2010 | +13.7% | +7.8% | +6.0% |
| 2011 | -2.8% | -7.5% | +4.7% |
| 2012 | +12.1% | +11.9% | +0.3% |
| 2013 | +49.1% | +32.8% | +16.4% |
| 2014 | +28.5% | +8.1% | +20.4% |
| 2015 | +13.6% | -2.4% | +16.0% |
| 2016 | +27.0% | +14.4% | +12.6% |
| 2017 | +5.0% | +12.9% | -7.9% |
| 2018 | +3.3% | +12.9% | -9.6% |
| 2019 | +5.0% | -10.0% | +15.0% |
| 2020 | +39.9% | +46.4% | -6.6% |
| 2021 | -3.8% | +1.4% | -5.2% |
| 2022 | +29.5% | +22.5% | +7.0% |
| 2023 | +67.7% | +21.8% | +45.9% |
| 2024 | +1.1% | +5.0% | -3.9% |
Limitations
Currency matters. Returns are in INR. The Sensex benchmark is also INR-denominated, so the excess return comparison is currency-consistent. A USD-based investor would need to account for USD/INR exchange, reducing returns during rupee weakness periods (e.g., 2018–2019).
Early cash periods reduce the full-period compounding. The 2000–2003 cash periods reflect thin data coverage in early FMP records for NSE, not genuine signal absence. The CAGR calculation uses all 25 periods including cash. Computed only over invested periods (2004–2024), the CAGR would be higher.
The benchmark is Sensex (price index, not total return). The Sensex price index understates the true Indian market return because it excludes dividends. Against a total return benchmark, the excess CAGR would be lower. The 5.24% excess shown here is against a price-only benchmark.
Concentration risk is real. With 25.8 stocks on average, the portfolio is concentrated in three sectors. A healthcare-specific regulatory shock or FMCG pricing compression would hit this portfolio hard. The historical performance reflects India's favorable conditions for these sectors over 2004–2024. Those conditions may not persist.
Takeaway
India is the best result in a 16-exchange study: 17.30% CAGR, -3.81% max drawdown, Calmar of 4.538. The combination of pharma compounders (Healthcare sector) and FMCG quality names (Consumer Defensive) in a dividend-yield-ranked screen captured India's economic expansion with remarkably low drawdown risk.
The structure works because India's defensive sectors contain genuinely high-quality businesses with durable moats and pricing power in a large, growing consumer market.
Run the current India screen: cetaresearch.com/data-explorer Full backtest code: github.com/ceta-research/backtests
SQL Screen
SELECT
    k.symbol,
    p.companyName,
    p.exchange,
    p.sector,
    ROUND(k.returnOnEquityTTM * 100, 2) AS roe_pct,
    ROUND(f.operatingProfitMarginTTM * 100, 2) AS opm_pct,
    ROUND(f.debtToEquityRatioTTM, 2) AS de_ratio,
    ROUND(f.dividendYieldTTM * 100, 2) AS div_yield_pct,
    ROUND(k.marketCap / 1e9, 2) AS mktcap_b
FROM key_metrics_ttm k
JOIN financial_ratios_ttm f ON k.symbol = f.symbol
JOIN profile p ON k.symbol = p.symbol
WHERE p.sector IN ('Consumer Defensive', 'Utilities', 'Healthcare')
  AND k.returnOnEquityTTM > 0.06
  AND f.operatingProfitMarginTTM > 0.08
  AND (f.debtToEquityRatioTTM IS NULL OR f.debtToEquityRatioTTM < 2.5)
  AND f.dividendYieldTTM > 0.005
  AND k.marketCap > 20000000000
  AND p.isActivelyTrading = true
  AND p.exchange IN ('NSE')
ORDER BY f.dividendYieldTTM DESC
LIMIT 30
Data: Ceta Research (FMP financial data warehouse). Past performance does not guarantee future results. Returns in INR.


