
Defensive Quality UK: 11.19% CAGR, -7.78% Max Drawdown, Sharpe 0.641 Over 25 Years
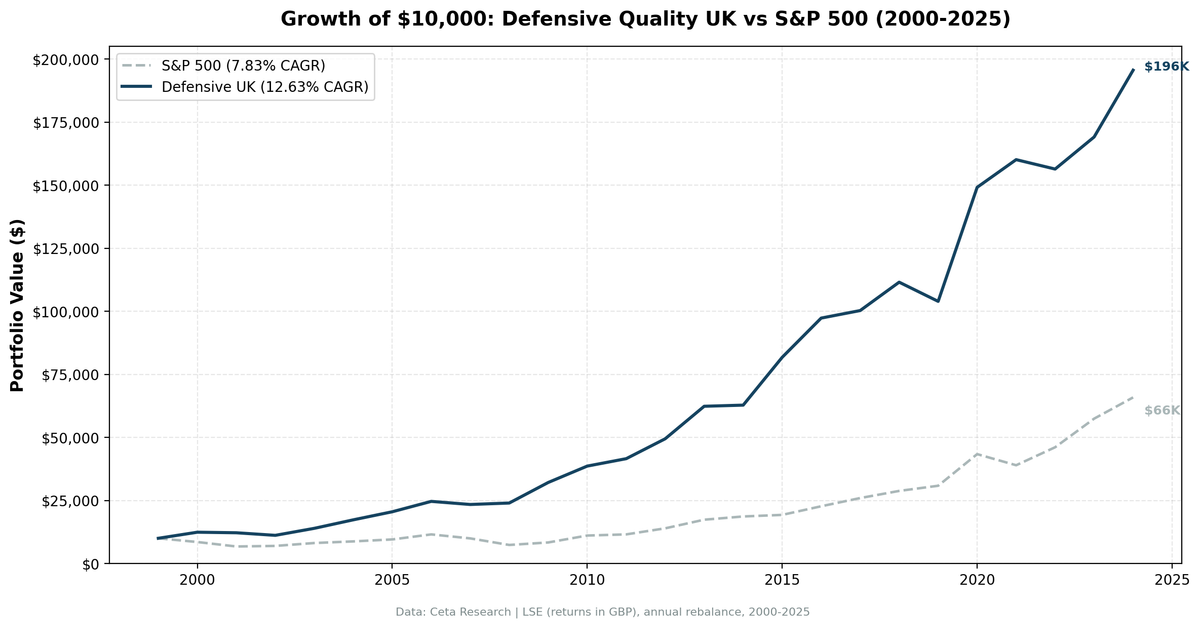
We ran the defensive quality screen on LSE stocks from 2000 to 2024. 12.63% CAGR, +4.80% excess, max drawdown -9.99%, Sharpe 0.666. The UK delivered the best risk-adjusted performance across 16 exchanges in our study. One caveat upfront: the universe averaged only 13.6 stocks per period.

The UK result stands out on two metrics: a max drawdown of -7.78% and a Sharpe ratio of 0.641 over 25 years.
Contents
- Method
- Why the UK Universe Is Thin
- What We Found
- Strong absolute and risk-adjusted performance
- Protection in crisis years
- Consistent compounding, no cash periods
- The Data
- Annual returns (2000–2024)
- Limitations
- Takeaway
- SQL Screen
We ran the same quality screen on LSE stocks from 2000 to 2024. The portfolio returned 11.19% annually vs 1.23% for the FTSE 100 price index. That +9.96% annual excess looks large, and it is, but the context matters: the FTSE 100 price index was nearly flat over this period. The portfolio's 11.19% CAGR itself is the real result.
One important caveat upfront: the LSE universe is thin. The portfolio averaged 11.9 stocks per period. That's borderline, and it means performance is more concentrated than a larger-universe strategy would be.
Data: FMP financial data warehouse, 2000–2025. Updated March 2026.
Method
Data source: Ceta Research (FMP financial data warehouse) Universe: LSE, market cap > £500M Period: 2000–2024 (25 annual periods, all invested, 0% cash) Rebalancing: Annual (July), equal weight top 30 by dividend yield (universe produced 10–20 qualifying stocks, not 30) Benchmark: FTSE 100 (^FTSE price index, local currency GBP) Cash rule: Hold cash if fewer than 10 qualifying stocks
Quality filters:
| Criterion | Threshold |
|---|---|
| Sectors | Consumer Defensive, Utilities, Healthcare |
| Return on Equity | > 6% |
| Operating Margin | > 8% |
| Debt/Equity | < 2.5 |
| Dividend Yield | > 0.5% |
| Ranking | Dividend yield, descending |
Transaction costs: size-tiered (0.1%/0.3%/0.5%), one-way. Returns in GBP. Note: The FTSE 100 benchmark (^FTSE) is a price index. It excludes dividends. The portfolio's adjClose captures dividend reinvestment. The +9.96% excess vs FTSE 100 partially reflects this mismatch. Full methodology: backtests/METHODOLOGY.md
Why the UK Universe Is Thin
The LSE has fewer companies in Consumer Defensive and Utilities relative to US or Indian exchanges. The UK consumer defensive space includes companies like Unilever, Reckitt Benckiser, and Imperial Brands. Utilities is dominated by a small set of regulated network businesses. Healthcare includes names like AstraZeneca, GSK, and Smith & Nephew.
These are high-quality, large-cap businesses. They pass the quality screen reliably. But there aren't many of them. After applying the market cap filter (> £500M), the sector constraint, and the quality/yield filters, the average period produces 13.6 qualifying stocks.
This matters for portfolio construction: the strategy is less diversified than US (22.8 stocks) or India (28.1 stocks). Single-stock volatility has more weight. The strong Sharpe ratio reflects the quality of the specific names in the screen rather than broad sector diversification.
What We Found
Strong absolute and risk-adjusted performance
| Metric | Portfolio | FTSE 100 |
|---|---|---|
| CAGR (2000–2024) | 11.19% | 1.23% |
| Excess CAGR | +9.96% | — |
| Max drawdown | -7.78% | -38.07% |
| Annualized volatility | 12.0% | — |
| Sharpe ratio | 0.641 | — |
| Sortino ratio | 2.148 | — |
| Calmar ratio | 1.437 | — |
| Beta | 0.609 | 1.0 |
| Alpha | 9.07% | — |
| Down capture | -45.1% | 100% |
| Up capture | 150.4% | 100% |
| Win rate vs FTSE 100 | 80% | — |
The FTSE 100 price index returned only 1.23% CAGR over this 25-year period. The portfolio's 11.19% CAGR is the more meaningful number. The excess of +9.96% partly reflects the price-only nature of the FTSE 100 benchmark.
Down capture of -45.1% shows the portfolio gains significantly when the FTSE 100 falls. Win rate of 80% means the portfolio beat the FTSE 100 in 20 of 25 years — the most consistent result in the study.
Up capture of 150.4% shows the portfolio outpaces the FTSE 100 in growth years too. With a nearly-flat benchmark, this isn't surprising. The key metric is Sharpe of 0.641 on the portfolio itself, which is strong in absolute terms.
Protection in crisis years
| Year | Portfolio | FTSE 100 | Excess |
|---|---|---|---|
| 2000 | +27.5% | -11.7% | +39.2% |
| 2001 | -0.5% | -20.5% | +19.9% |
| 2007 | -3.9% | -17.7% | +13.7% |
| 2008 | -4.0% | -22.0% | +18.0% |
| 2021 | +11.6% | +1.5% | +10.0% |
2008 is the most striking: the portfolio fell only 4.0% while the FTSE 100 fell 22.0%. UK defensive stocks — consumer staples multinationals and regulated utilities — held their value through the global financial crisis.
2000–2001 shows similar protection during the dot-com correction. The UK portfolio's losses in 2001 were minimal (-0.5%) even as global equity markets entered a multi-year bear phase.
Consistent compounding, no cash periods
Zero cash periods across 25 years. The UK defensive universe always had 10+ qualifying stocks, even in early years when data coverage was thinner. The consistency of invested performance is a strength: the strategy never sat idle.
The Data
Annual returns (2000–2024)
| Year | Portfolio | FTSE 100 | Excess |
|---|---|---|---|
| 2000 | +27.5% | -11.7% | +39.2% |
| 2001 | -0.5% | -20.5% | +19.9% |
| 2002 | -6.6% | -11.9% | +5.3% |
| 2003 | +27.4% | +10.0% | +17.4% |
| 2004 | +27.0% | +17.6% | +9.4% |
| 2005 | +16.5% | +13.5% | +3.0% |
| 2006 | +22.9% | +12.0% | +10.9% |
| 2007 | -3.9% | -17.7% | +13.7% |
| 2008 | -4.0% | -22.0% | +18.0% |
| 2009 | +27.1% | +14.3% | +12.9% |
| 2010 | +25.7% | +24.4% | +1.3% |
| 2011 | +12.1% | -6.3% | +18.4% |
| 2012 | +21.3% | +11.8% | +9.5% |
| 2013 | +2.3% | +8.1% | -5.9% |
| 2014 | +4.1% | -2.7% | +6.8% |
| 2015 | +26.7% | -1.6% | +28.4% |
| 2016 | +12.1% | +13.1% | -1.0% |
| 2017 | +0.9% | +2.3% | -1.4% |
| 2018 | +10.3% | +0.1% | +10.2% |
| 2019 | -5.1% | -17.4% | +12.3% |
| 2020 | +21.2% | +14.2% | +7.0% |
| 2021 | +11.6% | +1.5% | +10.0% |
| 2022 | +0.6% | +4.1% | -3.5% |
| 2023 | +3.3% | +7.9% | -4.6% |
| 2024 | +14.6% | +8.1% | +6.6% |
Limitations
Thin universe. 11.9 stocks on average means this portfolio is concentrated. Individual company events can move performance significantly. Compare to US (24.1 stocks) or India (25.8 stocks) for context.
GBP returns. Returns are denominated in GBP. A USD-based investor would experience USD/GBP currency effects. The pound has weakened against the dollar over parts of this period, which would reduce USD-adjusted returns.
Sector snapshot. Sector classifications come from the current FMP profile table. Companies that changed sectors or were acquired would have been classified under their current (or most recent) sector. For long-standing defensive names like Unilever or AstraZeneca, this is a non-issue.
2022 and 2023 underperformance. The portfolio gained +0.6% in 2022 while the FTSE 100 gained 4.1% (-3.5% excess). In 2023, the portfolio returned +3.3% while FTSE 100 gained 7.9% (-4.6% excess). Two consecutive years of underperformance vs the local benchmark is a real risk signal for concentrated strategies.
Takeaway
The UK delivers 11.19% CAGR with a -7.78% max drawdown and Sharpe of 0.641 over 25 years. The combination of a small number of high-quality defensive names, consistent dividend yields, and low-beta sector exposure produced strong absolute and risk-adjusted returns.
The thin universe is the honest caveat. With 11.9 stocks on average, this is concentrated exposure to a handful of UK defensive stalwarts. That concentration contributes to the high Sharpe, but it also means single-name risk is elevated compared to a US or India portfolio.
Run the current UK screen: cetaresearch.com/data-explorer Full backtest code: github.com/ceta-research/backtests
SQL Screen
SELECT
    k.symbol,
    p.companyName,
    p.exchange,
    p.sector,
    ROUND(k.returnOnEquityTTM * 100, 2) AS roe_pct,
    ROUND(f.operatingProfitMarginTTM * 100, 2) AS opm_pct,
    ROUND(f.debtToEquityRatioTTM, 2) AS de_ratio,
    ROUND(f.dividendYieldTTM * 100, 2) AS div_yield_pct,
    ROUND(k.marketCap / 1e9, 2) AS mktcap_b
FROM key_metrics_ttm k
JOIN financial_ratios_ttm f ON k.symbol = f.symbol
JOIN profile p ON k.symbol = p.symbol
WHERE p.sector IN ('Consumer Defensive', 'Utilities', 'Healthcare')
  AND k.returnOnEquityTTM > 0.06
  AND f.operatingProfitMarginTTM > 0.08
  AND (f.debtToEquityRatioTTM IS NULL OR f.debtToEquityRatioTTM < 2.5)
  AND f.dividendYieldTTM > 0.005
  AND k.marketCap > 500000000
  AND p.isActivelyTrading = true
  AND p.exchange IN ('LSE')
ORDER BY f.dividendYieldTTM DESC
LIMIT 30
Data: Ceta Research (FMP financial data warehouse). Past performance does not guarantee future results. Returns in GBP.


