
Dividend Coverage on Japanese Stocks: Strong vs Local Benchmark, Weak vs Global
We screened JPX-listed stocks for FCF-backed dividends. 7.88% CAGR over 25 years, +4.57% alpha vs Nikkei 225 price return. But vs S&P 500 total return, essentially matched. The comparison matters.

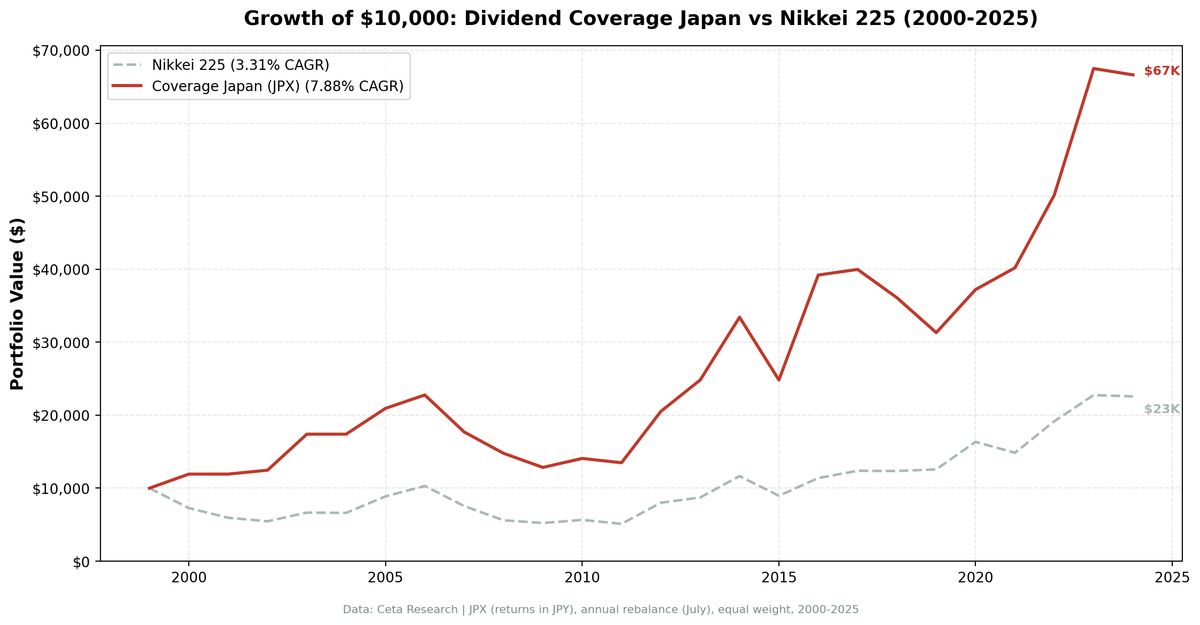
We screened JPX-listed stocks for companies whose free cash flow comfortably covers their dividend payments. Coverage between 1.5x and 20x, yield above 2%, annual rebalance. The result: 7.88% CAGR over 25 years vs 3.31% for the Nikkei 225 (price return). A +4.57% alpha vs the local benchmark. However, vs the S&P 500 (total return, cross-market), coverage stocks essentially matched at 7.88% vs 7.85%. The portfolio held cash in 2 of 25 periods and averaged 25 stocks. The 56% win rate vs Nikkei and a -43.59% max drawdown (well below the Nikkei's own) show that dividend coverage works in Japan and provides real downside protection, but the underlying businesses didn't generate enough return to clear global benchmarks.
Contents
- Method
- What is Dividend Coverage?
- The Screen (SQL)
- What We Found
- 25 years of data. +4.57% alpha vs Nikkei 225. Modest outperformance.
- Year-by-year returns
- Extreme volatility: +58% and -26% in nearby years
- 2009: the post-crisis stumble
- 2012-2014: Abenomics surge
- 2022-2023: the recent revival
- Where the strategy fails
- Currency Warning
- Backtest Methodology
- Limitations
- Takeaway
- Part of a Series
- References
- Run This Screen Yourself
Data: FMP financial data warehouse, 2000–2025. Updated March 2026.
Method
Data source: Ceta Research (FMP financial data warehouse) Universe: Japan Exchange Group (JPX), market cap > 200B JPY Period: 2000-2025 (25 years, 25 annual periods) Rebalancing: Annual (July), equal weight top 30 by coverage descending Benchmark: Nikkei 225 (^N225, price return) Cash rule: Hold cash if fewer than 10 stocks qualify Transaction costs: Size-tiered model (0.1-0.5% one-way based on market cap)
Financial data uses a 45-day lag to prevent look-ahead bias. July rebalance ensures fiscal year filings are available.
What is Dividend Coverage?
Coverage measures whether a company can afford its dividend from cash, not earnings. The formula:
FCF Coverage = Free Cash Flow / ABS(Common Dividends Paid)
Earnings can be manipulated through depreciation, amortization, and stock-based compensation. Free cash flow is harder to fake. A company with 3x coverage generates three yen of free cash for every yen it sends to shareholders. Below 1x, the company is borrowing or drawing down reserves to maintain its dividend.
Japan has historically had a weak dividend culture. Companies accumulated cash on balance sheets rather than returning it to shareholders. Payout ratios were low by global standards, and dividends were seen as secondary to growth investment. This has changed since the Tokyo Stock Exchange's governance reforms in 2022-2023, which pushed companies toward higher capital efficiency. But for most of our 25-year test period, Japanese companies treated dividends as an afterthought.
Screen Filters:
| Criterion | Metric | Threshold |
|---|---|---|
| Dividend safety | FCF / ABS(Dividends Paid) | 1.5x to 20x |
| Meaningful yield | Dividend Yield | > 2% |
| Institutional grade | Market Cap | > 200B JPY |
Coverage below 1.5x is too thin. Above 20x usually means a token dividend (very common in Japan where companies pay minimal dividends). The yield filter removes companies paying negligible dividends despite high coverage. Combined, these three filters isolate companies with meaningful, well-funded dividend payments.
Academic basis: Benartzi, Michaely & Thaler (1997) showed that dividend changes signal information about future cash flows. Managers are reluctant to cut dividends even when fundamentals deteriorate. In Japan, this reluctance is even stronger. The cultural aversion to dividend cuts makes coverage a useful signal for detecting companies stretching to maintain payments.
The Screen (SQL)
WITH latest_cf AS (
    SELECT c.symbol, c.freeCashFlow, c.commonDividendsPaid, c.date,
        ROW_NUMBER() OVER (PARTITION BY c.symbol ORDER BY c.date DESC) AS rn
    FROM cash_flow_statement c
    JOIN profile p ON c.symbol = p.symbol
    WHERE c.period = 'FY'
      AND c.commonDividendsPaid < 0
      AND c.freeCashFlow > 0
      AND p.exchange IN ('JPX')
),
latest_ratios AS (
    SELECT symbol, dividendYield, date,
        ROW_NUMBER() OVER (PARTITION BY symbol ORDER BY date DESC) AS rn
    FROM financial_ratios
    WHERE period = 'FY' AND dividendYield IS NOT NULL
),
latest_metrics AS (
    SELECT symbol, marketCap, date,
        ROW_NUMBER() OVER (PARTITION BY symbol ORDER BY date DESC) AS rn
    FROM key_metrics
    WHERE period = 'FY' AND marketCap IS NOT NULL
)
SELECT
    cf.symbol,
    ROUND(cf.freeCashFlow / NULLIF(ABS(cf.commonDividendsPaid), 0), 2) AS coverage,
    ROUND(r.dividendYield * 100, 2) AS yield_pct,
    ROUND(cf.freeCashFlow / 1e9, 2) AS fcf_bn,
    ROUND(km.marketCap / 1e9, 1) AS mktcap_bn
FROM latest_cf cf
JOIN latest_ratios r ON cf.symbol = r.symbol AND r.rn = 1
JOIN latest_metrics km ON cf.symbol = km.symbol AND km.rn = 1
WHERE cf.rn = 1
  AND cf.freeCashFlow / NULLIF(ABS(cf.commonDividendsPaid), 0) BETWEEN 1.5 AND 20
  AND r.dividendYield > 0.02
  AND km.marketCap > 2e11
ORDER BY coverage DESC
LIMIT 30
Run this query on Ceta Research
What We Found

25 years of data. +4.57% alpha vs Nikkei 225. Modest outperformance.
| Metric | Coverage (JPX) | Nikkei 225 |
|---|---|---|
| CAGR | 7.88% | 3.31% |
| Total Return | 566% | 126% |
| Volatility | 22.3% | 22.2% |
| Max Drawdown | -43.59% | -50.38% |
| Sharpe Ratio | 0.350 | 0.145 |
| Win Rate (annual) | 56% | - |
| Avg Stocks per Period | 24.8 | - |
| Cash Periods | 2 of 25 | - |
$10,000 invested in 2000 grew to roughly $67,000 vs $23,000 for the Nikkei 225. The +4.57% annual alpha vs the local benchmark is substantial. However, the Nikkei 225 price return (excluding dividends) is a weak comparison point. Against the S&P 500 total return (7.85% CAGR), coverage stocks essentially matched (+0.03% difference).
The 56% win rate vs Nikkei shows modest consistency. The -43.59% max drawdown is severe in absolute terms, but it is well below the Nikkei's own -50.38%, so the screen did cushion the worst of Japan's declines. Japan's dividend coverage screening works better vs the local price return index than vs global total return benchmarks.
Why show this? Because honest backtesting means reporting modest results alongside the standouts. The same screen that generates 3.71% alpha in the US and 2.89% in Sweden (vs S&P 500) essentially matches SPY in Japan.
Year-by-year returns
| Year | Coverage | Nikkei 225 | Excess |
|---|---|---|---|
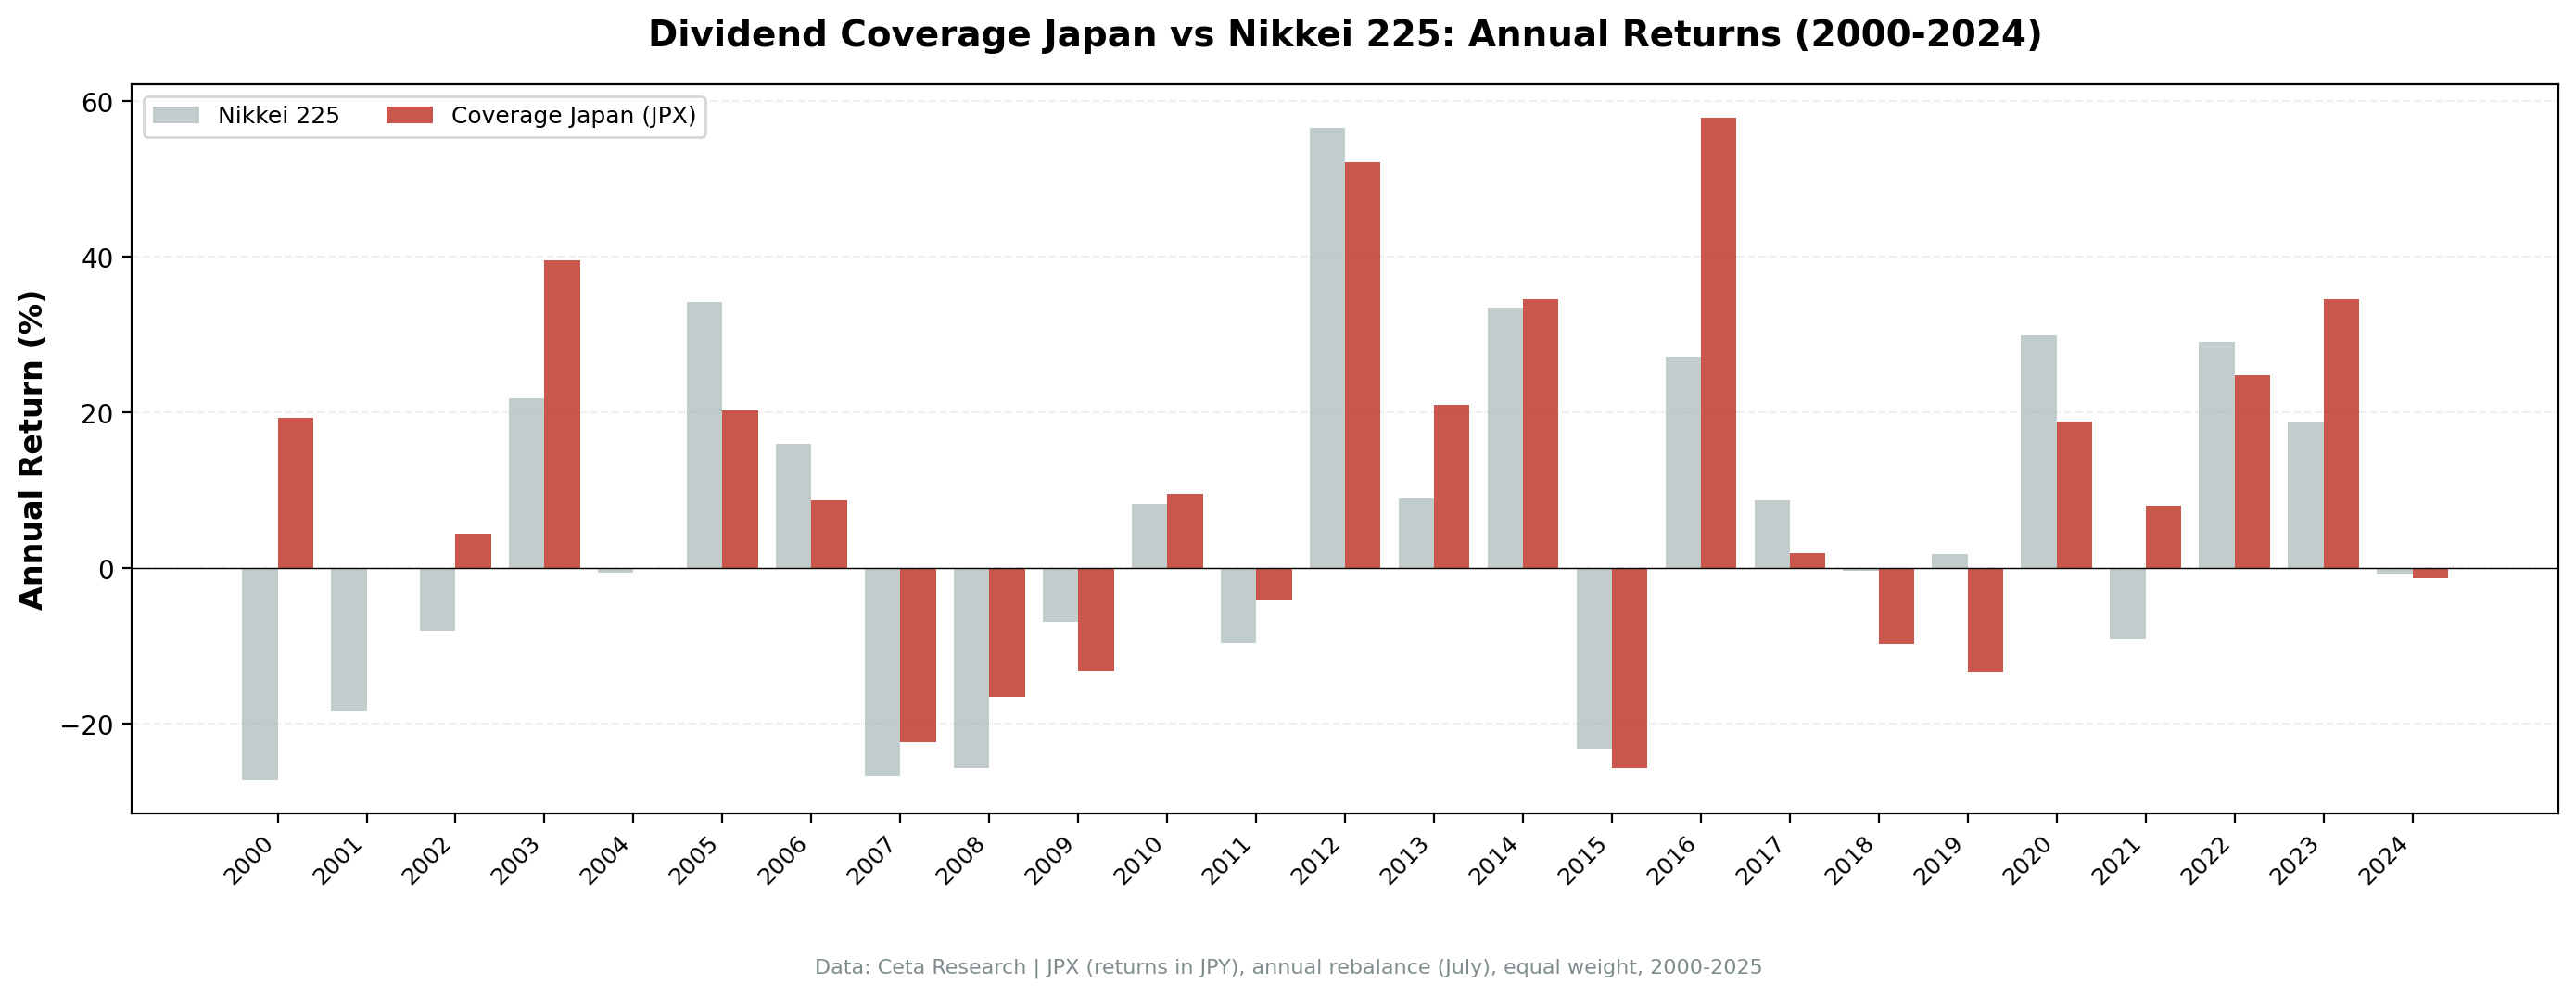
| 2000 | +19.3% | -27.2% | +46.5% |
| 2001 | 0.0% (cash) | -18.3% | - |
| 2002 | +4.5% | -8.1% | +12.6% |
| 2003 | +39.6% | +21.8% | +17.8% |
| 2004 | 0.0% (cash) | -0.6% | - |
| 2005 | +20.3% | +34.2% | -13.9% |
| 2006 | +8.8% | +16.0% | -7.3% |
| 2007 | -22.3% | -26.8% | +4.5% |
| 2008 | -16.5% | -25.7% | +9.2% |
| 2009 | -13.1% | -6.8% | -6.3% |
| 2010 | +9.6% | +8.3% | +1.3% |
| 2011 | -4.2% | -9.7% | +5.5% |
| 2012 | +52.2% | +56.6% | -4.4% |
| 2013 | +20.9% | +9.0% | +11.9% |
| 2014 | +34.6% | +33.5% | +1.1% |
| 2015 | -25.7% | -23.1% | -2.6% |
| 2016 | +57.9% | +27.1% | +30.8% |
| 2017 | +2.0% | +8.8% | -6.8% |
| 2018 | -9.7% | -0.3% | -9.4% |
| 2019 | -13.3% | +1.8% | -15.1% |
| 2020 | +18.9% | +30.0% | -11.1% |
| 2021 | +8.0% | -9.1% | +17.1% |
| 2022 | +24.8% | +29.1% | -4.2% |
| 2023 | +34.6% | +18.7% | +15.8% |
| 2024 | -1.3% | -0.8% | -0.5% |
Extreme volatility: +58% and -26% in nearby years
2016 produced +57.9% with +30.8% excess. 2015 produced -25.7% with -2.6% excess. That kind of year-to-year swing is what 22.3% volatility looks like in practice. The strategy doesn't smooth returns in Japan. It amplifies them.
2009: the post-crisis stumble
-13.1% with -6.3% excess. While other markets recovered from the financial crisis, Japanese coverage stocks stagnated. Global markets bounced in 2009, but Japanese dividend payers didn't participate in the recovery. Japan's deflationary environment and corporate cash hoarding meant that even companies with good coverage weren't being rewarded by the market. The screen recovered in 2010 (+9.6%) and 2011 (-4.2%, but +5.5% excess as the Nikkei fell harder).
2012-2014: Abenomics surge
| Year | Coverage | Excess |
|---|---|---|
| 2012 | +52.2% | -4.4% |
| 2014 | +34.6% | +1.1% |
Abenomics changed the game for Japanese dividend stocks. Shinzo Abe's push for corporate governance reform and shareholder returns made dividend-paying companies suddenly attractive. Coverage stocks rode this wave hard, though 2012 actually saw the Nikkei 225 surge even harder (+56.6%). The raw 2014 return of +34.6% was strong and edged the benchmark.
2022-2023: the recent revival
+24.8% and +34.6% in consecutive years. The Tokyo Stock Exchange's 2022 governance push, demanding that companies trading below book value improve capital allocation, revived interest in Japanese dividend payers. Coverage stocks benefited directly from this policy shift, with 2023's +15.8% excess return being one of the strongest outperformance years. But 2024 essentially matched the benchmark (-0.5% excess), suggesting the governance tailwind may be fading.
Where the strategy fails
2019 (-15.1% excess), 2005 (-13.9%), 2020 (-11.1%), and 2018 (-9.4%) were the worst underperformance years. The 2005 result is particularly notable: the Nikkei 225 surged +34.2%, but coverage stocks only managed +20.3%. Growth stocks, driven by the tech sector and post-crisis monetary easing, dominated Japanese returns in these years. Dividend coverage stocks were left behind.
Currency Warning
All returns are in Japanese Yen (JPY). The yen weakened dramatically against the USD over this period, from roughly 105 in 2000 to 150+ in recent years. A US-based investor would see significantly lower USD returns. The 7.71% JPY CAGR translates to a much lower USD figure after accounting for yen depreciation.
The alpha is +0.03% vs S&P 500 (cross-market), though +4.57% vs Nikkei 225 (local price return). The Nikkei 225 price return index excludes dividends, which flatters the local comparison. Against the S&P 500 total return ETF, Japanese coverage stocks essentially matched.
Backtest Methodology
| Parameter | Choice |
|---|---|
| Universe | JPX, Market Cap > 200B JPY |
| Signal | FCF / ABS(Dividends Paid) between 1.5x and 20x |
| Filters | Dividend Yield > 2%, Market Cap > 200B JPY |
| Portfolio | Top 30 by coverage descending, equal weight |
| Rebalancing | Annual (July) |
| Cash rule | Hold cash if < 10 qualify |
| Benchmark | Nikkei 225 (^N225, price return) |
| Period | 2000-2025 (25 years) |
| Data | Point-in-time (45-day lag for annual filings) |
| Costs | Size-tiered transaction costs applied |
Limitations
Against the S&P 500, the alpha is essentially zero (+0.03%). Against Nikkei 225 price return, +4.57%, but this compares total return portfolio to price return index. The apparent local outperformance is partly an artifact of benchmark choice.
56% win rate (vs Nikkei 225). Modest consistency. The positive alpha comes from a few strong years (2000, 2003, 2016, 2023) overwhelming steady underperformance.
High volatility. 22.3% is among the most volatile results in our global test. The concentrated portfolio amplifies Japan's already-volatile market.
-43.59% max drawdown. A severe loss at the worst point, but well below the Nikkei's own -50.38%, so the coverage filter did provide meaningful downside protection during Japan's declines.
Japan's dividend culture changed mid-test. The pre-2012 period (weak dividend culture) and post-2012 period (governance reforms encouraging payouts) are fundamentally different environments. A single 25-year backtest blends two regimes with different characteristics.
Annual rebalancing is slow. Japanese companies can change dividend policy quickly in response to earnings or governance pressure.
Coverage is backward-looking. The ratio uses last fiscal year's cash flow statement.
Survivorship bias. Exchange membership uses current company profiles.
Takeaway
The dividend coverage screen produced mixed results in Japan. Against the Nikkei 225 price return index, the +4.57% alpha appears meaningful. But this comparison is flawed: the portfolio includes dividend reinvestment while the price index doesn't. Against the S&P 500 total return (apples-to-apples), Japanese coverage stocks essentially matched (7.88% vs 7.85%).
The screen worked better in Japan than the marginal outperformance suggests. It selected genuine dividend payers with strong cash flows. But Japanese corporate culture, deflationary pressures through most of the period, and weak governance until recent reforms meant that even high-quality dividend companies didn't generate strong returns. The signal identified good stocks. The macro environment limited what those stocks could deliver.
The recent results (2022-2023) are encouraging. TSE governance reforms pushed companies toward higher shareholder returns, and coverage stocks benefited (+15.8% excess in 2023). If these reforms stick, the coverage screen might become more effective going forward. But 25 years of data say this isn't the market where dividend coverage screening shines.
For investors interested in Japanese dividend stocks specifically, the governance reform angle matters more than backward-looking FCF coverage. The strategy's best years (2000, 2003, 2016, 2023) all coincided with policy shifts favoring shareholder returns. In Japan, the policy environment drives dividend returns more than the fundamentals.
Part of a Series
This analysis is part of our dividend coverage global exchange comparison. We tested the same screen on 12 exchanges worldwide: - Dividend Coverage on US Stocks (NYSE, NASDAQ, AMEX) - 11.56% CAGR, the baseline - Dividend Coverage on German Stocks (XETRA) - 12.83% CAGR, highest alpha - Dividend Coverage on Swedish Stocks (STO) - 10.74% CAGR, strong Sharpe - Dividend Coverage on Canadian Stocks (TSX) - 10.84% CAGR, lowest volatility - Dividend Coverage: 12-Exchange Global Comparison - full comparison table
References
- Benartzi, S., Michaely, R. & Thaler, R. (1997). "Do Changes in Dividends Signal the Future or the Past?" Journal of Finance, 52(3), 1007-1034.
- DeAngelo, H., DeAngelo, L. & Skinner, D. (1996). "Reversal of Fortune: Dividend Signaling and the Disappearance of Sustained Earnings Growth." Journal of Financial Economics, 40(3), 341-371.
Run This Screen Yourself
Via web UI: Run the coverage screen on Ceta Research. The query is pre-loaded. Hit "Run" and see what passes today.
Via Python:
import requests, time

API_KEY = "your_api_key"  # get one at cetaresearch.com
BASE = "https://tradingstudio.finance/api/v1"

resp = requests.post(f"{BASE}/data-explorer/execute", headers={
    "X-API-Key": API_KEY, "Content-Type": "application/json"
}, json={
    "query": """
        WITH latest_cf AS (
            SELECT c.symbol, c.freeCashFlow, c.commonDividendsPaid, c.date,
                ROW_NUMBER() OVER (PARTITION BY c.symbol ORDER BY c.date DESC) AS rn
            FROM cash_flow_statement c
            JOIN profile p ON c.symbol = p.symbol
            WHERE c.period = 'FY' AND c.commonDividendsPaid < 0
              AND c.freeCashFlow > 0 AND p.exchange IN ('JPX')
        ),
        latest_ratios AS (
            SELECT symbol, dividendYield,
                ROW_NUMBER() OVER (PARTITION BY symbol ORDER BY date DESC) AS rn
            FROM financial_ratios WHERE period = 'FY' AND dividendYield IS NOT NULL
        ),
        latest_metrics AS (
            SELECT symbol, marketCap,
                ROW_NUMBER() OVER (PARTITION BY symbol ORDER BY date DESC) AS rn
            FROM key_metrics WHERE period = 'FY' AND marketCap IS NOT NULL
        )
        SELECT cf.symbol,
            ROUND(cf.freeCashFlow / NULLIF(ABS(cf.commonDividendsPaid), 0), 2) AS coverage,
            ROUND(r.dividendYield * 100, 2) AS yield_pct,
            ROUND(km.marketCap / 1e9, 1) AS mktcap_bn
        FROM latest_cf cf
        JOIN latest_ratios r ON cf.symbol = r.symbol AND r.rn = 1
        JOIN latest_metrics km ON cf.symbol = km.symbol AND km.rn = 1
        WHERE cf.rn = 1
          AND cf.freeCashFlow / NULLIF(ABS(cf.commonDividendsPaid), 0) BETWEEN 1.5 AND 20
          AND r.dividendYield > 0.02 AND km.marketCap > 2e11
        ORDER BY coverage DESC LIMIT 30
    """,
    "options": {"format": "json", "limit": 100}
})
task_id = resp.json()["taskId"]

while True:
    result = requests.get(f"{BASE}/tasks/data-query/{task_id}",
                          headers={"X-API-Key": API_KEY}).json()
    if result["status"] in ("completed", "failed"):
        break
    time.sleep(2)

for r in result["result"]["rows"][:10]:
    print(f"{r['symbol']:8s} coverage={r['coverage']:.1f}x yield={r['yield_pct']:.1f}%")
Get your API key at cetaresearch.com. The full backtest code (Python + DuckDB) is on GitHub.
Data: Ceta Research, FMP financial data warehouse. Universe: JPX. Annual rebalance (July), equal weight top 30, 2000-2025.
Past performance does not guarantee future results. This is educational content, not investment advice.


