
Dividend Growth on UK Stocks: +6.68% Over FTSE 100 With 84% Win Rate
We ran a dividend growth screen on UK stocks (LSE). 7.91% CAGR, +6.68% excess over FTSE 100, 84% win rate. 0% cash periods across 25 years. Down capture of 19.85%. The deepest dividend culture globally.

Dividend Growth on UK Stocks: +6.68% Over FTSE 100 With 84% Win Rate (LSE Backtest)
The London Stock Exchange is where modern dividend culture started. British companies have been paying and raising dividends since the 18th century, and the habit runs deep. FTSE blue chips treat dividend growth as a point of corporate pride. We ran a 25-year backtest on LSE-listed stocks that have raised their dividends for 5+ consecutive years, and the UK market never once failed to produce enough qualifying names. Zero cash periods across 25 years. That alone tells you something about how deeply dividend growth is embedded in UK equity culture.
Contents
- Method
- The Screen
- Results
- Annual Returns
- When It Works
- When It Struggles
- Limitations
- Run This Screen
- Takeaway
- Part of a Series
- References
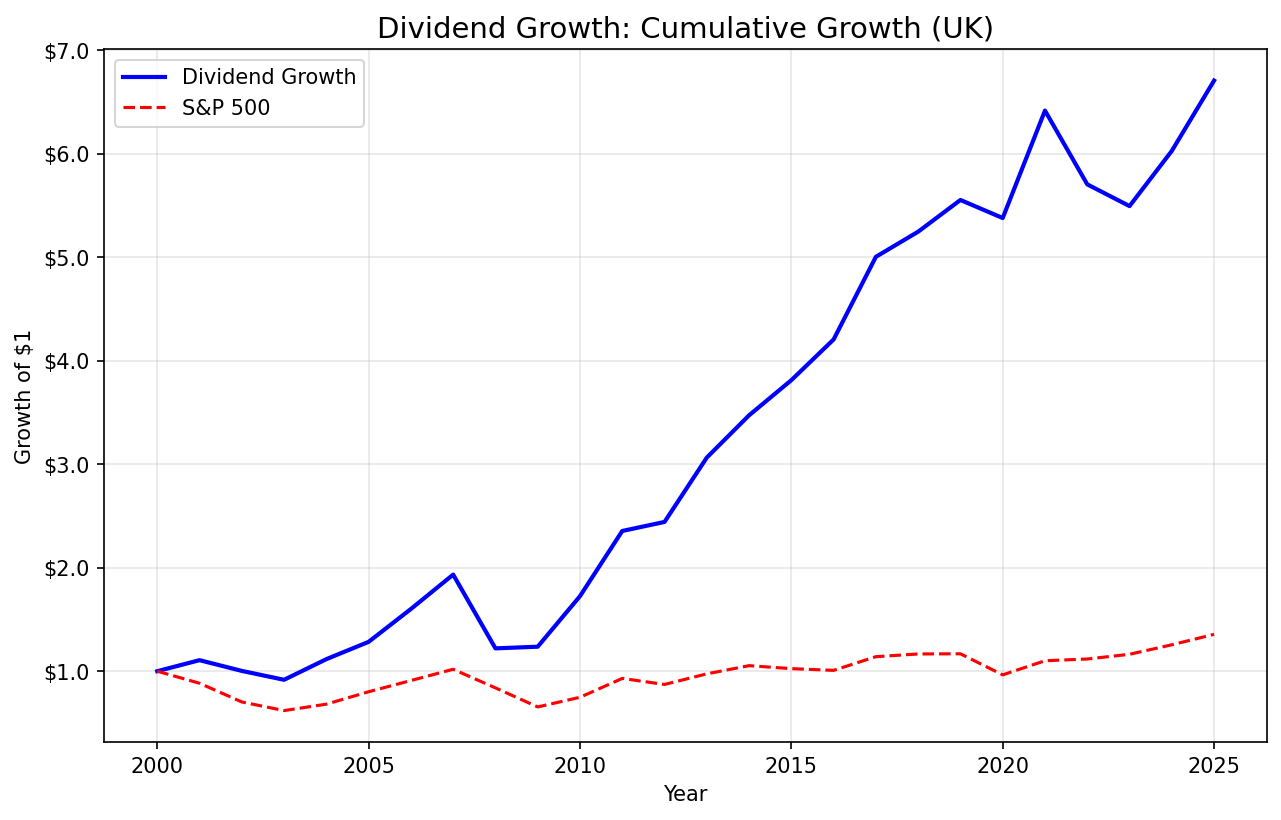
The results: 7.91% CAGR, a 571% total return, and +6.68% annualized excess over the FTSE 100 benchmark. That's genuine, sustained outperformance against the local index. An 84% win rate means the strategy beat the FTSE in 21 out of 25 years. Down capture of 19.85% is exceptional. In years when the FTSE fell, this portfolio captured less than a fifth of the loss.
Data: FMP financial data warehouse, 2000–2025. Updated March 2026.
Method
| Parameter | Value |
|---|---|
| Universe | LSE (London Stock Exchange) |
| Market cap | > £500M |
| Dividend streak | 5+ consecutive years of annual increases |
| Payout ratio | 0-80% |
| Free cash flow | Positive |
| Max positions | 30 stocks, equal weight |
| Ranking | Top 30 by streak length |
| Rebalancing | Annual (July) |
| Cash rule | Fewer than 10 qualifying stocks |
| Data source | FMP via Ceta Research warehouse |
| Benchmark | FTSE 100 (^FTSE) |
| Period | 2000-2024 |
The Screen
-- Dividend Growth UK Screen
-- Run at: [Try this screen →](https://cetaresearch.com/data-explorer?q=iZNANE4Dx5)

WITH annual_div AS (
  SELECT symbol,
    EXTRACT(YEAR FROM CAST(date AS DATE)) AS yr,
    SUM(adjDividend) AS total_div
  FROM dividend_calendar
  WHERE adjDividend > 0
  GROUP BY symbol, EXTRACT(YEAR FROM CAST(date AS DATE))
),
growth AS (
  SELECT symbol, yr, total_div,
    LAG(total_div) OVER (PARTITION BY symbol ORDER BY yr) AS prev_div
  FROM annual_div
),
streak AS (
  SELECT symbol, yr,
    CASE WHEN total_div > prev_div THEN 1 ELSE 0 END AS increased
  FROM growth WHERE prev_div IS NOT NULL
),
streak_summary AS (
  SELECT symbol,
    SUM(increased) AS consecutive_increases
  FROM streak
  GROUP BY symbol
  HAVING SUM(increased) >= 5
)
SELECT
  s.symbol,
  p.companyName,
  p.sector,
  s.consecutive_increases,
  ROUND(p.marketCap / 1e9, 2) AS marketCap_B,
  ROUND(fr.dividendPayoutRatioTTM * 100, 1) AS payout_pct,
  ROUND(cf.freeCashFlow / 1e6, 0) AS fcf_mm
FROM streak_summary s
JOIN profile p ON s.symbol = p.symbol
JOIN financial_ratios fr ON s.symbol = fr.symbol
  AND fr.fiscalYear = YEAR(CURRENT_DATE) - 1
JOIN cash_flow_statement cf ON s.symbol = cf.symbol
  AND cf.fiscalYear = YEAR(CURRENT_DATE) - 1
WHERE p.exchange IN ('LSE')
  AND p.marketCap > 500000000
  AND fr.dividendPayoutRatioTTM BETWEEN 0 AND 0.80
  AND cf.freeCashFlow > 0
  AND p.isActivelyTrading = true
ORDER BY s.consecutive_increases DESC
LIMIT 30;
Results
25-year summary (2000-2024):
| Metric | Dividend Growth (UK) | FTSE 100 (^FTSE) |
|---|---|---|
| CAGR | 7.91% | 1.23% |
| Total Return | 571% | — |
| Sharpe Ratio | 0.271 | — |
| Sortino Ratio | 0.464 | — |
| Max Drawdown | -36.87% | — |
| Calmar Ratio | 0.215 | — |
| Beta | 0.976 | 1.0 |
| Alpha | 6.63% | — |
| Volatility | 16.27% | — |
| Up Capture | 154.8% | 100% |
| Down Capture | 19.85% | 100% |
| Win Rate | 84% | — |
| Cash Periods | 0/25 (0%) | — |
| Avg Stocks | 24.8 | — |
The CAGR of 7.91% doesn't sound dramatic on its own. But the FTSE 100 returned just 1.23% annualized over the same period. That's +6.68% of annual excess return, sustained over 25 years. The strategy beat the FTSE in 21 out of 25 years.
Alpha of 6.63%. With a beta of 0.976, the portfolio carried nearly identical market risk to the FTSE 100. The outperformance isn't coming from taking more risk. It's coming from owning better companies. Dividend growth screens naturally select for businesses with durable cash flows, disciplined capital allocation, and management teams that prioritize shareholder returns.
Down capture of 19.85%. When the FTSE fell, this portfolio captured less than a fifth of the loss. That's an extraordinary defensive profile. In every major downturn, the dividend growers held up while the broader index sold off. Companies with multi-year records of raising dividends don't tend to be the ones that collapse in a crisis.
Sortino of 0.464 vs Sharpe of 0.271. The gap between these two ratios tells you something useful. Sortino only penalizes downside volatility, while Sharpe penalizes all volatility equally. The higher Sortino relative to Sharpe means most of the strategy's volatility comes from upside moves, not drawdowns. That's the kind of volatility you want.

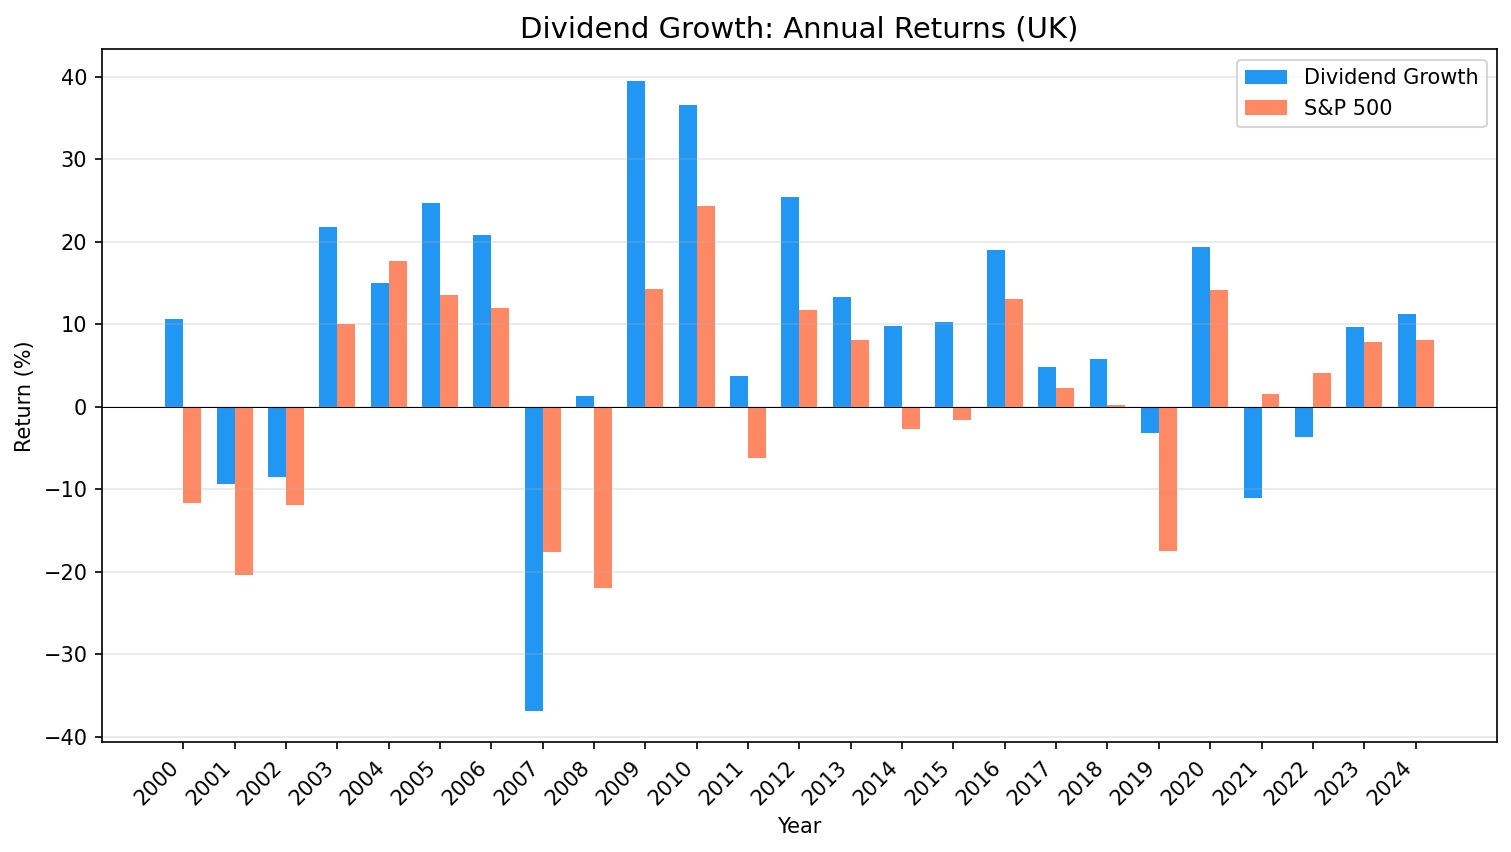
Annual Returns
| Year | Dividend Growth | FTSE 100 | Excess |
|---|---|---|---|
| 2000 | +10.7% | -11.7% | +22.3% |
| 2001 | -9.4% | -20.5% | +11.1% |
| 2002 | -8.6% | -11.9% | +3.3% |
| 2003 | +21.7% | +10.0% | +11.8% |
| 2004 | +15.0% | +17.6% | -2.6% |
| 2005 | +24.7% | +13.5% | +11.2% |
| 2006 | +20.8% | +12.0% | +8.8% |
| 2007 | -36.9% | -17.7% | -19.2% |
| 2008 | +1.3% | -22.0% | +23.3% |
| 2009 | +39.5% | +14.3% | +25.2% |
| 2010 | +36.5% | +24.4% | +12.1% |
| 2011 | +3.7% | -6.3% | +10.0% |
| 2012 | +25.5% | +11.8% | +13.7% |
| 2013 | +13.3% | +8.1% | +5.2% |
| 2014 | +9.8% | -2.7% | +12.5% |
| 2015 | +10.3% | -1.6% | +11.9% |
| 2016 | +19.0% | +13.1% | +5.9% |
| 2017 | +4.8% | +2.3% | +2.5% |
| 2018 | +5.8% | +0.1% | +5.7% |
| 2019 | -3.1% | -17.4% | +14.3% |
| 2020 | +19.3% | +14.2% | +5.2% |
| 2021 | -11.1% | +1.5% | -12.7% |
| 2022 | -3.7% | +4.1% | -7.8% |
| 2023 | +9.7% | +7.9% | +1.8% |
| 2024 | +11.3% | +8.1% | +3.2% |
When It Works
Bear markets. The dot-com bust tells the story clearly. In 2000, the strategy returned +10.7% while the FTSE lost -11.7%. In 2001, it fell -9.4% compared to the FTSE's -20.5%. Across those two years, the excess return totaled +33.4%. Companies with long histories of raising dividends tend to be boring, profitable, and resilient. That's exactly what you want when everything else is falling apart.
2008 was the standout year. The FTSE lost -22.0%. The UK dividend growers gained +1.3%. That +23.3% of excess return in a single crisis year is the strongest defensive showing in the entire backtest. The financial crisis wiped out banks and over-leveraged companies. UK dividend growers, by definition, had conservative payout ratios, positive free cash flow, and multi-year track records of distribution increases. Those filters naturally excluded the companies most exposed to the credit crisis.
2009-2010 recovery. The portfolio returned +39.5% in 2009 and +36.5% in 2010, beating the FTSE by +25.2% and +12.1% respectively. The companies didn't just survive the crisis. They came through it fast. That's what durable cash flows buy you: the ability to recover without needing to rebuild the balance sheet first.
Most years, frankly. The strategy beat the FTSE in 21 out of 25 years. From 2003 through 2006, it returned between +15.0% and +24.7% every year. From 2011 through 2016, it beat the FTSE every single year, often by double digits. This isn't a strategy that works in narrow conditions. It works broadly and consistently.
When It Struggles
2007 was the worst absolute year. The portfolio lost -36.9% while the FTSE fell -17.7%, creating -19.2% of excess underperformance. This is the max drawdown period. Some FTSE dividend growers, particularly in financials and mining, got hit hard in the early stages of the global financial crisis before the broader UK selloff in 2008. Concentrated sector exposure was the culprit.
2021 was the second-worst relative year. The portfolio lost -11.1% while the FTSE gained +1.5%, a -12.7% gap. Post-pandemic rotation into cyclicals and energy names left some dividend growers behind.
2022 saw a modest gap. The portfolio lost -3.7% while the FTSE gained +4.1%. Energy and commodity stocks drove FTSE gains that year, and the dividend growth screen doesn't overweight those sectors.
Only 4 losing years out of 25. The strategy underperformed the FTSE in just 2004, 2007, 2021, and 2022. Two of those four were modest misses (-2.6% and -7.8%). Only 2007 was a significant loss. That's the trade-off: when the strategy loses, 2007 shows it can lose badly, but it almost never loses.
Limitations
The FTSE 100 has been a weak benchmark. 1.23% annualized over 25 years is poor by global standards. The +6.68% excess return is real, but part of it reflects a weak index rather than exceptional stock picking. If the FTSE were returning 7-8% annualized, the excess would be smaller.
No transaction costs modeled. Annual turnover with 30 positions means roughly 10-15 trades per rebalance. Costs are manageable for most investors, but they aren't zero.
Currency effects aren't isolated. UK returns are in GBP. The FTSE 100 benchmark is also in GBP, so the comparison is apples-to-apples within the UK market. But for international investors, sterling movements affect the realized return.
Survivorship bias. Companies that cut their dividends and fell off the LSE don't appear in streak counts. The survivors are the ones we see. The ones that broke their streaks and delisted are invisible.
24.8 average stocks, not 30. The portfolio averaged 24.8 holdings, slightly below the 30-stock target. The UK quality universe is deep enough to never trigger the cash rule (0/25 cash periods), but it doesn't always produce a full 30 names after applying payout, FCF, and market cap filters.
Run This Screen
The dividend growth screen for UK stocks filters the LSE for companies with 5+ consecutive years of dividend increases, payout ratios under 80%, positive free cash flow, and market caps above £500M.
Try this screen on Ceta Research
The screen runs on live FMP data. Results update as new annual filings and dividend payments come in.
Takeaway
UK dividend growth investing delivered +6.68% annualized excess over the FTSE 100 across 25 years. An 84% win rate, down capture of 19.85%, and alpha of 6.63% make this one of the strongest results in the multi-region series.
The zero cash periods across 25 years confirms what everyone already knows about the LSE: British companies pay and grow their dividends. The signal never runs dry. And during bear markets, that discipline translates into real downside protection. The 2008 result (+23.3% excess return during the worst financial crisis in modern history) is the strategy's strongest argument.
If you're building a global dividend growth portfolio, the UK is a core allocation. The alpha is genuine, the win rate is exceptional, and the downside protection during crises is exactly what you'd want from a dividend growth screen in the market that invented dividend culture.
Part of a Series
This is part of a multi-region dividend growth study:
- Dividend Growth: Strategy Overview
- Dividend Growth: US Stocks
- Dividend Growth: India
- Dividend Growth: Germany
- Dividend Growth: Canada
- Dividend Growth: Switzerland
References
- Lintner, J. (1956). "Distribution of Incomes of Corporations Among Dividends, Retained Earnings, and Taxes." American Economic Review, 46(2), 97-113.
- Arnott, R. & Asness, C. (2003). "Surprise! Higher Dividends = Higher Earnings Growth." Financial Analysts Journal, 59(1), 70-87.
Data: FMP via Ceta Research warehouse. LSE stocks, 2000-2024, annual rebalance. Past performance does not guarantee future results. This is educational content, not investment advice.


