
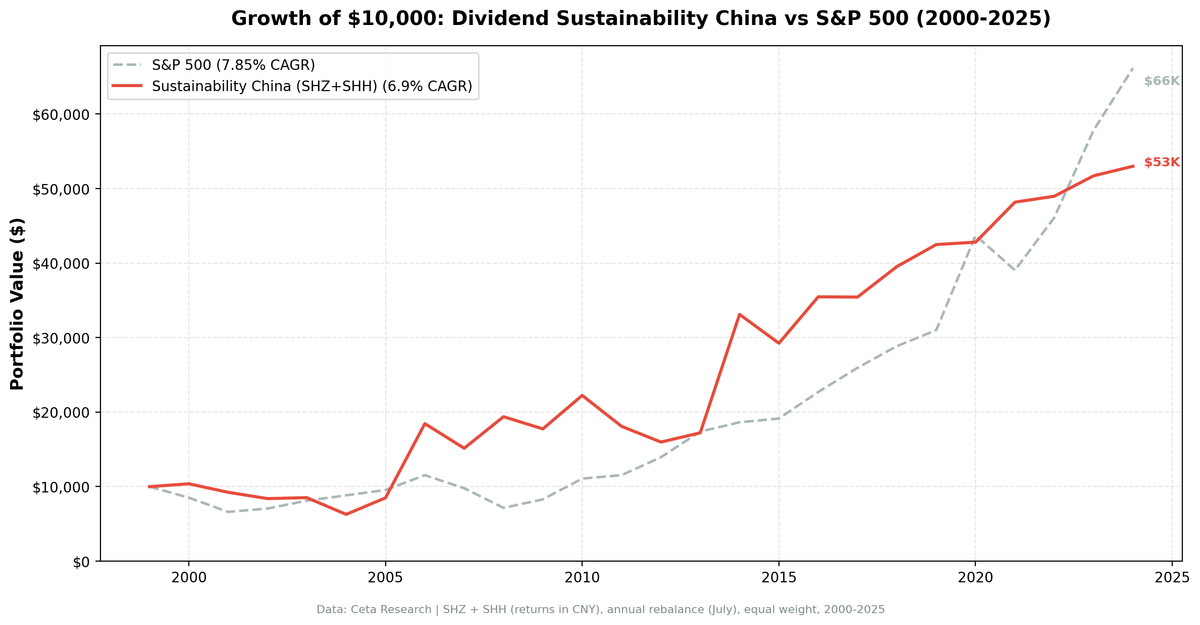
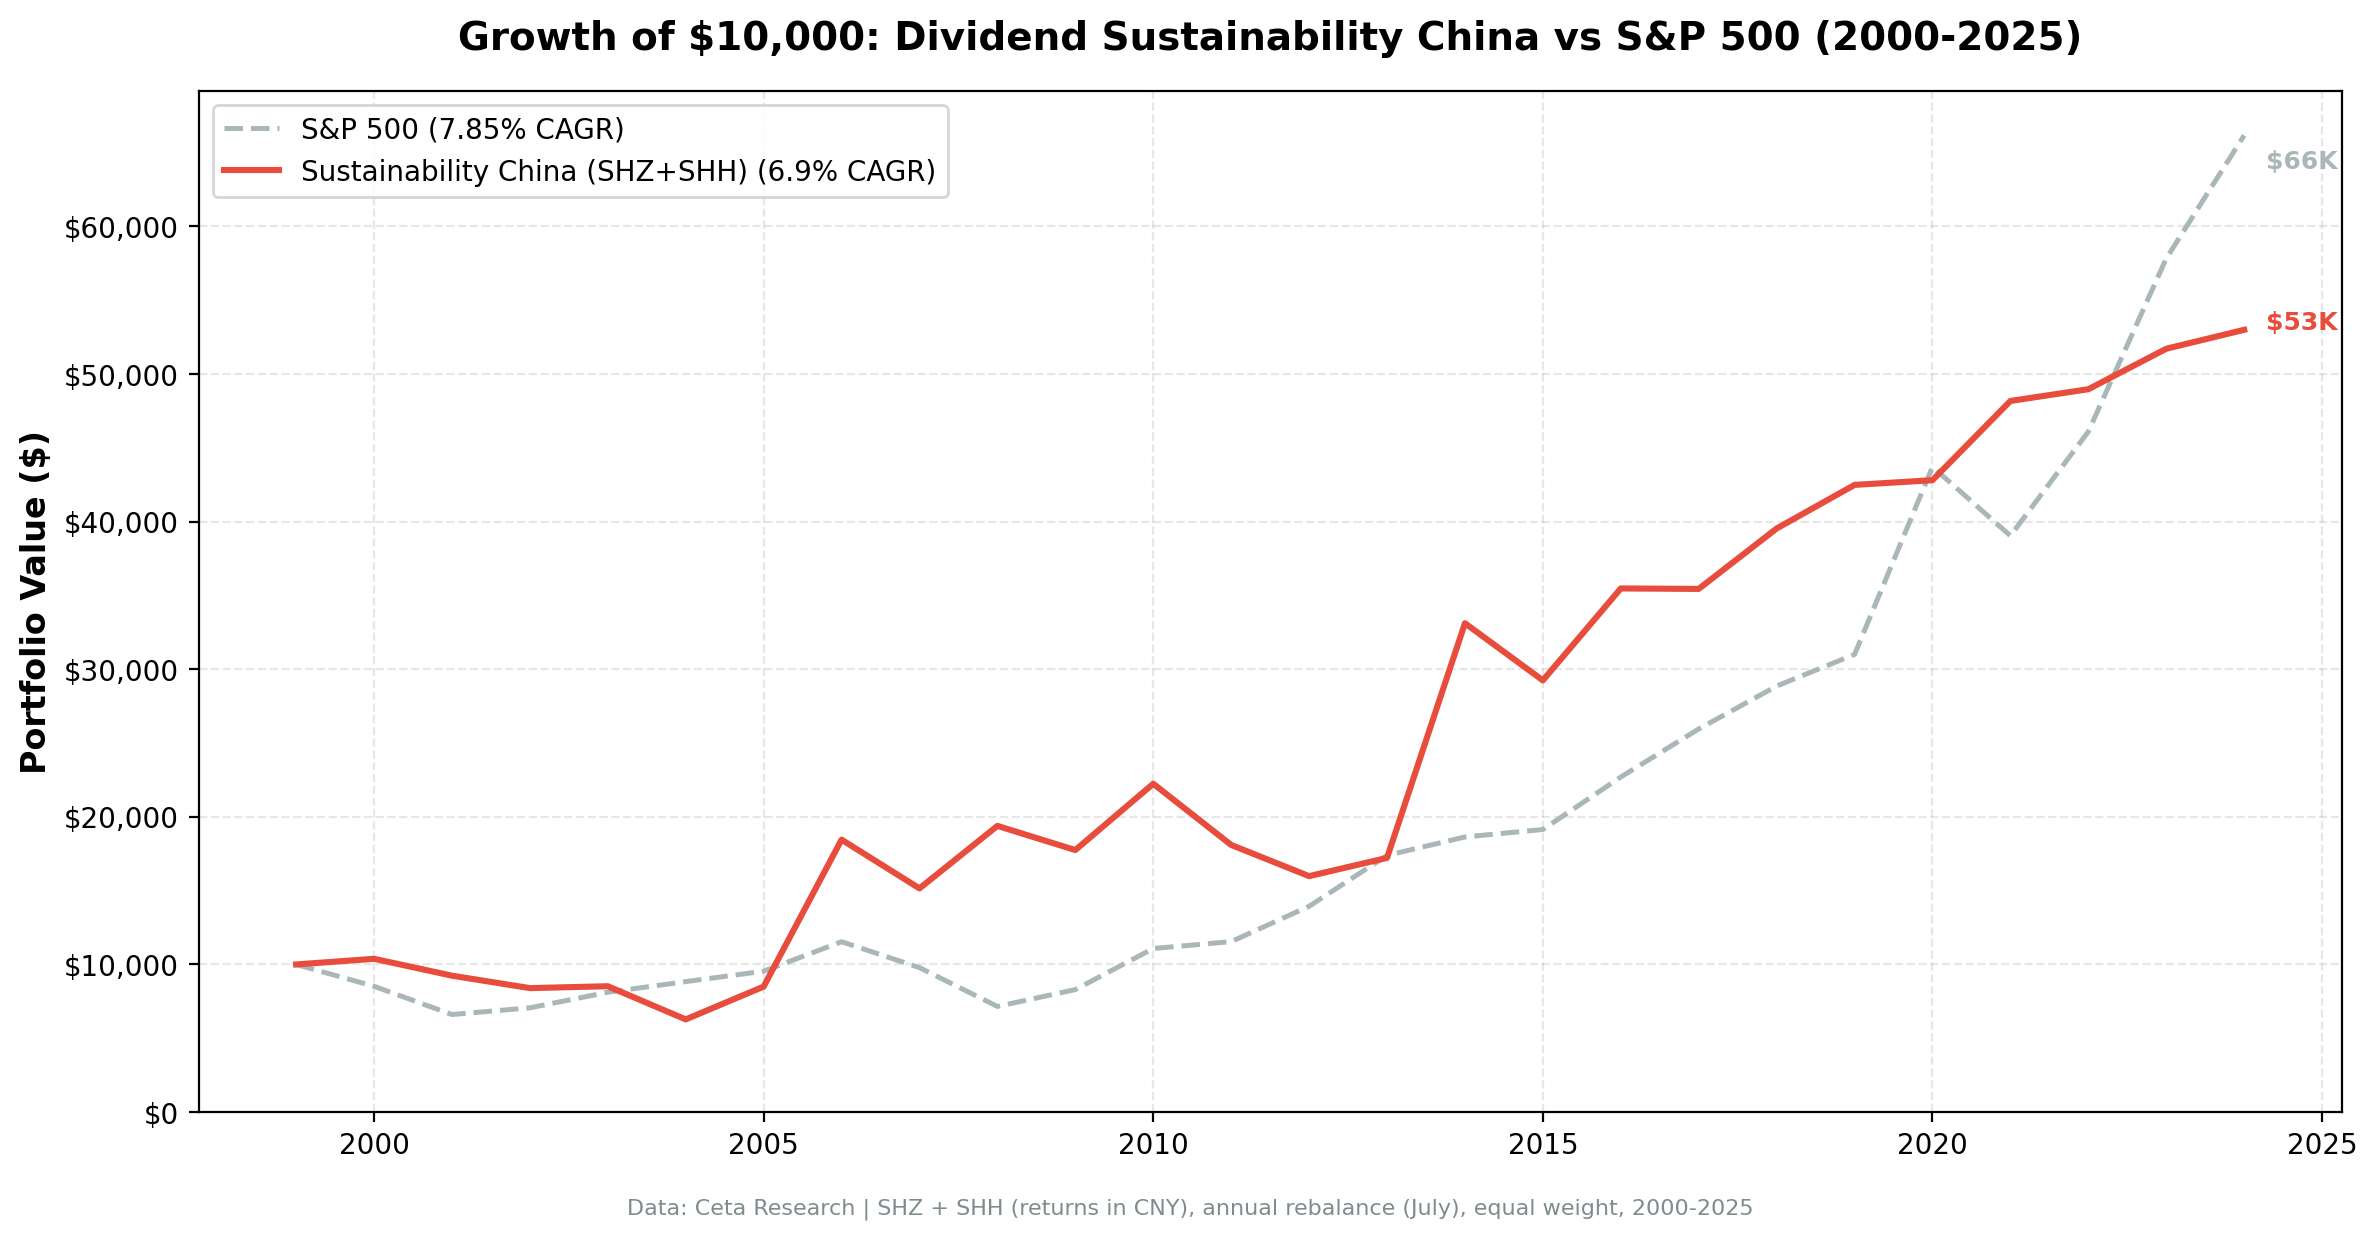
Dividend Sustainability on Chinese Stocks: 6.90% CAGR, +4.47% Over SSE Composite
A 5-factor dividend sustainability score backtested on Shanghai and Shenzhen from 2000-2025. 6.90% CAGR, +4.47% annual excess over SSE Composite, 76% win rate vs local benchmark. High volatility (32.31%) is the main cost.

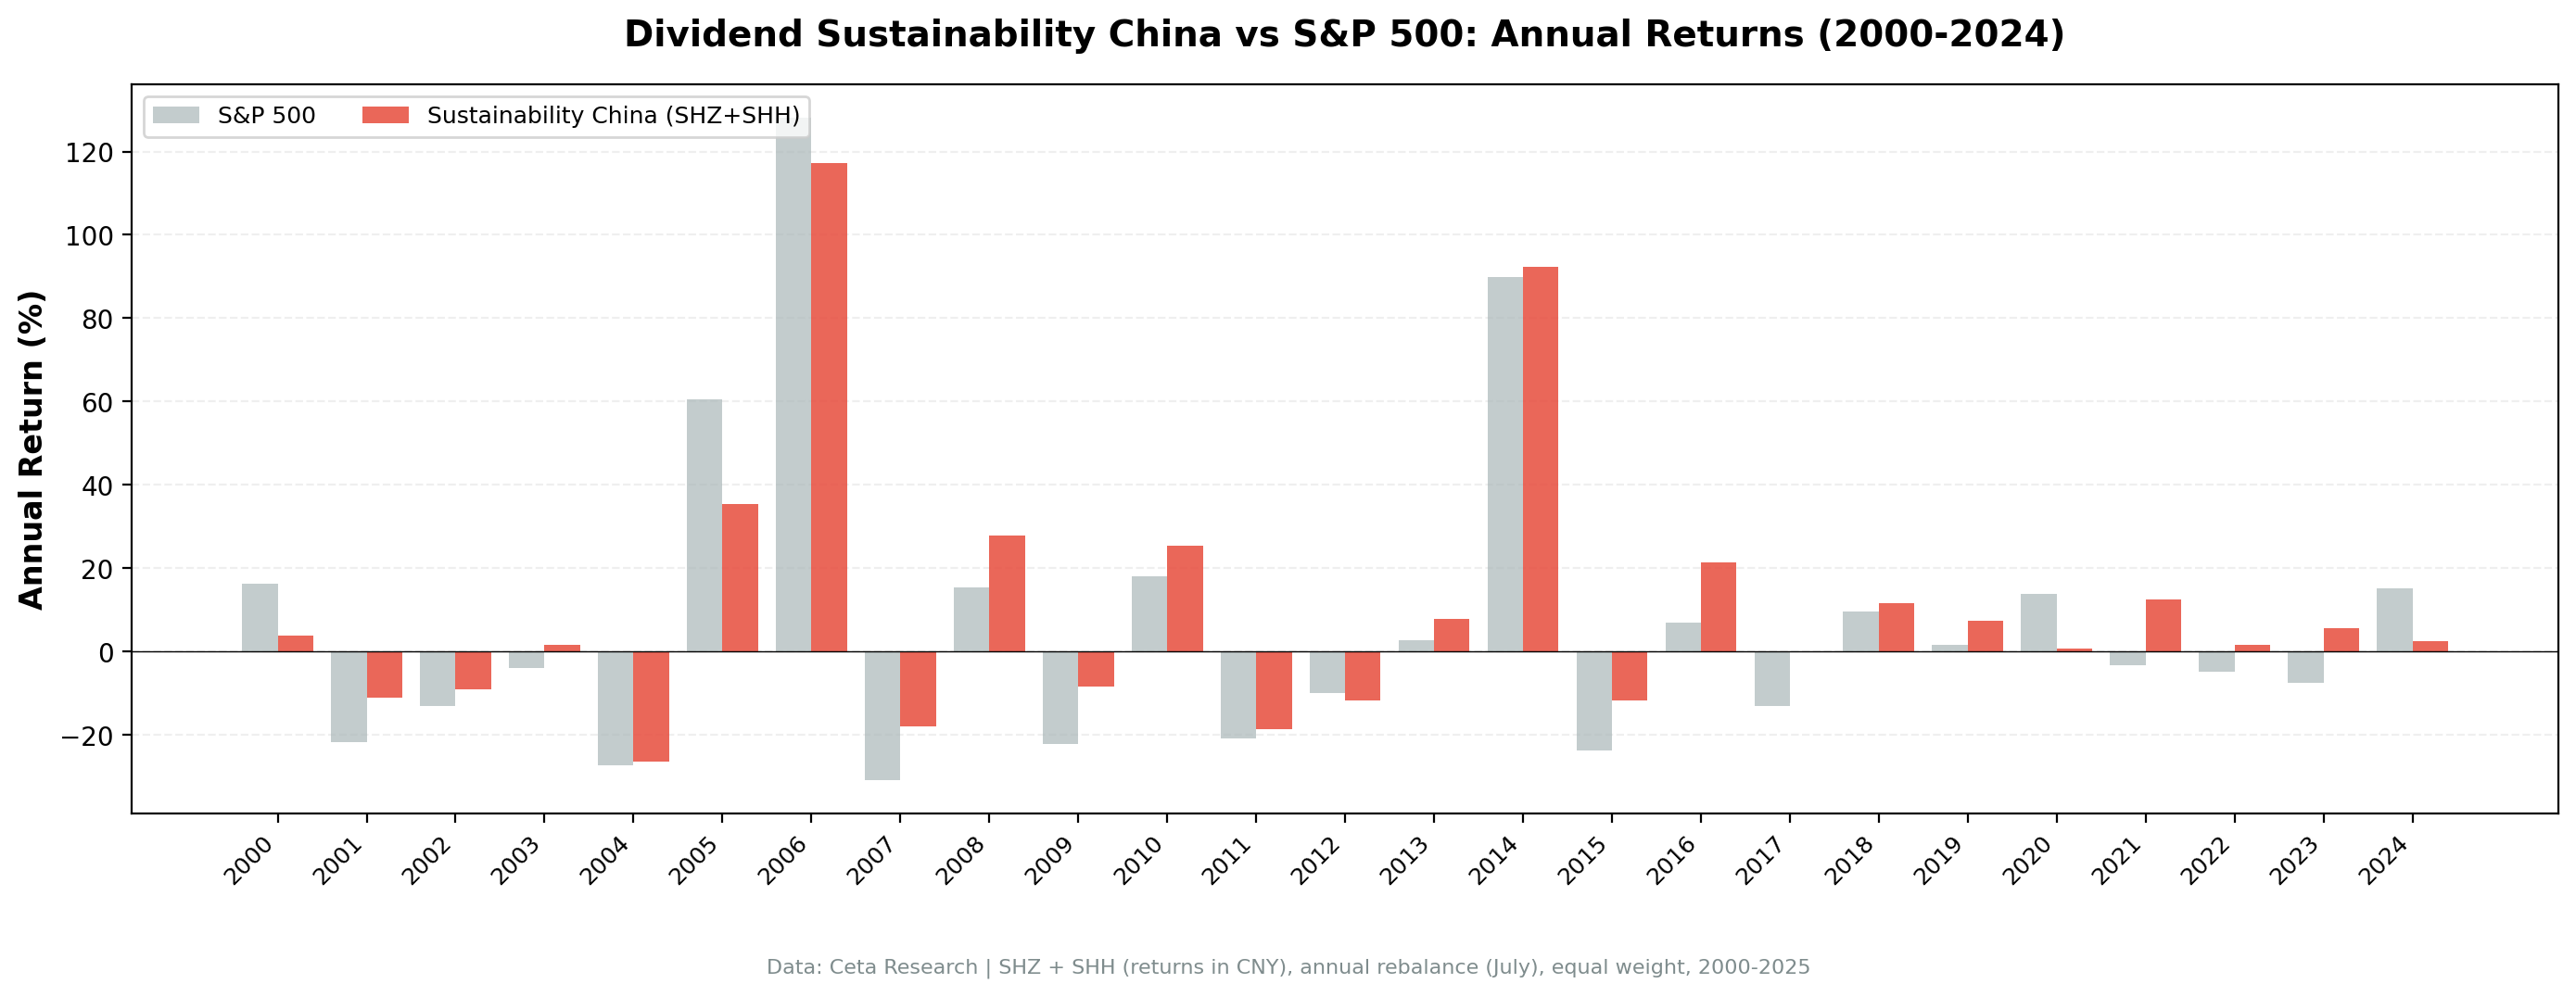
China's stock market doesn't do anything quietly. From +117.2% in 2006 to -17.9% in 2007, the swings are massive. The question we wanted to answer: can a disciplined, multi-factor dividend screen tame that volatility and extract steady returns?
Contents
- Method
- The Screen (SQL)
- What We Found
- Zero cash years. +4.47% annual excess over SSE Composite. 76% win rate vs local benchmark.
- Year-by-year returns
- 2006: the outlier that defines the backtest
- 2007-2009: where the screen earned its keep
- 2014-2015: bubble and crash
- 2018-2023: persistent macro headwinds
- Backtest Methodology
- Limitations
- Takeaway
- Part of a Series
- References
- Run This Screen Yourself
The answer, when benchmarked against the local market, is yes.
We ran our 5-component sustainability score on Shanghai (SHH) and Shenzhen (SHZ) stocks from 2000 to 2025. The result: 6.90% CAGR and 32.31% annualized volatility. When benchmarked against the SSE Composite Index (which returned just 2.43% CAGR over the period), the strategy beats the local market by 4.47% per year with a 76% win rate. The Sharpe ratio of 0.136 is still the lowest in our comparison, reflecting the volatility. But zero cash years and consistently outperforming the local benchmark is a different story than the old SPY-benchmarked reports told.
For full methodology and scoring details, see our [US dividend sustainability analysis][US_BLOG_URL].
Data: FMP financial data warehouse, 2000-2025. Updated May 2026.
Method
Data source: Ceta Research (FMP financial data warehouse) Universe: SHH + SHZ, market cap > 2B CNY (~$276M USD) Period: 2000-2025 (25 years, 25 annual periods) Rebalancing: Annual (July), equal weight top 30 by sustainability score descending (yield tiebreak) Benchmark: SSE Composite Index (Shanghai Composite, CNY) Execution: Next-day close (market-on-close after signal) Cash rule: Hold cash if fewer than 10 stocks qualify Transaction costs: Size-tiered model (0.1-0.5% one-way based on market cap)
The sustainability score combines five components (0-2 points each, total 0-10): Payout Ratio, Debt/Equity, FCF Coverage, ROE, and Piotroski F-Score. Minimum score of 7 with yield above 2%. Full scoring methodology is in the [US blog][US_BLOG_URL].
The Screen (SQL)
WITH latest_ratios AS (
    SELECT r.symbol, r.dividendPayoutRatio, r.debtToEquityRatio,
           r.dividendYield, r.date,
        ROW_NUMBER() OVER (PARTITION BY r.symbol ORDER BY r.date DESC) AS rn
    FROM financial_ratios r
    JOIN profile p ON r.symbol = p.symbol
    WHERE r.period = 'FY'
      AND r.dividendPayoutRatio > 0
      AND r.dividendYield IS NOT NULL
      AND p.exchange IN ('SHZ', 'SHH')
),
latest_cf AS (
    SELECT c.symbol, c.freeCashFlow, c.commonDividendsPaid, c.date,
        ROW_NUMBER() OVER (PARTITION BY c.symbol ORDER BY c.date DESC) AS rn
    FROM cash_flow_statement c
    JOIN profile p ON c.symbol = p.symbol
    WHERE c.period = 'FY'
      AND c.commonDividendsPaid < 0
      AND p.exchange IN ('SHZ', 'SHH')
),
latest_metrics AS (
    SELECT k.symbol, k.returnOnEquity, k.marketCap, k.date,
        ROW_NUMBER() OVER (PARTITION BY k.symbol ORDER BY k.date DESC) AS rn
    FROM key_metrics k
    JOIN profile p ON k.symbol = p.symbol
    WHERE k.period = 'FY'
      AND k.marketCap IS NOT NULL
      AND p.exchange IN ('SHZ', 'SHH')
),
latest_scores AS (
    SELECT symbol, piotroskiScore
    FROM scores
),
scored AS (
    SELECT r.symbol, r.date,
        ROUND(r.dividendPayoutRatio * 100, 1) AS payout_pct,
        ROUND(r.debtToEquityRatio, 2) AS debt_equity,
        ROUND(c.freeCashFlow / NULLIF(ABS(c.commonDividendsPaid), 0), 2) AS fcf_coverage,
        ROUND(k.returnOnEquity * 100, 1) AS roe_pct,
        s.piotroskiScore AS piotroski,
        ROUND(r.dividendYield * 100, 2) AS yield_pct,
        ROUND(k.marketCap / 1e9, 1) AS mktcap_bn,
        CASE WHEN r.dividendPayoutRatio < 0.5 THEN 2
             WHEN r.dividendPayoutRatio < 0.8 THEN 1 ELSE 0 END AS c_payout,
        CASE WHEN r.debtToEquityRatio >= 0 AND r.debtToEquityRatio < 0.5 THEN 2
             WHEN r.debtToEquityRatio >= 0 AND r.debtToEquityRatio < 1.5 THEN 1
             ELSE 0 END AS c_debt,
        CASE WHEN c.freeCashFlow > 0 AND c.commonDividendsPaid < 0
                  AND c.freeCashFlow / ABS(c.commonDividendsPaid) > 2 THEN 2
             WHEN c.freeCashFlow > 0 AND c.commonDividendsPaid < 0
                  AND c.freeCashFlow / ABS(c.commonDividendsPaid) > 1 THEN 1
             ELSE 0 END AS c_fcf,
        CASE WHEN k.returnOnEquity > 0.15 THEN 2
             WHEN k.returnOnEquity > 0.08 THEN 1 ELSE 0 END AS c_roe,
        CASE WHEN s.piotroskiScore >= 7 THEN 2
             WHEN s.piotroskiScore >= 5 THEN 1 ELSE 0 END AS c_piotroski
    FROM latest_ratios r
    JOIN latest_cf c ON r.symbol = c.symbol AND c.rn = 1
    JOIN latest_metrics k ON r.symbol = k.symbol AND k.rn = 1
    LEFT JOIN latest_scores s ON r.symbol = s.symbol
    WHERE r.rn = 1
      AND r.dividendYield > 0.02
      AND k.marketCap > 2e9
)
SELECT symbol, date, payout_pct, debt_equity, fcf_coverage, roe_pct, piotroski,
       yield_pct, mktcap_bn,
       c_payout + c_debt + c_fcf + c_roe + COALESCE(c_piotroski, 0) AS sustainability_score,
       c_payout, c_debt, c_fcf, c_roe, COALESCE(c_piotroski, 0) AS c_piotroski
FROM scored
WHERE c_payout + c_debt + c_fcf + c_roe + COALESCE(c_piotroski, 0) >= 7
ORDER BY sustainability_score DESC, yield_pct DESC
LIMIT 30
[Run this query on Ceta Research][SUSTAINABILITY_CHINA_QUERY_URL]
What We Found
Zero cash years. +4.47% annual excess over SSE Composite. 76% win rate vs local benchmark.
| Metric | Sustainability (China) | SSE Composite |
|---|---|---|
| CAGR | 6.90% | 2.43% |
| Volatility | 32.31% | - |
| Max Drawdown | -39.55% | - |
| Sharpe Ratio | 0.136 | - |
| Sortino Ratio | 0.436 | - |
| Win Rate (annual) | 76% | - |
| Down Capture | 46.3% | - |
| Up Capture | 93.3% | - |
| Beta | 0.842 | - |
| Alpha | 4.46% | - |
| Avg Stocks per Period | 23.4 | - |
| Cash Periods | 0 of 25 | - |
| Avg Sustainability Score | 8.9/10 | - |
The SSE Composite returned just 2.43% CAGR over this 25-year period. Against that benchmark, the sustainability screen's 4.47% annual excess and 76% win rate are a strong result. The strategy beat the local market in 19 of 25 years.
The volatility (32.31%) is still the highest in our comparison. Even with multi-factor quality filtering, Chinese stocks are volatile. But the 76% win rate shows the filter consistently adds value against the local benchmark. Zero cash years means the screen always found at least 10 qualifying stocks. The average sustainability score of 8.9/10 is tied with Hong Kong for the highest in our comparison.
Year-by-year returns
| Year | Sustainability | SSE Composite | Excess |
|---|---|---|---|
| 2000 | +3.8% | +16.4% | -12.5% |
| 2001 | -11.0% | -21.8% | +10.8% |
| 2002 | -9.1% | -13.1% | +3.9% |
| 2003 | +1.5% | -3.9% | +5.4% |
| 2004 | -26.4% | -27.3% | +1.0% |
| 2005 | +35.4% | +60.6% | -25.2% |
| 2006 | +117.2% | +128.1% | -11.0% |
| 2007 | -17.9% | -30.9% | +13.0% |
| 2008 | +27.9% | +15.4% | +12.5% |
| 2009 | -8.4% | -22.1% | +13.7% |
| 2010 | +25.3% | +18.0% | +7.3% |
| 2011 | -18.6% | -20.9% | +2.2% |
| 2012 | -11.7% | -9.9% | -1.8% |
| 2013 | +7.7% | +2.6% | +5.1% |
| 2014 | +92.3% | +90.0% | +2.3% |
| 2015 | -11.7% | -23.6% | +11.9% |
| 2016 | +21.3% | +6.9% | +14.4% |
| 2017 | -0.1% | -13.2% | +13.1% |
| 2018 | +11.6% | +9.7% | +1.9% |
| 2019 | +7.5% | +1.5% | +5.9% |
| 2020 | +0.8% | +13.9% | -13.1% |
| 2021 | +12.5% | -3.2% | +15.8% |
| 2022 | +1.7% | -4.7% | +6.4% |
| 2023 | +5.6% | -7.6% | +13.2% |
| 2024 | +2.5% | +15.3% | -12.8% |
2006: the outlier that defines the backtest
+117.2%. That single year accounts for a huge portion of the strategy's lifetime return. China's pre-Olympics bull run sent everything higher, and sustainable dividend payers with strong fundamentals were at the center of it. Banks, infrastructure companies, and industrials preparing for 2008 Beijing Olympics spending all qualified under the sustainability screen. The SSE itself jumped +128.1% that year, so the screen actually trailed the index in 2006, but compounded harder over time thanks to better drawdown control elsewhere.
Without 2006 and 2014, the 25-year CAGR drops substantially. This is the fundamental problem with Chinese equity backtests: a small number of extreme years drive the aggregate result.
2007-2009: where the screen earned its keep
-17.9% in 2007, +27.9% in 2008, -8.4% in 2009. The SSE Composite fell -30.9% in 2007, +15.4% in 2008, and -22.1% in 2009. Across all three years, the sustainability screen outperformed the SSE by a combined +39.2%. The D/E filter and FCF coverage screens did their job: companies with strong balance sheets weathered the GFC era better than the broad index.
2014-2015: bubble and crash
+92.3% in 2014, -11.7% in 2015. The 2014 result was a broad China rally (the SSE was up +90.0%); the screen kept pace. The 2015 result was a roughly +12% outperformance during the summer crash, as quality dividend payers held up better than the speculative names that fueled the bubble.
2018-2023: persistent macro headwinds
The US-China trade war (2018), deleveraging campaigns, zero-COVID policy (2020-2022), and the property crisis all weighed on Chinese equities. The sustainability screen still managed positive absolute returns in most of these years and beat the SSE Composite in 4 of 6, but absolute compounding was modest.
Backtest Methodology
| Parameter | Choice |
|---|---|
| Universe | SHH + SHZ, Market Cap > 2B CNY (~$276M USD) |
| Signal | 5-component sustainability score (0-10), minimum 7 |
| Components | Payout Ratio + D/E + FCF Coverage + ROE + Piotroski F-Score |
| Filters | Dividend Yield > 2%, Market Cap > 2B CNY |
| Portfolio | Top 30 by score descending (yield tiebreak), equal weight |
| Rebalancing | Annual (July) |
| Cash rule | Hold cash if < 10 qualify |
| Benchmark | SSE Composite Index (CNY) |
| Execution | Next-day close (MOC after signal) |
| Period | 2000-2025 (25 years) |
| Data | Point-in-time (45-day lag for annual filings) |
| Costs | Size-tiered transaction costs applied |
| Piotroski | Computed from historical financial statements (9 binary signals) |
Limitations
Retail-driven market microstructure. Chinese A-share markets have a much higher retail investor share than developed markets. This creates momentum cycles, herding behavior, and volatility patterns that fundamental screens can't fully address. Quality premiums exist in China, but they're noisier.
Policy risk dominates. Government intervention in Chinese markets ranges from trading halts and margin restrictions to sector-specific regulatory crackdowns. No financial metric in the sustainability score captures these risks.
Accounting quality concerns. Chinese financial reporting standards have improved, but early-period data (2000-2005) may have inconsistencies in how payout ratios, free cash flow, and ROE were reported.
Extreme outlier years. The +117.2% in 2006 and +92.3% in 2014 materially influence the 25-year CAGR. The strategy's performance is less robust than the headline number suggests when you consider that removing those years changes the result substantially.
Currency risk. Returns are in local currency (CNY). For international investors, RMB/USD movements add another layer of volatility.
Survivorship bias. Exchange membership uses current company profiles. Delisted and acquired companies aren't fully captured.
Takeaway
The dividend sustainability screen on Chinese stocks produced 6.90% CAGR and beat the SSE Composite by 4.47% annually across 25 years. A 76% win rate against the local benchmark is the highest in our entire comparison. When framed correctly, China becomes a genuine outperformer.
The volatility (32.31%) remains the highest in our comparison. That's the real cost here. The quality of individual holdings is strong (8.9/10 average score) and the screen consistently outperforms the local market. But Chinese stocks move in ways that company-level fundamentals can't fully explain. Retail-driven sentiment, government interventions, and geopolitical shocks affect even the strongest balance sheets.
China's sustainable dividend payers deliver alpha over the local market. Extracting that alpha requires tolerating volatility that most investors won't stomach. The data supports the screen. The question is whether you can hold through the swings.
Part of a Series
This analysis is part of our dividend sustainability global exchange comparison. We tested the same screen on 12 exchanges worldwide: - [Dividend Sustainability on US Stocks (NYSE, NASDAQ, AMEX)][US_BLOG_URL] - 10.73% CAGR, full methodology - [Dividend Sustainability on Indian Stocks (NSE)][INDIA_BLOG_URL] - 15.86% CAGR, the standout - [Dividend Sustainability on Hong Kong Stocks (HKSE)][HONGKONG_BLOG_URL] - 6.64% CAGR - [Dividend Sustainability on Japanese Stocks (JPX)][JAPAN_BLOG_URL] - 5.55% CAGR - [Dividend Sustainability: Global Exchange Comparison][COMPARISON_BLOG_URL] - full comparison table
References
- DeAngelo, H., DeAngelo, L. & Skinner, D. (1992). "Dividends and Losses." Journal of Finance, 47(5), 1837-1863.
- Piotroski, J. (2000). "Value Investing: The Use of Historical Financial Statement Information to Separate Winners from Losers." Journal of Accounting Research, 38, 1-41.
- Carpenter, J., Lu, F. & Whitelaw, R. (2021). "The Real Value of China's Stock Market." Journal of Financial Economics, 139(3), 679-696.
Run This Screen Yourself
Via web UI: [Run the sustainability screen on Ceta Research][SUSTAINABILITY_CHINA_QUERY_URL]. The query is pre-loaded. Hit "Run" and see what passes today.
Via Python:
import requests, time

API_KEY = "your_api_key"  # get one at cetaresearch.com
BASE = "https://tradingstudio.finance/api/v1"

resp = requests.post(f"{BASE}/data-explorer/execute", headers={
    "X-API-Key": API_KEY, "Content-Type": "application/json"
}, json={
    "query": """
        WITH latest_ratios AS (
            SELECT r.symbol, r.dividendPayoutRatio, r.debtToEquityRatio,
                   r.dividendYield, r.date,
                ROW_NUMBER() OVER (PARTITION BY r.symbol ORDER BY r.date DESC) AS rn
            FROM financial_ratios r
            JOIN profile p ON r.symbol = p.symbol
            WHERE r.period = 'FY' AND r.dividendPayoutRatio > 0
              AND r.dividendYield IS NOT NULL
              AND p.exchange IN ('SHZ', 'SHH')
        ),
        latest_cf AS (
            SELECT c.symbol, c.freeCashFlow, c.commonDividendsPaid, c.date,
                ROW_NUMBER() OVER (PARTITION BY c.symbol ORDER BY c.date DESC) AS rn
            FROM cash_flow_statement c
            JOIN profile p ON c.symbol = p.symbol
            WHERE c.period = 'FY' AND c.commonDividendsPaid < 0
              AND p.exchange IN ('SHZ', 'SHH')
        ),
        latest_metrics AS (
            SELECT k.symbol, k.returnOnEquity, k.marketCap, k.date,
                ROW_NUMBER() OVER (PARTITION BY k.symbol ORDER BY k.date DESC) AS rn
            FROM key_metrics k
            JOIN profile p ON k.symbol = p.symbol
            WHERE k.period = 'FY' AND k.marketCap IS NOT NULL
              AND p.exchange IN ('SHZ', 'SHH')
        ),
        latest_scores AS (
            SELECT symbol, piotroskiScore FROM scores
        ),
        scored AS (
            SELECT r.symbol,
                CASE WHEN r.dividendPayoutRatio < 0.5 THEN 2
                     WHEN r.dividendPayoutRatio < 0.8 THEN 1 ELSE 0 END +
                CASE WHEN r.debtToEquityRatio >= 0 AND r.debtToEquityRatio < 0.5 THEN 2
                     WHEN r.debtToEquityRatio >= 0 AND r.debtToEquityRatio < 1.5 THEN 1
                     ELSE 0 END +
                CASE WHEN c.freeCashFlow > 0 AND c.commonDividendsPaid < 0
                     AND c.freeCashFlow / ABS(c.commonDividendsPaid) > 2 THEN 2
                     WHEN c.freeCashFlow > 0 AND c.commonDividendsPaid < 0
                     AND c.freeCashFlow / ABS(c.commonDividendsPaid) > 1 THEN 1
                     ELSE 0 END +
                CASE WHEN k.returnOnEquity > 0.15 THEN 2
                     WHEN k.returnOnEquity > 0.08 THEN 1 ELSE 0 END +
                COALESCE(CASE WHEN s.piotroskiScore >= 7 THEN 2
                     WHEN s.piotroskiScore >= 5 THEN 1 ELSE 0 END, 0)
                AS score,
                ROUND(r.dividendYield * 100, 2) AS yield_pct,
                ROUND(k.marketCap / 1e9, 1) AS mktcap_bn
            FROM latest_ratios r
            JOIN latest_cf c ON r.symbol = c.symbol AND c.rn = 1
            JOIN latest_metrics k ON r.symbol = k.symbol AND k.rn = 1
            LEFT JOIN latest_scores s ON r.symbol = s.symbol
            WHERE r.rn = 1 AND r.dividendYield > 0.02 AND k.marketCap > 2e9
        )
        SELECT symbol, score, yield_pct, mktcap_bn
        FROM scored WHERE score >= 7
        ORDER BY score DESC, yield_pct DESC LIMIT 30
    """,
    "options": {"format": "json", "limit": 100}
})
task_id = resp.json()["taskId"]

while True:
    result = requests.get(f"{BASE}/tasks/data-query/{task_id}",
                          headers={"X-API-Key": API_KEY}).json()
    if result["status"] in ("completed", "failed"):
        break
    time.sleep(2)

for r in result["result"]["rows"][:10]:
    print(f"{r['symbol']:8s} score={r['score']}/10 yield={r['yield_pct']:.1f}%")
Get your API key at cetaresearch.com. The full backtest code (Python + DuckDB) is on GitHub.
Data: Ceta Research, FMP financial data warehouse. Universe: SHH + SHZ. Annual rebalance (July), equal weight top 30 by sustainability score, 2000-2025.
Past performance does not guarantee future results. This is educational content, not investment advice.


