
Dividend Sustainability on Japanese Stocks: 5.55% CAGR, +2.24% Over the Nikkei
A 5-factor dividend sustainability score backtested on JPX from 2000-2025. 5.55% CAGR, +2.24% annual excess over the Nikkei 225, 60% win rate vs local benchmark. Seven cash years limited the absolute number, but the screen consistently beat Japan's own market.


Japan's dividend culture has changed dramatically over the past decade. Companies that once hoarded cash and paid token dividends are now returning capital at record rates. Corporate governance reforms, activist pressure, and the Tokyo Stock Exchange's own push to improve capital efficiency have all contributed.
Contents
- Method
- The Screen (SQL)
- What We Found
- 286% total return. +2.24% annual excess over the Nikkei 225.
- Year-by-year returns
- The Japan story: seven lost years, then consistent outperformance of the Nikkei
- The Abenomics inflection
- Backtest Methodology
- Limitations
- Takeaway
- Part of a Series
- References
- Run This Screen Yourself
We ran our 5-component sustainability score on JPX stocks from 2000 to 2025. The result: 5.55% CAGR and 286% total return. When benchmarked against the local Nikkei 225, which returned 3.31% over the same period, the strategy beats the local market by 2.24% per year. Seven cash years in the first decade are a big part of what held the absolute number down.
For details on the methodology, scoring components, and how the screen works on its strongest market (10.73% CAGR on US stocks), see our [US dividend sustainability analysis][US_BLOG_URL].
Data: FMP financial data warehouse, 2000–2025. Updated May 2026.
Method
Data source: Ceta Research (FMP financial data warehouse) Universe: JPX, market cap > 100B JPY (~$667M USD) Period: 2000-2025 (25 years, 25 annual periods) Rebalancing: Annual (July), equal weight top 30 by sustainability score descending (yield tiebreak) Benchmark: Nikkei 225 (JPY) Execution: Next-day close (market-on-close after signal) Cash rule: Hold cash if fewer than 10 stocks qualify Transaction costs: Size-tiered model (0.1-0.5% one-way based on market cap)
The sustainability score combines five components (0-2 points each, total 0-10): Payout Ratio, Debt/Equity, FCF Coverage, ROE, and Piotroski F-Score. Minimum score of 7 with yield above 2%. Full scoring methodology is in the [US blog][US_BLOG_URL].
The Screen (SQL)
WITH latest_ratios AS (
    SELECT r.symbol, r.dividendPayoutRatio, r.debtToEquityRatio,
           r.dividendYield, r.date,
        ROW_NUMBER() OVER (PARTITION BY r.symbol ORDER BY r.date DESC) AS rn
    FROM financial_ratios r
    JOIN profile p ON r.symbol = p.symbol
    WHERE r.period = 'FY'
      AND r.dividendPayoutRatio > 0
      AND r.dividendYield IS NOT NULL
      AND p.exchange IN ('JPX')
),
latest_cf AS (
    SELECT c.symbol, c.freeCashFlow, c.commonDividendsPaid, c.date,
        ROW_NUMBER() OVER (PARTITION BY c.symbol ORDER BY c.date DESC) AS rn
    FROM cash_flow_statement c
    JOIN profile p ON c.symbol = p.symbol
    WHERE c.period = 'FY'
      AND c.commonDividendsPaid < 0
      AND p.exchange IN ('JPX')
),
latest_metrics AS (
    SELECT k.symbol, k.returnOnEquity, k.marketCap, k.date,
        ROW_NUMBER() OVER (PARTITION BY k.symbol ORDER BY k.date DESC) AS rn
    FROM key_metrics k
    JOIN profile p ON k.symbol = p.symbol
    WHERE k.period = 'FY'
      AND k.marketCap IS NOT NULL
      AND p.exchange IN ('JPX')
),
latest_scores AS (
    SELECT symbol, piotroskiScore
    FROM scores
),
scored AS (
    SELECT r.symbol, r.date,
        ROUND(r.dividendPayoutRatio * 100, 1) AS payout_pct,
        ROUND(r.debtToEquityRatio, 2) AS debt_equity,
        ROUND(c.freeCashFlow / NULLIF(ABS(c.commonDividendsPaid), 0), 2) AS fcf_coverage,
        ROUND(k.returnOnEquity * 100, 1) AS roe_pct,
        s.piotroskiScore AS piotroski,
        ROUND(r.dividendYield * 100, 2) AS yield_pct,
        ROUND(k.marketCap / 1e9, 1) AS mktcap_bn,
        CASE WHEN r.dividendPayoutRatio < 0.5 THEN 2
             WHEN r.dividendPayoutRatio < 0.8 THEN 1 ELSE 0 END AS c_payout,
        CASE WHEN r.debtToEquityRatio >= 0 AND r.debtToEquityRatio < 0.5 THEN 2
             WHEN r.debtToEquityRatio >= 0 AND r.debtToEquityRatio < 1.5 THEN 1
             ELSE 0 END AS c_debt,
        CASE WHEN c.freeCashFlow > 0 AND c.commonDividendsPaid < 0
                  AND c.freeCashFlow / ABS(c.commonDividendsPaid) > 2 THEN 2
             WHEN c.freeCashFlow > 0 AND c.commonDividendsPaid < 0
                  AND c.freeCashFlow / ABS(c.commonDividendsPaid) > 1 THEN 1
             ELSE 0 END AS c_fcf,
        CASE WHEN k.returnOnEquity > 0.15 THEN 2
             WHEN k.returnOnEquity > 0.08 THEN 1 ELSE 0 END AS c_roe,
        CASE WHEN s.piotroskiScore >= 7 THEN 2
             WHEN s.piotroskiScore >= 5 THEN 1 ELSE 0 END AS c_piotroski
    FROM latest_ratios r
    JOIN latest_cf c ON r.symbol = c.symbol AND c.rn = 1
    JOIN latest_metrics k ON r.symbol = k.symbol AND k.rn = 1
    LEFT JOIN latest_scores s ON r.symbol = s.symbol
    WHERE r.rn = 1
      AND r.dividendYield > 0.02
      AND k.marketCap > 100e9
)
SELECT symbol, date, payout_pct, debt_equity, fcf_coverage, roe_pct, piotroski,
       yield_pct, mktcap_bn,
       c_payout + c_debt + c_fcf + c_roe + COALESCE(c_piotroski, 0) AS sustainability_score,
       c_payout, c_debt, c_fcf, c_roe, COALESCE(c_piotroski, 0) AS c_piotroski
FROM scored
WHERE c_payout + c_debt + c_fcf + c_roe + COALESCE(c_piotroski, 0) >= 7
ORDER BY sustainability_score DESC, yield_pct DESC
LIMIT 30
[Run this query on Ceta Research][SUSTAINABILITY_JAPAN_QUERY_URL]
What We Found
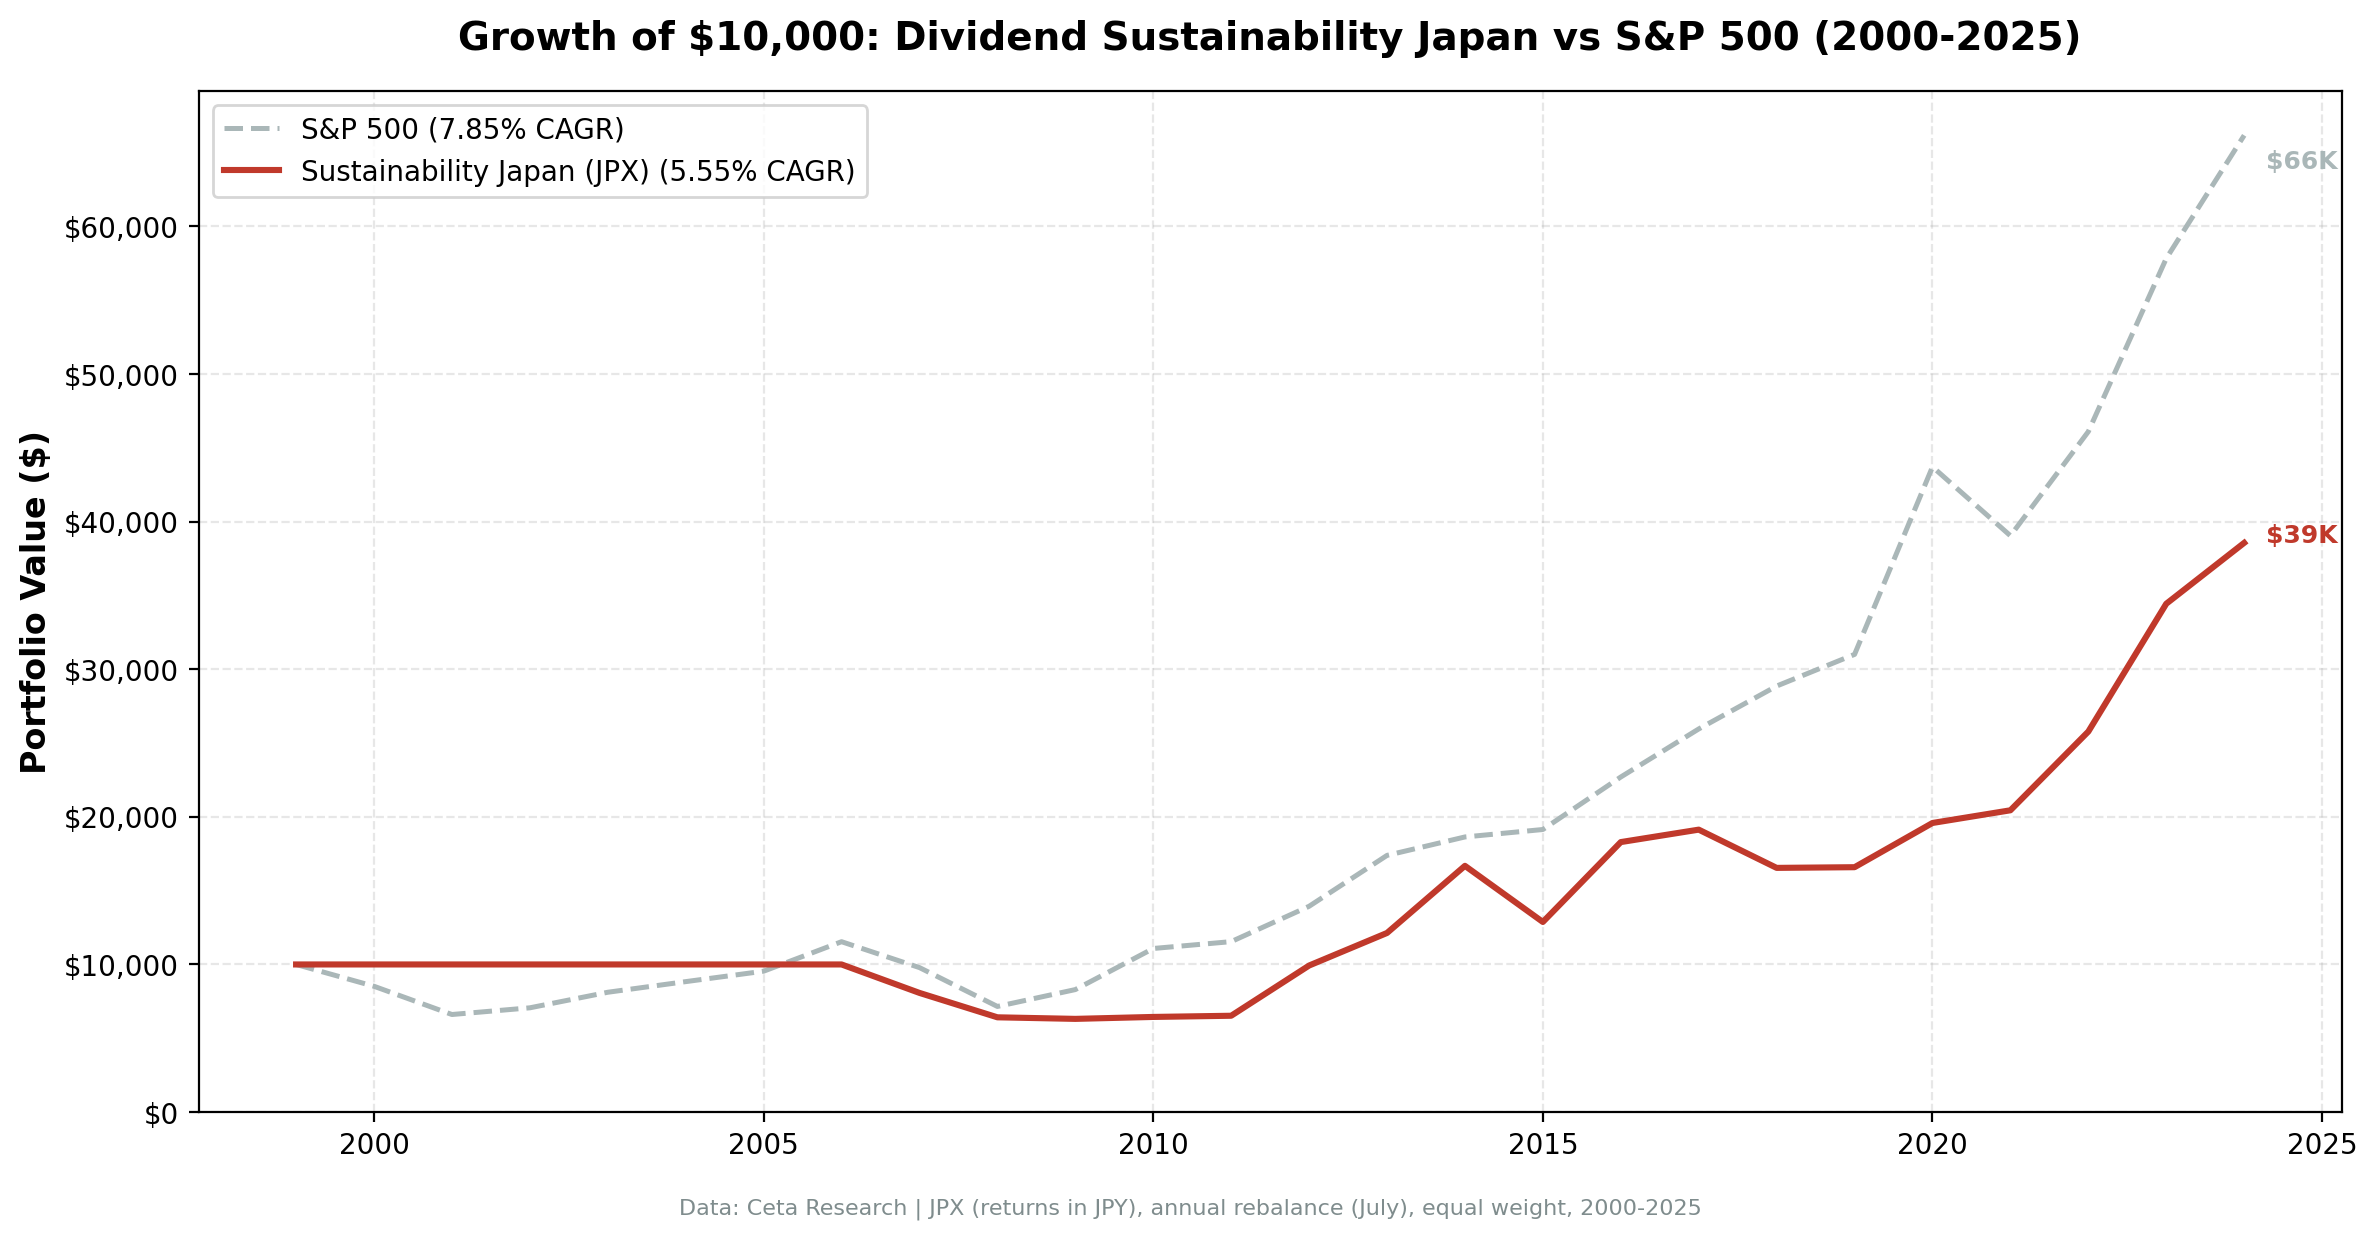
286% total return. +2.24% annual excess over the Nikkei 225.
| Metric | Sustainability (Japan) | Nikkei 225 |
|---|---|---|
| CAGR | 5.55% | 3.31% |
| Total Return | 286% | - |
| Volatility | 19.29% | - |
| Max Drawdown | -36.86% | - |
| Sharpe Ratio | 0.282 | - |
| Sortino Ratio | 0.701 | - |
| Win Rate (annual) | 60% | - |
| Down Capture | 38.4% | - |
| Up Capture | 80.9% | - |
| Beta | 0.684 | - |
| Alpha | 3.25% | - |
| Avg Stocks per Period | 28.6 | - |
| Cash Periods | 7 of 25 | - |
| Avg Sustainability Score | 8.6/10 | - |
When benchmarked against the local Nikkei 225 (3.31% CAGR), the strategy beats the Japanese market by 2.24% annually with a 60% win rate and 3.25% Jensen alpha.
Seven cash years drag the absolute CAGR down. From 2000 to 2006, the screen couldn't find 10 qualifying Japanese stocks in most years (only 2005 cleared the bar). That's seven years of zero return while the market was doing whatever it was doing. Japanese companies in that era simply didn't have the dividend culture or financial transparency the score requires. Down capture at 38.4% means the portfolio absorbed under half of the Nikkei's losing-year declines.
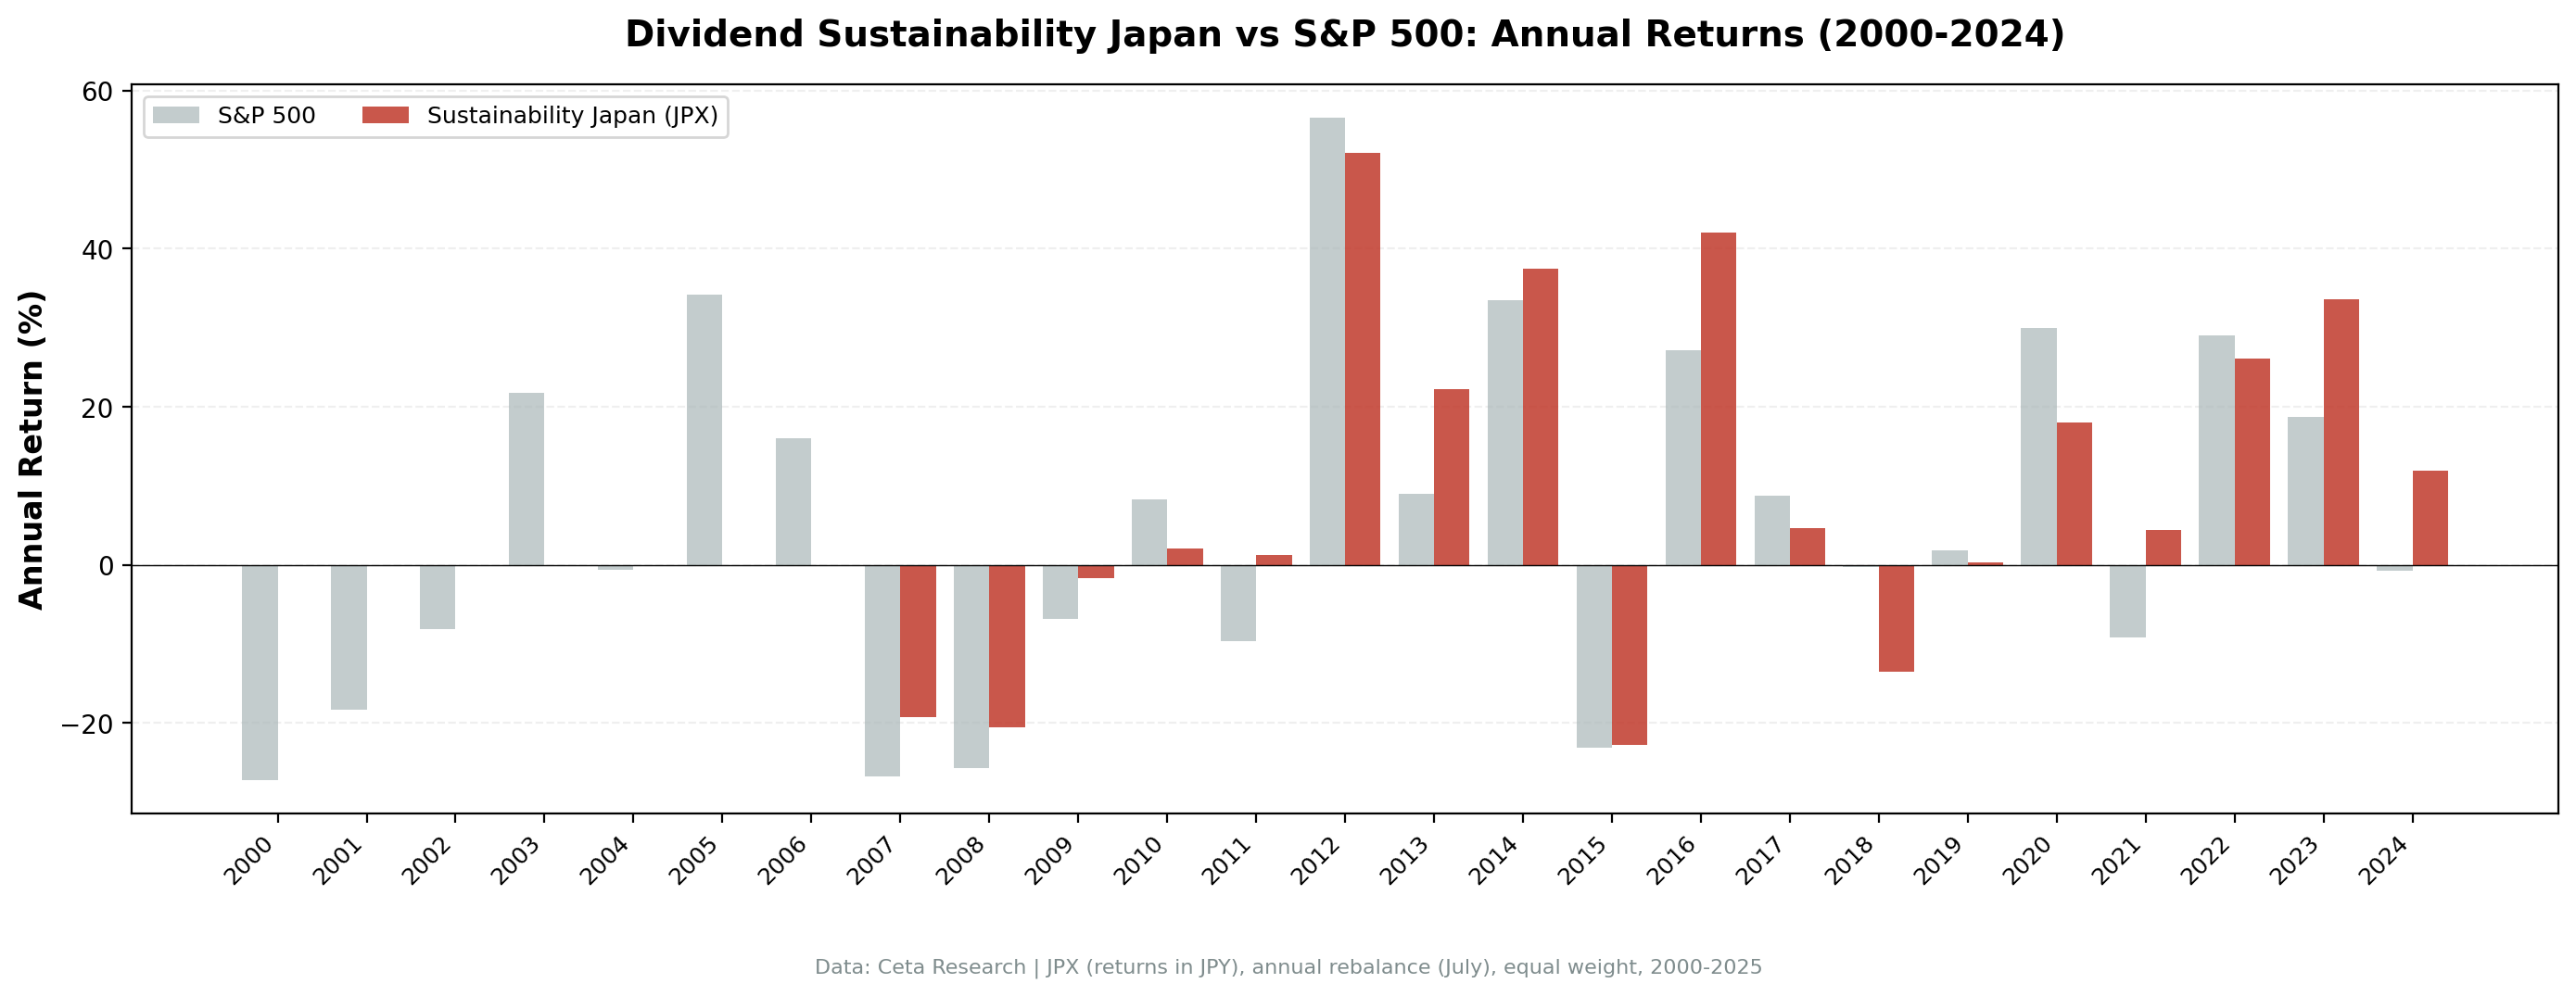
Year-by-year returns
| Year | Sustainability | Nikkei 225 | Excess |
|---|---|---|---|
| 2000 | 0.0% (cash) | -27.2% | +27.2% |
| 2001 | 0.0% (cash) | -18.3% | +18.3% |
| 2002 | 0.0% (cash) | -8.1% | +8.1% |
| 2003 | 0.0% (cash) | +21.8% | -21.8% |
| 2004 | 0.0% (cash) | -0.6% | +0.6% |
| 2005 | 0.0% (cash) | +34.2% | -34.2% |
| 2006 | 0.0% (cash) | +16.0% | -16.0% |
| 2007 | -19.3% | -26.8% | +7.5% |
| 2008 | -20.5% | -25.7% | +5.2% |
| 2009 | -1.7% | -6.8% | +5.2% |
| 2010 | +2.1% | +8.3% | -6.2% |
| 2011 | +1.3% | -9.7% | +10.9% |
| 2012 | +52.1% | +56.6% | -4.5% |
| 2013 | +22.2% | +9.0% | +13.2% |
| 2014 | +37.5% | +33.5% | +4.0% |
| 2015 | -22.8% | -23.1% | +0.3% |
| 2016 | +42.0% | +27.1% | +14.9% |
| 2017 | +4.6% | +8.8% | -4.1% |
| 2018 | -13.5% | -0.3% | -13.3% |
| 2019 | +0.3% | +1.8% | -1.5% |
| 2020 | +18.1% | +30.0% | -11.9% |
| 2021 | +4.4% | -9.1% | +13.5% |
| 2022 | +26.1% | +29.1% | -3.0% |
| 2023 | +33.6% | +18.7% | +14.9% |
| 2024 | +12.0% | -0.8% | +12.8% |
The Japan story: seven lost years, then consistent outperformance of the Nikkei
The story splits cleanly into two eras.
2000-2006: The dead zone. Seven cash years in a row. Japanese corporate culture in this period prioritized balance sheet hoarding over shareholder returns. Dividend yields were minimal, payout ratios were low not because of discipline but because companies barely paid dividends at all. The screen couldn't find 10 stocks scoring 7+ with yields above 2%.
2012-2016: When Japan worked, it worked big. The screen posted +52.1% in 2012, +37.5% in 2014, and +42.0% in 2016. These massive single-year returns came from Abenomics-era reforms that pushed Japanese companies toward higher dividends, share buybacks, and better capital allocation. Sustainable dividend payers in Japan were suddenly a compelling category. The screen captured that shift.
2015 and 2018: Currency and macro shocks. The -22.8% in 2015 and -13.5% in 2018 reflect yen volatility and global risk-off periods that hit export-heavy Japanese dividend payers. Japan's market is uniquely sensitive to currency swings because so many large-cap companies derive revenue overseas.
2020: Lagging the Nikkei. +18.1% vs the Nikkei's +30.0%. Japanese sustainability stocks came back from COVID more modestly than the broader market. Defensive dividend payers underperformed the growth-and-tech-led recovery rally.
The Abenomics inflection
The most telling pattern is the shift from 2012 onward. From 2012 to 2024 (13 years), the strategy posted only three negative years and four 20-40%+ gains. Japan's corporate governance revolution created the dividend universe that the sustainability screen needs. The first decade's weakness isn't a failure of the strategy. It's a reflection of a market that didn't have enough qualifying stocks.
Backtest Methodology
| Parameter | Choice |
|---|---|
| Universe | JPX, Market Cap > 100B JPY (~$667M USD) |
| Signal | 5-component sustainability score (0-10), minimum 7 |
| Components | Payout Ratio + D/E + FCF Coverage + ROE + Piotroski F-Score |
| Filters | Dividend Yield > 2%, Market Cap > 100B JPY |
| Portfolio | Top 30 by score descending (yield tiebreak), equal weight |
| Rebalancing | Annual (July) |
| Cash rule | Hold cash if < 10 qualify |
| Benchmark | Nikkei 225 (JPY) |
| Execution | Next-day close (MOC after signal) |
| Period | 2000-2025 (25 years) |
| Data | Point-in-time (45-day lag for annual filings) |
| Costs | Size-tiered transaction costs applied |
| Piotroski | Computed from historical financial statements (9 binary signals) |
Limitations
Seven cash years dominate the result. The backtest is really an 18-year test with 7 years of zero return. Comparing a strategy that was invested for 18 years against a benchmark invested for 25 is inherently unfair to the strategy. If you started this screen in 2007 instead of 2000, the numbers look quite different.
Currency risk isn't hedged. Returns are in local currency terms. A US-based investor would face JPY/USD conversion effects that could add or subtract several percentage points per year.
JPX exchange coverage. FMP data for Japanese stocks improved over time. Early-period data may have gaps in financial ratios, cash flow statements, or Piotroski components.
Sector concentration risk. Japanese dividend payers cluster in autos, trading houses, and industrials. The screen doesn't balance sectors, so cyclical downturns hit hard (2015, 2018).
Survivorship bias. Exchange membership uses current company profiles. Delisted and acquired companies aren't fully captured.
Takeaway
The dividend sustainability screen on Japan produced 5.55% CAGR and beat the Nikkei 225 by 2.24% annually. When you use the local benchmark, Japan is a genuine outperformer with 3.25% Jensen alpha. Seven cash years early on dragged the absolute number down. The 18 invested years produced results that topped the local index (60% win rate).
Since 2012, the story is stronger. Abenomics-era governance reforms created a real dividend ecosystem in Japan. The screen's performance from 2012 onward, with multiple 20-40% years and only three negative periods, shows the strategy is well-suited to modern Japan. An investor starting in the post-reform era would have a stronger 25-year number.
The 38.4% down capture and 0.701 Sortino ratio are real strengths. For an investor already allocated to Japanese equities, adding a sustainability overlay reduces downside risk and adds alpha over the local benchmark.
Part of a Series
This analysis is part of our dividend sustainability global exchange comparison. We tested the same screen on 12 exchanges worldwide: - [Dividend Sustainability on US Stocks (NYSE, NASDAQ, AMEX)][US_BLOG_URL] - 10.73% CAGR, full methodology - [Dividend Sustainability on Indian Stocks (NSE)][INDIA_BLOG_URL] - 15.86% CAGR, the standout - [Dividend Sustainability on German Stocks (XETRA)][GERMANY_BLOG_URL] - 12.27% CAGR - [Dividend Sustainability on Hong Kong Stocks (HKSE)][HONGKONG_BLOG_URL] - 6.64% CAGR - [Dividend Sustainability: Global Exchange Comparison][COMPARISON_BLOG_URL] - full comparison table
References
- DeAngelo, H., DeAngelo, L. & Skinner, D. (1992). "Dividends and Losses." Journal of Finance, 47(5), 1837-1863.
- Piotroski, J. (2000). "Value Investing: The Use of Historical Financial Statement Information to Separate Winners from Losers." Journal of Accounting Research, 38, 1-41.
- Aoyagi, C. & Ganelli, G. (2014). "Unstash the Cash! Corporate Governance Reform in Japan." IMF Working Paper, WP/14/140.
Run This Screen Yourself
Via web UI: [Run the sustainability screen on Ceta Research][SUSTAINABILITY_JAPAN_QUERY_URL]. The query is pre-loaded. Hit "Run" and see what passes today.
Via Python:
import requests, time

API_KEY = "your_api_key"  # get one at cetaresearch.com
BASE = "https://tradingstudio.finance/api/v1"

resp = requests.post(f"{BASE}/data-explorer/execute", headers={
    "X-API-Key": API_KEY, "Content-Type": "application/json"
}, json={
    "query": """
        WITH latest_ratios AS (
            SELECT r.symbol, r.dividendPayoutRatio, r.debtToEquityRatio,
                   r.dividendYield, r.date,
                ROW_NUMBER() OVER (PARTITION BY r.symbol ORDER BY r.date DESC) AS rn
            FROM financial_ratios r
            JOIN profile p ON r.symbol = p.symbol
            WHERE r.period = 'FY' AND r.dividendPayoutRatio > 0
              AND r.dividendYield IS NOT NULL
              AND p.exchange IN ('JPX')
        ),
        latest_cf AS (
            SELECT c.symbol, c.freeCashFlow, c.commonDividendsPaid, c.date,
                ROW_NUMBER() OVER (PARTITION BY c.symbol ORDER BY c.date DESC) AS rn
            FROM cash_flow_statement c
            JOIN profile p ON c.symbol = p.symbol
            WHERE c.period = 'FY' AND c.commonDividendsPaid < 0
              AND p.exchange IN ('JPX')
        ),
        latest_metrics AS (
            SELECT k.symbol, k.returnOnEquity, k.marketCap, k.date,
                ROW_NUMBER() OVER (PARTITION BY k.symbol ORDER BY k.date DESC) AS rn
            FROM key_metrics k
            JOIN profile p ON k.symbol = p.symbol
            WHERE k.period = 'FY' AND k.marketCap IS NOT NULL
              AND p.exchange IN ('JPX')
        ),
        latest_scores AS (
            SELECT symbol, piotroskiScore FROM scores
        ),
        scored AS (
            SELECT r.symbol,
                CASE WHEN r.dividendPayoutRatio < 0.5 THEN 2
                     WHEN r.dividendPayoutRatio < 0.8 THEN 1 ELSE 0 END +
                CASE WHEN r.debtToEquityRatio >= 0 AND r.debtToEquityRatio < 0.5 THEN 2
                     WHEN r.debtToEquityRatio >= 0 AND r.debtToEquityRatio < 1.5 THEN 1
                     ELSE 0 END +
                CASE WHEN c.freeCashFlow > 0 AND c.commonDividendsPaid < 0
                     AND c.freeCashFlow / ABS(c.commonDividendsPaid) > 2 THEN 2
                     WHEN c.freeCashFlow > 0 AND c.commonDividendsPaid < 0
                     AND c.freeCashFlow / ABS(c.commonDividendsPaid) > 1 THEN 1
                     ELSE 0 END +
                CASE WHEN k.returnOnEquity > 0.15 THEN 2
                     WHEN k.returnOnEquity > 0.08 THEN 1 ELSE 0 END +
                COALESCE(CASE WHEN s.piotroskiScore >= 7 THEN 2
                     WHEN s.piotroskiScore >= 5 THEN 1 ELSE 0 END, 0)
                AS score,
                ROUND(r.dividendYield * 100, 2) AS yield_pct,
                ROUND(k.marketCap / 1e9, 1) AS mktcap_bn
            FROM latest_ratios r
            JOIN latest_cf c ON r.symbol = c.symbol AND c.rn = 1
            JOIN latest_metrics k ON r.symbol = k.symbol AND k.rn = 1
            LEFT JOIN latest_scores s ON r.symbol = s.symbol
            WHERE r.rn = 1 AND r.dividendYield > 0.02 AND k.marketCap > 100e9
        )
        SELECT symbol, score, yield_pct, mktcap_bn
        FROM scored WHERE score >= 7
        ORDER BY score DESC, yield_pct DESC LIMIT 30
    """,
    "options": {"format": "json", "limit": 100}
})
task_id = resp.json()["taskId"]

while True:
    result = requests.get(f"{BASE}/tasks/data-query/{task_id}",
                          headers={"X-API-Key": API_KEY}).json()
    if result["status"] in ("completed", "failed"):
        break
    time.sleep(2)

for r in result["result"]["rows"][:10]:
    print(f"{r['symbol']:8s} score={r['score']}/10 yield={r['yield_pct']:.1f}%")
Get your API key at cetaresearch.com. The full backtest code (Python + DuckDB) is on GitHub.
Data: Ceta Research, FMP financial data warehouse. Universe: JPX. Annual rebalance (July), equal weight top 30 by sustainability score, 2000-2025.
Past performance does not guarantee future results. This is educational content, not investment advice.


