
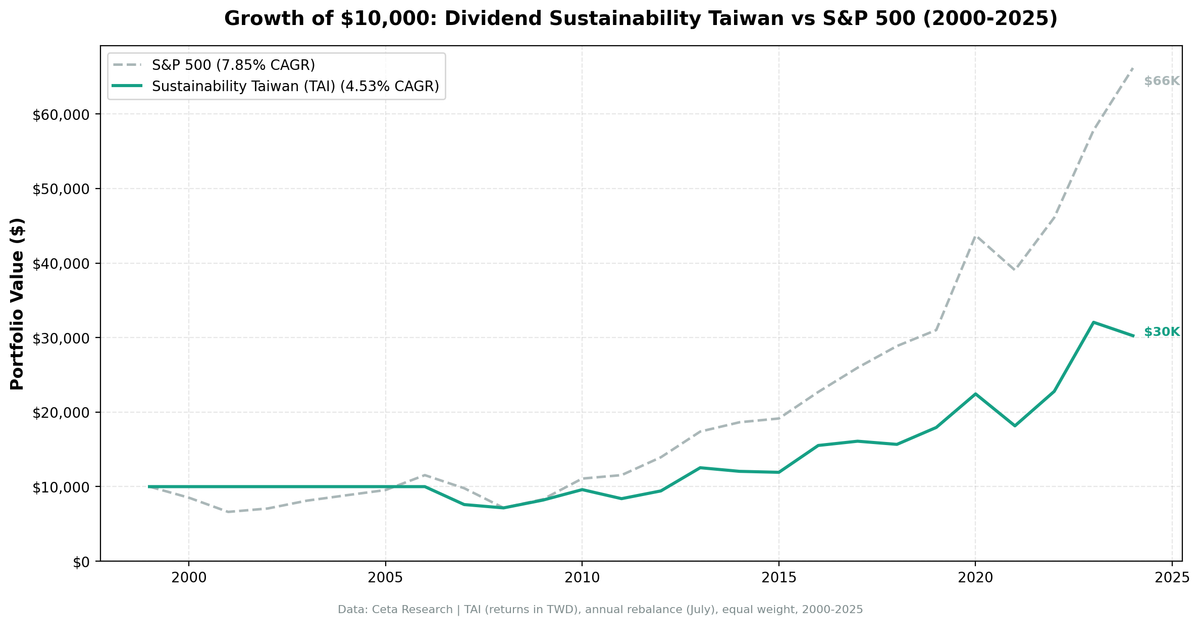
Dividend Sustainability on Taiwanese Stocks: 4.53% CAGR, Marginally Beats TAIEX
A 5-factor dividend sustainability score backtested on TWSE from 2000-2025. 4.53% CAGR, +0.44% annual excess over TAIEX, 52% win rate. Seven cash years and a tech-heavy market structure made Taiwan the hardest exchange for this approach.

Taiwan's stock market is built around semiconductors. TSMC alone accounts for roughly 30% of the TWSE's market cap, and the broader supply chain (packaging, testing, design houses, substrate makers) fills out much of the rest. This creates a problem for a dividend sustainability screen: the companies that dominate Taiwan's market are growth-oriented tech firms. The ones that pay meaningful dividends tend to be the slower-growing parts of the supply chain.
Contents
- Method
- The Screen (SQL)
- What We Found
- 203% total return. Seven cash years. Marginal winner vs TAIEX (+0.44%).
- Year-by-year returns
- 2000-2006: seven consecutive cash years
- 2007-2008: late start, rough entry
- 2013: the best year of excess
- 2010-2018: the tech mismatch problem
- 2020-2024: semiconductor boom that bypassed dividend payers
- Why Taiwan ranks last
- Backtest Methodology
- Limitations
- Takeaway
- Part of a Series
- References
- Run This Screen Yourself
We ran our 5-component sustainability score on TWSE stocks from 2000 to 2025. The result: 4.53% CAGR and 203% total return. When benchmarked against the local TAIEX (which returned 4.09% CAGR over the same period), the strategy edges the local market by +0.44% per year. That's marginal, and the 52% win rate confirms it: Taiwan is genuinely difficult territory for this screen. Seven cash years (the most of any exchange tested) gutted compounding. When the strategy was invested, it averaged 28.5 stocks with a high average score of 8.7/10. The stocks that passed were genuinely strong on fundamentals. The market structure works against the strategy.
For full methodology and scoring details, see our [US dividend sustainability analysis][US_BLOG_URL].
Data: FMP financial data warehouse, 2000-2025. Updated May 2026.
Method
Data source: Ceta Research (FMP financial data warehouse) Universe: TWSE (TAI), market cap > 10B TWD (~$312M USD) Period: 2000-2025 (25 years, 25 annual periods) Rebalancing: Annual (July), equal weight top 30 by sustainability score descending (yield tiebreak) Benchmark: TAIEX (Taiwan Stock Exchange Capitalization Weighted Index, TWD) Execution: Next-day close (market-on-close after signal) Cash rule: Hold cash if fewer than 10 stocks qualify Transaction costs: Size-tiered model (0.1-0.5% one-way based on market cap)
The sustainability score combines five components (0-2 points each, total 0-10): Payout Ratio, Debt/Equity, FCF Coverage, ROE, and Piotroski F-Score. Minimum score of 7 with yield above 2%. Full scoring methodology is in the [US blog][US_BLOG_URL].
The Screen (SQL)
WITH latest_ratios AS (
    SELECT r.symbol, r.dividendPayoutRatio, r.debtToEquityRatio,
           r.dividendYield, r.date,
        ROW_NUMBER() OVER (PARTITION BY r.symbol ORDER BY r.date DESC) AS rn
    FROM financial_ratios r
    JOIN profile p ON r.symbol = p.symbol
    WHERE r.period = 'FY'
      AND r.dividendPayoutRatio > 0
      AND r.dividendYield IS NOT NULL
      AND p.exchange IN ('TAI')
),
latest_cf AS (
    SELECT c.symbol, c.freeCashFlow, c.commonDividendsPaid, c.date,
        ROW_NUMBER() OVER (PARTITION BY c.symbol ORDER BY c.date DESC) AS rn
    FROM cash_flow_statement c
    JOIN profile p ON c.symbol = p.symbol
    WHERE c.period = 'FY'
      AND c.commonDividendsPaid < 0
      AND p.exchange IN ('TAI')
),
latest_metrics AS (
    SELECT k.symbol, k.returnOnEquity, k.marketCap, k.date,
        ROW_NUMBER() OVER (PARTITION BY k.symbol ORDER BY k.date DESC) AS rn
    FROM key_metrics k
    JOIN profile p ON k.symbol = p.symbol
    WHERE k.period = 'FY'
      AND k.marketCap IS NOT NULL
      AND p.exchange IN ('TAI')
),
latest_scores AS (
    SELECT symbol, piotroskiScore
    FROM scores
),
scored AS (
    SELECT r.symbol, r.date,
        ROUND(r.dividendPayoutRatio * 100, 1) AS payout_pct,
        ROUND(r.debtToEquityRatio, 2) AS debt_equity,
        ROUND(c.freeCashFlow / NULLIF(ABS(c.commonDividendsPaid), 0), 2) AS fcf_coverage,
        ROUND(k.returnOnEquity * 100, 1) AS roe_pct,
        s.piotroskiScore AS piotroski,
        ROUND(r.dividendYield * 100, 2) AS yield_pct,
        ROUND(k.marketCap / 1e9, 1) AS mktcap_bn,
        CASE WHEN r.dividendPayoutRatio < 0.5 THEN 2
             WHEN r.dividendPayoutRatio < 0.8 THEN 1 ELSE 0 END AS c_payout,
        CASE WHEN r.debtToEquityRatio >= 0 AND r.debtToEquityRatio < 0.5 THEN 2
             WHEN r.debtToEquityRatio >= 0 AND r.debtToEquityRatio < 1.5 THEN 1
             ELSE 0 END AS c_debt,
        CASE WHEN c.freeCashFlow > 0 AND c.commonDividendsPaid < 0
                  AND c.freeCashFlow / ABS(c.commonDividendsPaid) > 2 THEN 2
             WHEN c.freeCashFlow > 0 AND c.commonDividendsPaid < 0
                  AND c.freeCashFlow / ABS(c.commonDividendsPaid) > 1 THEN 1
             ELSE 0 END AS c_fcf,
        CASE WHEN k.returnOnEquity > 0.15 THEN 2
             WHEN k.returnOnEquity > 0.08 THEN 1 ELSE 0 END AS c_roe,
        CASE WHEN s.piotroskiScore >= 7 THEN 2
             WHEN s.piotroskiScore >= 5 THEN 1 ELSE 0 END AS c_piotroski
    FROM latest_ratios r
    JOIN latest_cf c ON r.symbol = c.symbol AND c.rn = 1
    JOIN latest_metrics k ON r.symbol = k.symbol AND k.rn = 1
    LEFT JOIN latest_scores s ON r.symbol = s.symbol
    WHERE r.rn = 1
      AND r.dividendYield > 0.02
      AND k.marketCap > 10e9
)
SELECT symbol, date, payout_pct, debt_equity, fcf_coverage, roe_pct, piotroski,
       yield_pct, mktcap_bn,
       c_payout + c_debt + c_fcf + c_roe + COALESCE(c_piotroski, 0) AS sustainability_score,
       c_payout, c_debt, c_fcf, c_roe, COALESCE(c_piotroski, 0) AS c_piotroski
FROM scored
WHERE c_payout + c_debt + c_fcf + c_roe + COALESCE(c_piotroski, 0) >= 7
ORDER BY sustainability_score DESC, yield_pct DESC
LIMIT 30
[Run this query on Ceta Research][SUSTAINABILITY_TAIWAN_QUERY_URL]
What We Found

203% total return. Seven cash years. Marginal winner vs TAIEX (+0.44%).
| Metric | Sustainability (Taiwan) | TAIEX |
|---|---|---|
| CAGR | 4.53% | 4.09% |
| Total Return | 203% | - |
| Volatility | 16.09% | - |
| Max Drawdown | -28.55% | - |
| Sharpe Ratio | 0.219 | - |
| Sortino Ratio | 0.479 | - |
| Win Rate (annual) | 52% | - |
| Down Capture | 63.1% | - |
| Up Capture | 82.1% | - |
| Beta | 0.607 | - |
| Alpha | 1.65% | - |
| Avg Stocks per Period | 28.5 | - |
| Cash Periods | 7 of 25 | - |
| Avg Sustainability Score | 8.7/10 | - |
Against the local TAIEX (4.09% CAGR), the strategy edges ahead by 0.44% annually with a 52% win rate. That's not compelling alpha. The screen's advantage over the local market is marginal. But it does show the quality filter isn't destroying value on this exchange.
Seven cash periods (2000-2006) are the most of any exchange we tested. The max drawdown of -28.55% is better than many exchanges in the series. Down capture of 63.1% and up capture of 82.1% show some asymmetry in the right direction, but modest.
When invested, the portfolio averaged 28.5 stocks per period (the highest in our comparison) with an average sustainability score of 8.7/10. High-quality companies exist in Taiwan. The market structure just makes outperformance hard for a dividend-focused approach.
Year-by-year returns
| Year | Sustainability | TAIEX | Excess |
|---|---|---|---|
| 2000 | 0.0% (cash) | - | 0.0% |
| 2001 | 0.0% (cash) | - | 0.0% |
| 2002 | 0.0% (cash) | - | 0.0% |
| 2003 | 0.0% (cash) | - | 0.0% |
| 2004 | 0.0% (cash) | - | 0.0% |
| 2005 | 0.0% (cash) | - | 0.0% |
| 2006 | 0.0% (cash) | - | 0.0% |
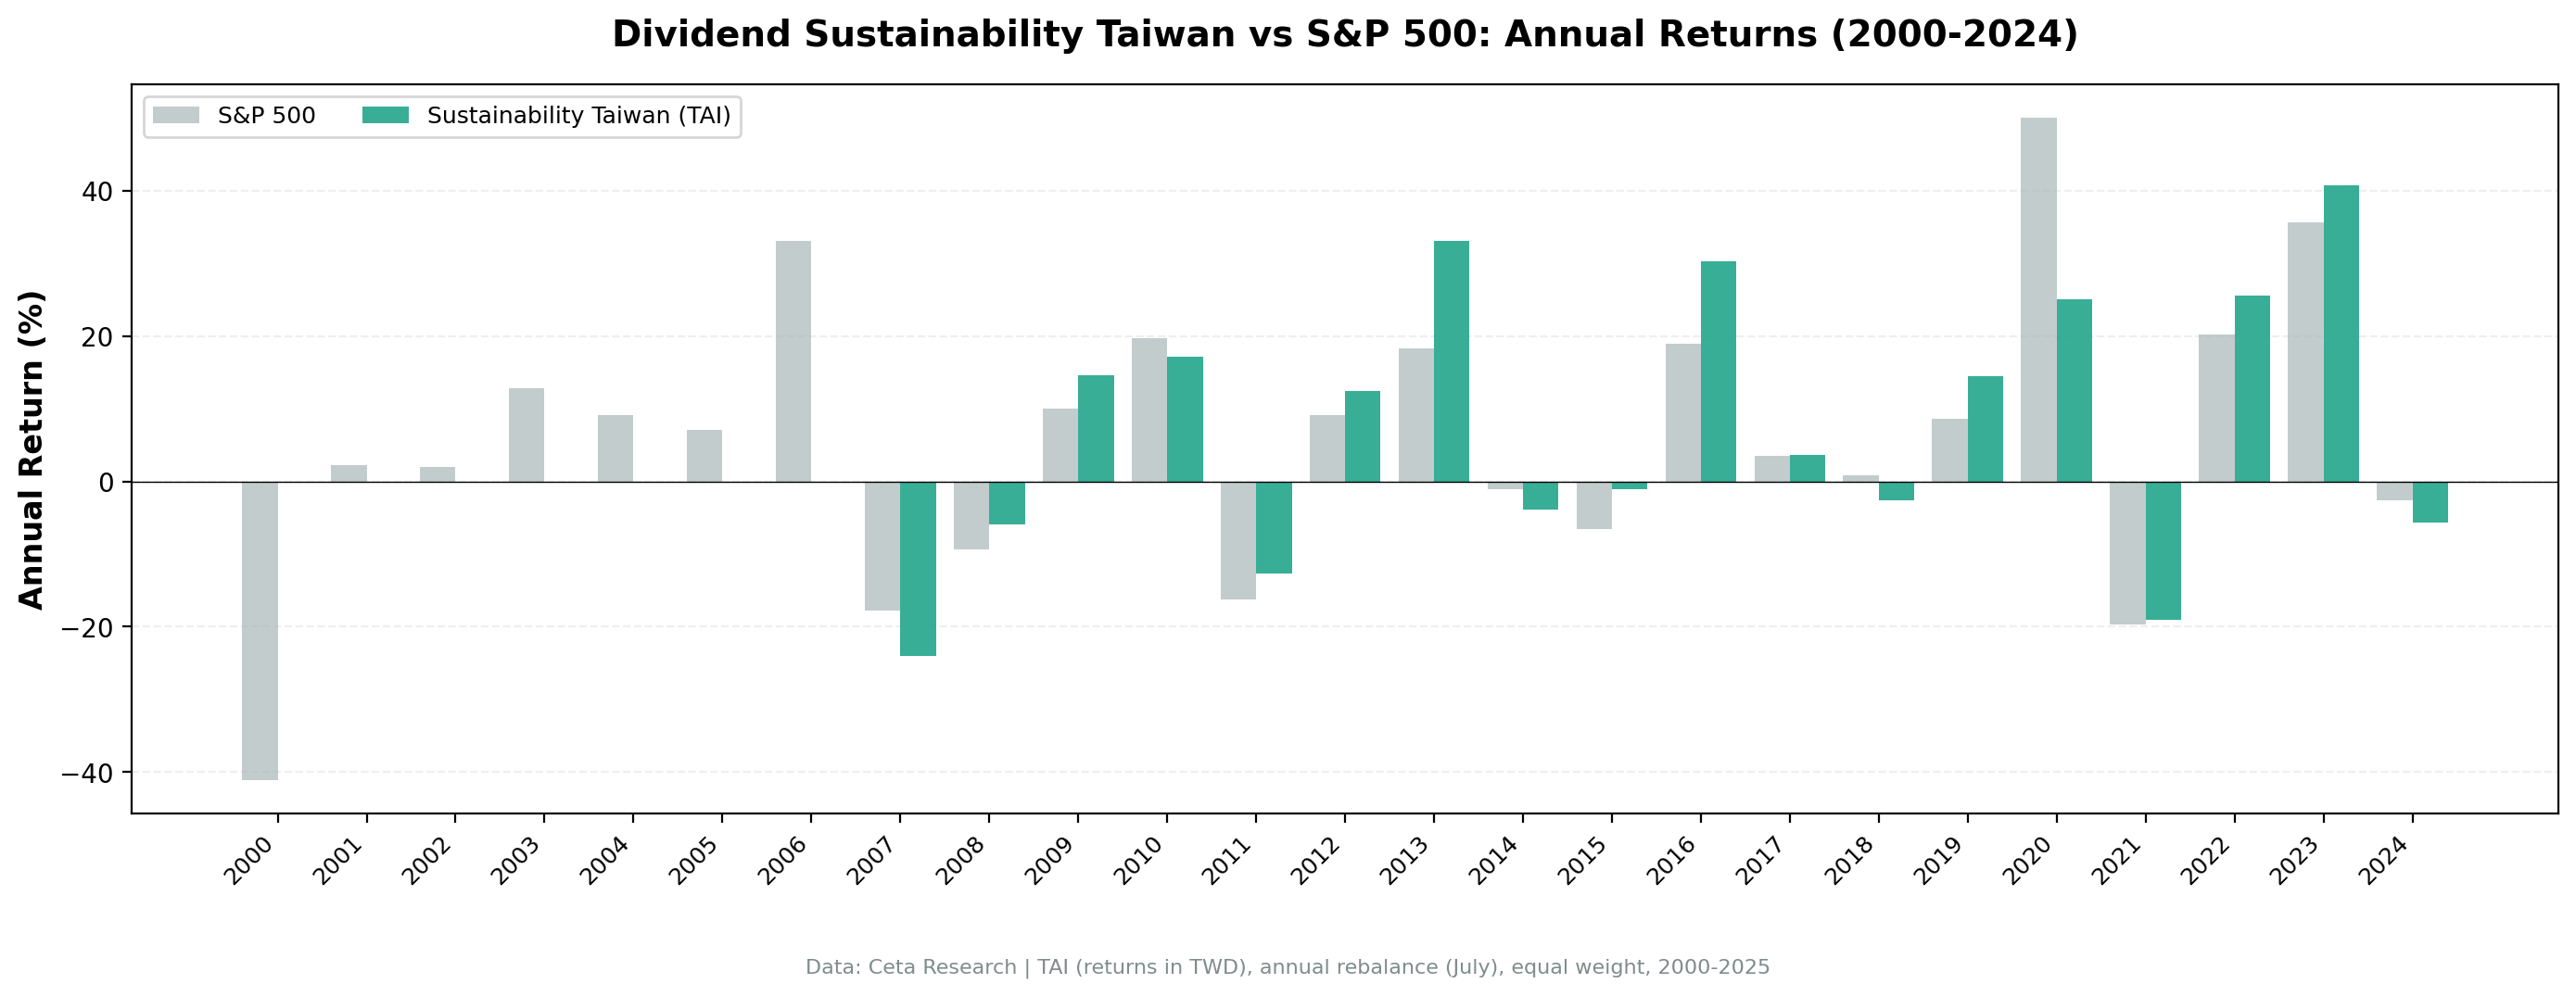
| 2007 | -24.1% | -17.7% | -6.3% |
| 2008 | -5.9% | -9.3% | +3.4% |
| 2009 | +14.6% | +9.9% | +4.7% |
| 2010 | +17.2% | +19.7% | -2.5% |
| 2011 | -12.6% | -16.3% | +3.7% |
| 2012 | +12.4% | +9.1% | +3.3% |
| 2013 | +33.0% | +18.3% | +14.7% |
| 2014 | -3.9% | -1.1% | -2.8% |
| 2015 | -1.1% | -6.6% | +5.5% |
| 2016 | +30.2% | +18.9% | +11.4% |
| 2017 | +3.7% | +3.5% | +0.2% |
| 2018 | -2.6% | +0.8% | -3.5% |
| 2019 | +14.5% | +8.7% | +5.8% |
| 2020 | +25.1% | +50.0% | -24.9% |
| 2021 | -19.1% | -19.7% | +0.6% |
| 2022 | +25.5% | +20.2% | +5.3% |
| 2023 | +40.7% | +35.6% | +5.0% |
| 2024 | -5.6% | -2.6% | -3.0% |
2000-2006: seven consecutive cash years
FMP data coverage for TWSE stocks was limited in the early 2000s. The screen couldn't find 10 qualifying stocks with complete financial ratios, cash flow statements, and Piotroski inputs. Seven years of zero return while the TAIEX was moving.
The cash years were a mixed bag for the strategy. They protected against losing years but cost recovery upside in 2003-2006.
2007-2008: late start, rough entry
The strategy first deployed capital in 2007 and immediately faced a -24.1% drop. 2008's -5.9% was actually better than the TAIEX's -9.3%, so the screen earned its first real win during the financial crisis. The early data coverage drag and the rough debut year set the tone for an uphill 18-year run.
2013: the best year of excess
+33.0% vs the TAIEX's +18.3% in 2013. This was the best single year of excess return (+14.7%) in the backtest. Companies that qualified under the sustainability screen, mostly mature semiconductor and electronics firms, surged on global chip demand.
2010-2018: the tech mismatch problem
The issue is structural. Taiwan's highest-growth companies (TSMC, MediaTek) reinvest in capex rather than paying fat dividends. The companies that meet the sustainability screen's yield and payout requirements are the lower-growth parts of the supply chain: passive component makers, connectors, PCB manufacturers. They're solid businesses but they don't capture the same upside as the TAIEX's tech-heavy weighting during bull runs.
2020-2024: semiconductor boom that bypassed dividend payers
+25.1% in 2020 while the TAIEX surged +50.0%. The global semiconductor shortage drove massive gains in TSMC and its closest peers, but those companies often don't qualify for the sustainability screen. TSMC's payout ratio is low (the company reinvests heavily), and its yield is below the 2% threshold in many years. The companies that do qualify are second-tier suppliers that benefit from semiconductor demand but don't capture the full upside.
2021 was particularly tough: -19.1% while the TAIEX lost -19.7%. Taiwan's export-heavy economy got hit by logistics disruptions and margin compression in the parts of the supply chain where sustainability stocks cluster.
Why Taiwan ranks last
Three factors explain the bottom-of-the-table finish:
Seven cash years. The effective test period is 18 years, not 25. Comparing an 18-year invested strategy against a 25-year invested benchmark is structurally unfair.
Tech dominance without tech participation. TSMC and the high-growth semiconductor firms drive Taiwan's market returns, but they don't pay the kind of dividends the screen requires. The screen selects the slower, more mature parts of the ecosystem. In a market where growth companies lead, that's a permanent handicap.
Small, concentrated economy. Taiwan's listed company universe is heavily tilted toward electronics and semiconductors. The sustainability screen can't diversify across sectors because the sectors don't exist in sufficient depth. When semiconductor demand dips, the whole portfolio suffers.
Backtest Methodology
| Parameter | Choice |
|---|---|
| Universe | TAI (TWSE), Market Cap > 10B TWD (~$312M USD) |
| Signal | 5-component sustainability score (0-10), minimum 7 |
| Components | Payout Ratio + D/E + FCF Coverage + ROE + Piotroski F-Score |
| Filters | Dividend Yield > 2%, Market Cap > 10B TWD |
| Portfolio | Top 30 by score descending (yield tiebreak), equal weight |
| Rebalancing | Annual (July) |
| Cash rule | Hold cash if < 10 qualify |
| Benchmark | TAIEX (TWD) |
| Execution | Next-day close (MOC after signal) |
| Period | 2000-2025 (25 years) |
| Data | Point-in-time (45-day lag for annual filings) |
| Costs | Size-tiered transaction costs applied |
| Piotroski | Computed from historical financial statements (9 binary signals) |
Limitations
Seven cash years reduce the effective test period. This is an 18-year backtest presented as a 25-year one. The CAGR calculation includes 7 years of zero compounding, which mechanically drags the number down. If you started in 2007, the result would look different.
Semiconductor concentration risk. Even with 28.5 stocks on average, the portfolio is heavily exposed to a single sector's supply chain. A downturn in global chip demand hits nearly every holding simultaneously.
Currency risk. Returns are in local currency (TWD). TWD/USD fluctuations add volatility for international investors. The TWD appreciated modestly against the USD over the period, which would help foreign investors slightly.
The screen excludes Taiwan's best companies. TSMC, MediaTek, and other high-growth semiconductor firms don't qualify because their yields are too low or their payout ratios don't meet the threshold. The screen is designed for mature dividend payers. On a growth-driven exchange, that's a selection bias against the market's strongest performers.
Survivorship bias. Exchange membership uses current company profiles. Delisted and acquired companies aren't fully captured.
Takeaway
Taiwan produces the smallest alpha in our comparison: +0.44% over the TAIEX across 25 years. That's marginal. Against the local benchmark, it's barely ahead.
The TAIEX itself returned 4.09% CAGR over this period, which isn't strong. The screen finding companies that beat that benchmark by a thin margin shows the quality filter does something, just not much. Seven cash years are the structural drag. The 18 invested years produce a 52% win rate vs the TAIEX, which is barely better than coin-flip.
The deeper issue is structural: Taiwan's market is built around semiconductor growth companies that don't qualify for a dividend sustainability screen. TSMC's best years didn't flow through this portfolio. When the screen selected companies, it found the mature, slower-growth parts of the supply chain. They're financially solid but they don't generate the returns needed for strong alpha.
For an investor already in Taiwanese equities, the sustainability overlay provides some downside protection (-28.55% max drawdown) and a slight edge over the local index. As a standalone case, Taiwan is the hardest market to make an argument for with this approach.
Part of a Series
This analysis is part of our dividend sustainability global exchange comparison. We tested the same screen on 12 exchanges worldwide: - [Dividend Sustainability on US Stocks (NYSE, NASDAQ, AMEX)][US_BLOG_URL] - 10.73% CAGR, full methodology - [Dividend Sustainability on Indian Stocks (NSE)][INDIA_BLOG_URL] - 15.86% CAGR, the standout - [Dividend Sustainability on Chinese Stocks (SHH + SHZ)][CHINA_BLOG_URL] - 6.90% CAGR - [Dividend Sustainability on Australian Stocks (ASX)][AUSTRALIA_BLOG_URL] - 5.96% CAGR - [Dividend Sustainability: 13-Exchange Global Comparison][COMPARISON_BLOG_URL] - full comparison table
References
- DeAngelo, H., DeAngelo, L. & Skinner, D. (1992). "Dividends and Losses." Journal of Finance, 47(5), 1837-1863.
- Piotroski, J. (2000). "Value Investing: The Use of Historical Financial Statement Information to Separate Winners from Losers." Journal of Accounting Research, 38, 1-41.
- Liu, Y. & Hsu, J. (2006). "New Evidence on the Payout Policy of Taiwanese Firms." Asia Pacific Management Review, 11(3), 141-158.
Run This Screen Yourself
Via web UI: [Run the sustainability screen on Ceta Research][SUSTAINABILITY_TAIWAN_QUERY_URL]. The query is pre-loaded. Hit "Run" and see what passes today.
Via Python:
import requests, time

API_KEY = "your_api_key"  # get one at cetaresearch.com
BASE = "https://tradingstudio.finance/api/v1"

resp = requests.post(f"{BASE}/data-explorer/execute", headers={
    "X-API-Key": API_KEY, "Content-Type": "application/json"
}, json={
    "query": """
        WITH latest_ratios AS (
            SELECT r.symbol, r.dividendPayoutRatio, r.debtToEquityRatio,
                   r.dividendYield, r.date,
                ROW_NUMBER() OVER (PARTITION BY r.symbol ORDER BY r.date DESC) AS rn
            FROM financial_ratios r
            JOIN profile p ON r.symbol = p.symbol
            WHERE r.period = 'FY' AND r.dividendPayoutRatio > 0
              AND r.dividendYield IS NOT NULL
              AND p.exchange IN ('TAI')
        ),
        latest_cf AS (
            SELECT c.symbol, c.freeCashFlow, c.commonDividendsPaid, c.date,
                ROW_NUMBER() OVER (PARTITION BY c.symbol ORDER BY c.date DESC) AS rn
            FROM cash_flow_statement c
            JOIN profile p ON c.symbol = p.symbol
            WHERE c.period = 'FY' AND c.commonDividendsPaid < 0
              AND p.exchange IN ('TAI')
        ),
        latest_metrics AS (
            SELECT k.symbol, k.returnOnEquity, k.marketCap, k.date,
                ROW_NUMBER() OVER (PARTITION BY k.symbol ORDER BY k.date DESC) AS rn
            FROM key_metrics k
            JOIN profile p ON k.symbol = p.symbol
            WHERE k.period = 'FY' AND k.marketCap IS NOT NULL
              AND p.exchange IN ('TAI')
        ),
        latest_scores AS (
            SELECT symbol, piotroskiScore FROM scores
        ),
        scored AS (
            SELECT r.symbol,
                CASE WHEN r.dividendPayoutRatio < 0.5 THEN 2
                     WHEN r.dividendPayoutRatio < 0.8 THEN 1 ELSE 0 END +
                CASE WHEN r.debtToEquityRatio >= 0 AND r.debtToEquityRatio < 0.5 THEN 2
                     WHEN r.debtToEquityRatio >= 0 AND r.debtToEquityRatio < 1.5 THEN 1
                     ELSE 0 END +
                CASE WHEN c.freeCashFlow > 0 AND c.commonDividendsPaid < 0
                     AND c.freeCashFlow / ABS(c.commonDividendsPaid) > 2 THEN 2
                     WHEN c.freeCashFlow > 0 AND c.commonDividendsPaid < 0
                     AND c.freeCashFlow / ABS(c.commonDividendsPaid) > 1 THEN 1
                     ELSE 0 END +
                CASE WHEN k.returnOnEquity > 0.15 THEN 2
                     WHEN k.returnOnEquity > 0.08 THEN 1 ELSE 0 END +
                COALESCE(CASE WHEN s.piotroskiScore >= 7 THEN 2
                     WHEN s.piotroskiScore >= 5 THEN 1 ELSE 0 END, 0)
                AS score,
                ROUND(r.dividendYield * 100, 2) AS yield_pct,
                ROUND(k.marketCap / 1e9, 1) AS mktcap_bn
            FROM latest_ratios r
            JOIN latest_cf c ON r.symbol = c.symbol AND c.rn = 1
            JOIN latest_metrics k ON r.symbol = k.symbol AND k.rn = 1
            LEFT JOIN latest_scores s ON r.symbol = s.symbol
            WHERE r.rn = 1 AND r.dividendYield > 0.02 AND k.marketCap > 10e9
        )
        SELECT symbol, score, yield_pct, mktcap_bn
        FROM scored WHERE score >= 7
        ORDER BY score DESC, yield_pct DESC LIMIT 30
    """,
    "options": {"format": "json", "limit": 100}
})
task_id = resp.json()["taskId"]

while True:
    result = requests.get(f"{BASE}/tasks/data-query/{task_id}",
                          headers={"X-API-Key": API_KEY}).json()
    if result["status"] in ("completed", "failed"):
        break
    time.sleep(2)

for r in result["result"]["rows"][:10]:
    print(f"{r['symbol']:8s} score={r['score']}/10 yield={r['yield_pct']:.1f}%")
Get your API key at cetaresearch.com. The full backtest code (Python + DuckDB) is on GitHub.
Data: Ceta Research, FMP financial data warehouse. Universe: TAI (TWSE). Annual rebalance (July), equal weight top 30 by sustainability score, 2000-2025.
Past performance does not guarantee future results. This is educational content, not investment advice.


