High Yield Blue Chips in India: 14.8% CAGR Over 25 Years of BSE Data
The Dogs of the Dow adapted for India. Take the 30 largest BSE stocks by market cap, buy the 10 highest-yielding. Over 25 years, this returned 14.8% annually, beating the Sensex by 3.4% with a 60% win rate.

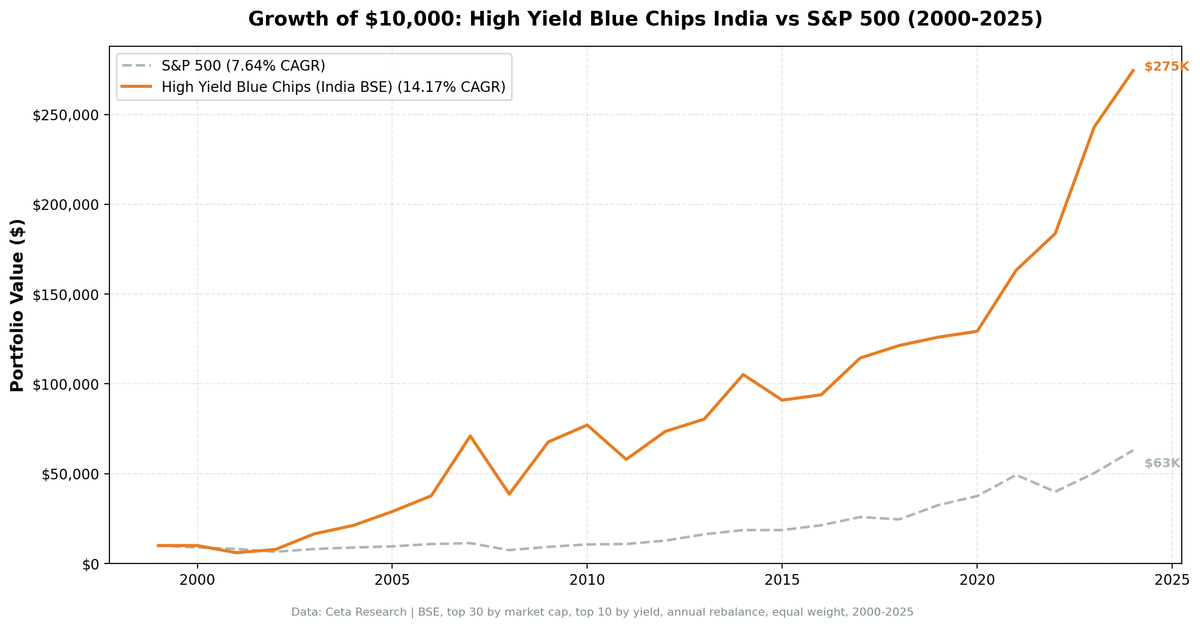
We adapted the Dogs of the Dow for India's Bombay Stock Exchange. Take the 30 largest BSE stocks by market cap (₹20B+), buy the 10 with the highest dividend yield, hold for a year, repeat. Over 25 years (2000-2025), this returned 14.8% annually, turning $10,000 into $315,000. That's +3.4% excess over the Sensex, with a 60% win rate against the local benchmark.
Contents
- Method
- How It Works on BSE
- The Screen (SQL)
- What We Found
- BSE blue chips beat the Sensex by 3.4% annually.
- Crisis performance tracks the Sensex closely, with a few standouts.
- Full annual performance
- Why does it work?
- Limitations
- Takeaway
Method
Data source: Ceta Research (FMP financial data warehouse) Universe: BSE, top 30 stocks by market cap (blue chip proxy) Period: 2000-2025 (25 annual periods) Rebalancing: Annual (January), equal weight, top 10 by dividend yield Execution: Next-day close (market-on-close) Benchmark: BSE Sensex (local currency) Transaction costs: Size-tiered (0.1% for >$10B, 0.3% for $2-10B, 0.5% for <$2B) Cash rule: Hold cash if fewer than 5 stocks qualify (triggered once in 2000)
For the full strategy explanation and US results, see the main Dogs of the Dow post.
How It Works on BSE
The original Dogs of the Dow uses the 30 Dow Jones stocks. India doesn't have an equivalent fixed-membership index with the same blue-chip characteristics. So we generalize: take the 30 largest BSE-listed stocks by market cap at each rebalance date, then pick the 10 with the highest trailing dividend yield.
The logic is the same: high yield among blue chips signals temporary underperformance, and blue chips tend to recover.
The Screen (SQL)
WITH blue_chips AS (
    SELECT k.symbol, p.companyName, k.marketCap
    FROM key_metrics_ttm k
    JOIN profile p ON k.symbol = p.symbol
    WHERE p.exchange = 'BSE'
        AND k.marketCap > 20e9  -- ₹20B (~$240M USD), FMP stores MCap in local currency
    ORDER BY k.marketCap DESC
    LIMIT 30
)
SELECT
    bc.symbol,
    bc.companyName,
    f.dividendYieldTTM * 100 as dividend_yield_pct,
    bc.marketCap / 1e9 as market_cap_billions,
    f.priceToEarningsRatioTTM as pe_ratio
FROM blue_chips bc
JOIN financial_ratios_ttm f ON bc.symbol = f.symbol
WHERE f.dividendYieldTTM > 0
ORDER BY f.dividendYieldTTM DESC
LIMIT 10
Run this screen on Ceta Research →
What We Found
BSE blue chips beat the Sensex by 3.4% annually.
| Metric | BSE Blue Chips | Sensex |
|---|---|---|
| CAGR | 14.8% | 11.4% |
| Total Return | 3,053% | 1,387% |
| Sharpe Ratio | 0.230 | 0.165 |
| Sortino Ratio | 0.527 | 0.312 |
| Max Drawdown | -44.2% | -51.3% |
| Volatility | 36.0% | 29.7% |
| Beta | 1.10 | 1.00 |
| Win Rate vs Sensex | 60% | -- |
| Negative Years | 4 of 25 (16%) | 5 of 25 (20%) |
The excess CAGR of +3.4% vs the Sensex is genuine alpha in local currency terms. BSE blue chips show up capture of 121%, meaning they slightly outpace the Sensex in bull years. Down capture is 93%, so drawdowns are comparable to the broader market.
The Sharpe ratio (0.230) beats the Sensex's (0.165), confirming the strategy delivers better risk-adjusted returns than the Indian market itself. The strategy also had a shallower max drawdown (-44.2% vs -51.3% for the Sensex) and fewer negative years.
Crisis performance tracks the Sensex closely, with a few standouts.
| Year | BSE Blue Chips | Sensex | Excess |
|---|---|---|---|
| 2002 | +28.7% | +2.9% | +25.7% |
| 2003 | +116.3% | +79.1% | +37.2% |
| 2007 | +87.6% | +46.8% | +40.8% |
| 2008 | -44.2% | -51.3% | +7.1% |
| 2009 | +84.0% | +76.3% | +7.7% |
| 2023 | +31.9% | +17.5% | +14.4% |
The early 2000s and mid-2000s were extraordinary. BSE blue chips returned 116% in 2003 and 88% in 2007. The 2008 crash hit both hard, but the strategy held up better than the Sensex (-44.2% vs -51.3%). Recent years (2022-2024) show continued outperformance.
Full annual performance
| Year | BSE Blue Chips | Sensex | Excess |
|---|---|---|---|
| 2000 | 0.0% (cash) | -25.2% | +25.2% |
| 2001 | -42.4% | -18.7% | -23.8% |
| 2002 | +28.7% | +2.9% | +25.7% |
| 2003 | +116.3% | +79.1% | +37.2% |
| 2004 | +26.1% | +10.8% | +15.3% |
| 2005 | +36.5% | +40.6% | -4.1% |
| 2006 | +30.2% | +48.5% | -18.2% |
| 2007 | +87.6% | +46.8% | +40.8% |
| 2008 | -44.2% | -51.3% | +7.1% |
| 2009 | +84.0% | +76.3% | +7.7% |
| 2010 | +13.9% | +17.1% | -3.2% |
| 2011 | -24.8% | -24.5% | -0.3% |
| 2012 | +27.8% | +27.0% | +0.8% |
| 2013 | +10.9% | +6.0% | +4.9% |
| 2014 | +34.2% | +33.5% | +0.7% |
| 2015 | -7.7% | -8.1% | +0.5% |
| 2016 | +4.3% | +3.8% | +0.5% |
| 2017 | +22.1% | +27.1% | -5.0% |
| 2018 | +5.1% | +6.2% | -1.0% |
| 2019 | +5.2% | +16.0% | -10.8% |
| 2020 | +3.9% | +15.7% | -11.9% |
| 2021 | +20.5% | +22.9% | -2.4% |
| 2022 | +12.5% | +3.4% | +9.2% |
| 2023 | +31.9% | +17.5% | +14.4% |
| 2024 | +15.9% | +11.2% | +4.7% |
Why does it work?
The +3.4% excess vs the Sensex likely comes from two factors:
- Dividend quality filter. Requiring high dividend yields among the top 30 by market cap selects for profitable companies returning cash. This acts as a quality screen that avoids the speculative stocks that sometimes drag the broader index.
- Mean reversion among blue chips. High yield signals temporary underperformance. BSE blue chips that drop tend to recover, and the dividend pays you while you wait. This mechanism is the same as in the US, but works against a more volatile backdrop.
Limitations
High volatility. 36.0% annualized volatility is roughly triple the US Dogs (11.7%). The ride is much rougher.
Emerging market risks. Regulatory changes, capital controls, and liquidity risks are higher on BSE than on the Dow.
Blue-chip proxy. We use top 30 by market cap as a blue-chip proxy. This is a reasonable approximation but not identical to a curated index like the Dow 30.
Survivorship in universe. BSE delisting coverage may be incomplete. Stocks that were large-cap in 2002 but later delisted don't appear in our historical screens.
Takeaway
The Dogs of the Dow concept, adapted for India's BSE, produced 14.8% CAGR over 25 years, beating the Sensex by 3.4% annually. The strategy had a higher Sharpe ratio (0.230 vs 0.165), a shallower max drawdown (-44.2% vs -51.3%), and a 60% win rate against the local benchmark. The returns come with high volatility (36%), making this a strategy for investors with a long time horizon.
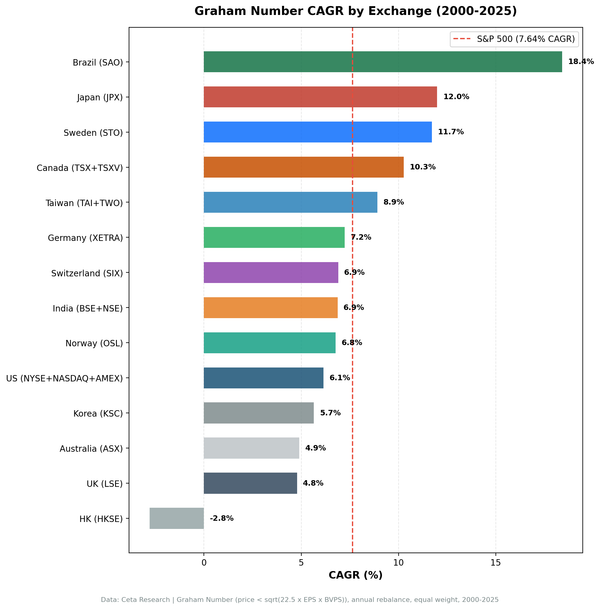
For the US results and full methodology, see the flagship Dogs of the Dow post. For how this strategy performed across 14 global markets, see the global comparison.
Data: Ceta Research (FMP financial data warehouse), 2000-2025. Full methodology: METHODOLOGY.md