
Dogs of the Dow: 25 Years of Data on the Simplest Stock Strategy
Buy the 10 highest-yielding Dow stocks every January. Hold for a year. Repeat. We tested 25 years of data. Dogs returned 10.2% vs 7.6% for the S&P 500. The real story is risk: Sharpe of 0.693 vs 0.322, max drawdown of -19.7% vs -34.9%.

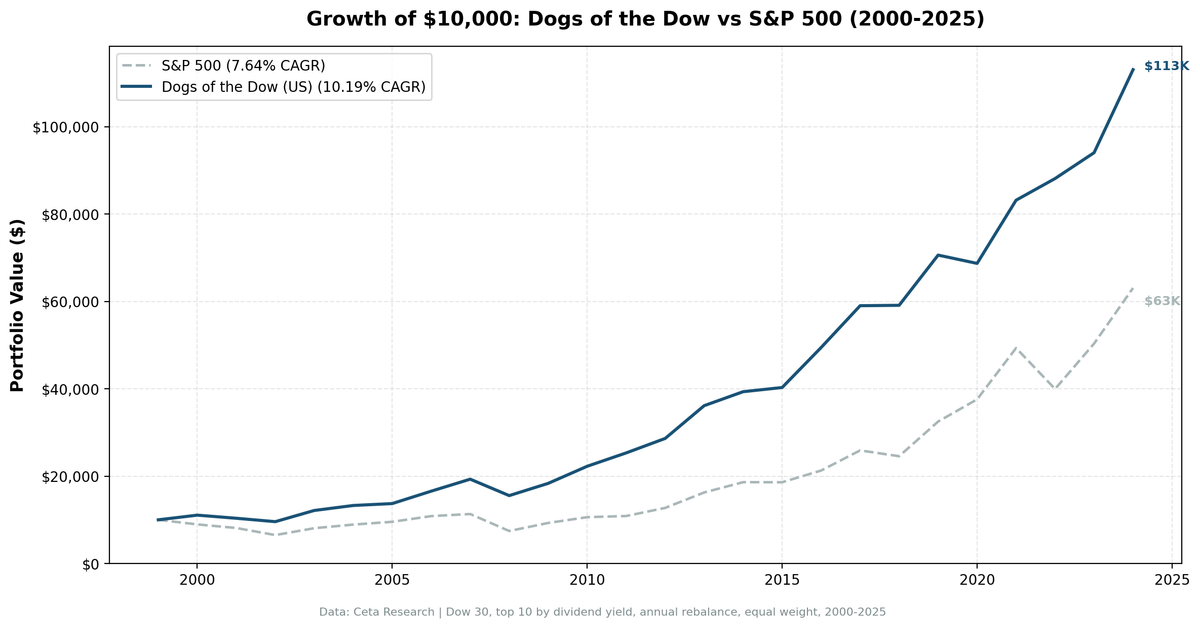
Buy the 10 highest-yielding Dow stocks every January. Hold for a year. Repeat. We backtested 25 years of data from 2000 to 2025. Dogs returned 10.2% annually vs 7.6% for the S&P 500, turning $10,000 into $114,000 vs $63,000. But the real story isn't alpha. It's risk. Dogs had a Sharpe ratio of 0.693 vs 0.322 for the S&P 500, half the volatility, and a max drawdown of -19.7% vs -34.9%.
Contents
- Method
- How the Strategy Works
- The Screen
- What We Found
- The edge is risk reduction, not alpha.
- Dogs shine in crises.
- Dogs lag in growth rallies.
- Full annual performance
- The Survivorship Problem
- Methodology
- Run It Yourself
- Limitations
- Takeaway
- References
Data: FMP financial data warehouse, 2000–2025. Updated March 2026.
Method
Data source: Ceta Research (FMP financial data warehouse) Universe: Dow Jones Industrial Average (30 stocks, current composition) Period: 2000-2025 (25 annual periods) Rebalancing: Annual (January), equal weight, top 10 by dividend yield Execution: Next-day close (market-on-close) Benchmark: S&P 500 Total Return (SPY) Transaction costs: Size-tiered (0.1% for mega-caps > $10B, 0.3% for large-caps $2-10B, 0.5% for mid-caps < $2B) Cash rule: Hold cash if fewer than 5 stocks qualify (never triggered)
Full methodology: METHODOLOGY.md
How the Strategy Works
The Dogs of the Dow was popularized by Michael O'Higgins in "Beating the Dow" (1991). The logic:
- Dow stocks are blue chips. They rarely go bankrupt.
- A high dividend yield means the stock price dropped relative to the dividend.
- Blue chips that drop tend to recover.
- The dividend pays you while you wait.
The strategy bets on mean reversion within the safety of the Dow. No financial modeling, no screening tools. Just 30 dividend yields, sorted once a year.
The Screen
SELECT
    d.symbol,
    d.name as companyName,
    f.dividendYieldTTM * 100 as dividend_yield_pct,
    f.priceToEarningsRatioTTM as pe_ratio,
    k.marketCap / 1e9 as market_cap_billions
FROM dowjones_constituent d
JOIN key_metrics_ttm k ON d.symbol = k.symbol
JOIN financial_ratios_ttm f ON d.symbol = f.symbol
WHERE f.dividendYieldTTM > 0
ORDER BY f.dividendYieldTTM DESC
LIMIT 10
Run this screen on Ceta Research →
Sort by yield. Take the top 10. Done.
What We Found
The edge is risk reduction, not alpha.
Dogs beat the S&P 500 by 2.6% annually. That's decent. But the real story is in the risk metrics.
| Metric | Dogs of the Dow | S&P 500 |
|---|---|---|
| CAGR | 10.2% | 7.6% |
| Total Return | 1,039% | 531% |
| Sharpe Ratio | 0.693 | 0.322 |
| Sortino Ratio | 1.592 | 0.556 |
| Max Drawdown | -19.7% | -34.9% |
| Volatility | 11.9% | 17.5% |
| VaR (95%) | -7.7% | -19.9% |
| Beta | 0.52 | 1.00 |
| Negative Years | 5 of 25 (20%) | 7 of 25 (28%) |
Dogs have almost half the market's beta (0.52) and captured only 14.2% of market losses (down capture ratio). When the S&P 500 fell, Dogs barely felt it. When the market rose, Dogs still captured 87% of the upside.
The Sharpe ratio tells the story: 0.693 vs 0.322. Per unit of risk taken, Dogs delivered more than twice the return.
Dogs shine in crises.
The strategy's best years are the market's worst.
In 2008, the S&P 500 lost 34.3%. Dogs lost 19.7%. In 2022, the S&P lost 19.0%. Dogs gained 6.0%, a 25 percentage point swing. During the dot-com bust (2000-2002), Dogs returned +12.2%, -6.8%, -7.7% while the market returned -10.5%, -9.2%, -19.9%.
| Year | Dogs | S&P 500 | Excess |
|---|---|---|---|
| 2000 | +12.2% | -10.5% | +22.7% |
| 2001 | -6.8% | -9.2% | +2.4% |
| 2002 | -7.7% | -19.9% | +12.3% |
| 2008 | -19.7% | -34.3% | +14.6% |
| 2015 | +2.7% | -0.1% | +2.8% |
| 2018 | -0.7% | -5.2% | +4.4% |
| 2022 | +6.0% | -19.0% | +25.0% |
In every down year for the S&P 500, Dogs did better. Seven times out of seven.
Dogs lag in growth rallies.
The tradeoff: when growth stocks run, Dogs don't keep up.
| Year | Dogs | S&P 500 | Excess |
|---|---|---|---|
| 2019 | +20.0% | +32.3% | -12.3% |
| 2020 | -2.2% | +15.6% | -17.9% |
| 2021 | +20.6% | +31.3% | -10.7% |
| 2023 | +6.5% | +26.0% | -19.5% |
2019-2021 was the worst stretch. Growth and tech dominated, and dividend-heavy blue chips got left behind. This is the expected cost of a value/income strategy: you're trading upside for protection.
Full annual performance
| Year | Dogs | S&P 500 | Excess |
|---|---|---|---|
| 2000 | +12.2% | -10.5% | +22.7% |
| 2001 | -6.8% | -9.2% | +2.4% |
| 2002 | -7.7% | -19.9% | +12.3% |
| 2003 | +27.6% | +24.1% | +3.5% |
| 2004 | +8.6% | +10.2% | -1.6% |
| 2005 | +3.4% | +7.2% | -3.8% |
| 2006 | +21.1% | +13.7% | +7.4% |
| 2007 | +16.5% | +4.4% | +12.1% |
| 2008 | -19.7% | -34.3% | +14.6% |
| 2009 | +18.4% | +24.7% | -6.3% |
| 2010 | +20.3% | +14.3% | +6.0% |
| 2011 | +14.0% | +2.5% | +11.5% |
| 2012 | +13.0% | +17.1% | -4.1% |
| 2013 | +26.4% | +27.8% | -1.4% |
| 2014 | +8.8% | +14.5% | -5.7% |
| 2015 | +2.7% | -0.1% | +2.8% |
| 2016 | +22.7% | +14.4% | +8.3% |
| 2017 | +19.4% | +21.6% | -2.2% |
| 2018 | -0.7% | -5.2% | +4.4% |
| 2019 | +20.0% | +32.3% | -12.3% |
| 2020 | -2.2% | +15.6% | -17.9% |
| 2021 | +20.6% | +31.3% | -10.7% |
| 2022 | +6.0% | -19.0% | +25.0% |
| 2023 | +6.5% | +26.0% | -19.5% |
| 2024 | +20.8% | +25.3% | -4.5% |
Win rate: 52%. Dogs beat the S&P 500 in 13 of 25 years. Barely better than a coin flip. But the wins in down markets are much larger than the losses in up markets, which is why the overall Sharpe is much higher.
The Survivorship Problem
The Dow changes members. Companies are added when they're doing well and removed when they're struggling. Roughly 20 composition changes since 2000.
Our backtest uses current Dow 30 membership applied historically. This introduces survivorship bias: companies eventually removed (like GE) disappear from the test, and recently added companies get included retroactively.
FMP has historical constituent data, but reconstructing point-in-time membership for every rebalance date is complex. We acknowledge this bias. The true historical strategy, applied with correct membership at each rebalance, would likely show slightly different results.
Methodology
| Parameter | Choice |
|---|---|
| Universe | Dow 30 (current composition applied historically) |
| Signal | Top 10 by trailing 12-month dividend yield |
| Portfolio | 10 stocks, equal weight |
| Rebalancing | Annual (January) |
| Min stocks | 5 (hold cash if fewer qualify, never triggered) |
| Transaction costs | Size-tiered (0.1% mega-cap, 0.3% large-cap, 0.5% mid-cap) |
| Benchmark | S&P 500 Total Return (SPY) |
| Data quality | Stocks with price < $1 or single-period returns > 200% excluded |
For the complete methodology, risk metrics definitions, and transaction cost model, see METHODOLOGY.md.
Run It Yourself
The screen above shows you today's Dogs. To run the full backtest:
# Clone the repo
git clone https://github.com/ceta-research/backtests.git
cd backtests

# Install dependencies
pip install -r requirements.txt

# Run the US backtest
python3 dogs-of-dow/backtest.py --verbose

# See the current screen
python3 dogs-of-dow/screen.py
Limitations
Small universe. Only 30 stocks. Sector concentration is a real risk. Some years, half the Dogs come from one industry.
No dividend cut protection. The strategy doesn't anticipate cuts. A Dog that eliminates its dividend destroys the thesis.
Survivorship bias. We use current Dow 30 membership applied historically. True point-in-time composition would give different results.
Annual max drawdown. Our -19.7% max drawdown is the worst full-year return. The intra-year peak-to-trough drawdown would be larger. This applies to all strategies in our backtest framework.
Recent underperformance. Dogs lagged by double digits in four of five years from 2019-2023 during the growth/tech rally. The strategy's edge concentrates in crisis periods.
Takeaway
Dogs of the Dow returned 10.2% annually over 25 years, beating the S&P 500 by 2.6%. But the headline return undersells the strategy. The real value is risk-adjusted: a Sharpe of 0.693 vs 0.322, a max drawdown of -19.7% vs -34.9%, and a beta of 0.52.
It's not the highest-returning strategy. QARP and Piotroski F-Score both deliver more alpha. But Dogs requires zero analytical tools, five minutes per year, and still beats the market with half the risk.
We also tested this strategy across 13 global exchanges. India (BSE) produced the strongest absolute returns at 14.6% CAGR, though much of the excess vs SPY was Indian market beta (the Sensex itself returned 11.4%). Sweden (STO) had the best non-US risk-adjusted performance. See our global comparison for the full results.
References
- O'Higgins, Michael. "Beating the Dow" (1991)
Data: Ceta Research (FMP financial data warehouse), 2000-2025. Full methodology: METHODOLOGY.md
Past performance does not guarantee future results. This is educational content, not investment advice.


