
Dogs of the Dow Across 13 Global Markets: Where High-Yield Blue Chips Work (and Where They Don't)
We tested the Dogs of the Dow strategy on 13 global exchanges from 2000 to 2025. The strategy beat the S&P 500 in 6 of 13 markets. India and Sweden stood out. Japan beat the Nikkei but trailed SPY.

We tested the Dogs of the Dow concept on 13 exchanges worldwide from 2000 to 2025. The original strategy buys the 10 highest-yielding Dow 30 stocks each January. For non-US markets, we generalized: take the 30 largest stocks by market cap, buy the 10 highest-yielding.
Contents
- Method
- The Results
- Markets where high-yield blue chips beat the S&P 500
- Markets where it didn't
- Three Takeaways
- 1. The US has the best risk-adjusted returns, by a wide margin.
- 2. High-yield blue chips work best in emerging markets.
- 3. High returns came with high volatility.
- China: A Special Case
- Excluded Exchanges
- The Screen
- Run It Yourself
- Limitations
- Takeaway
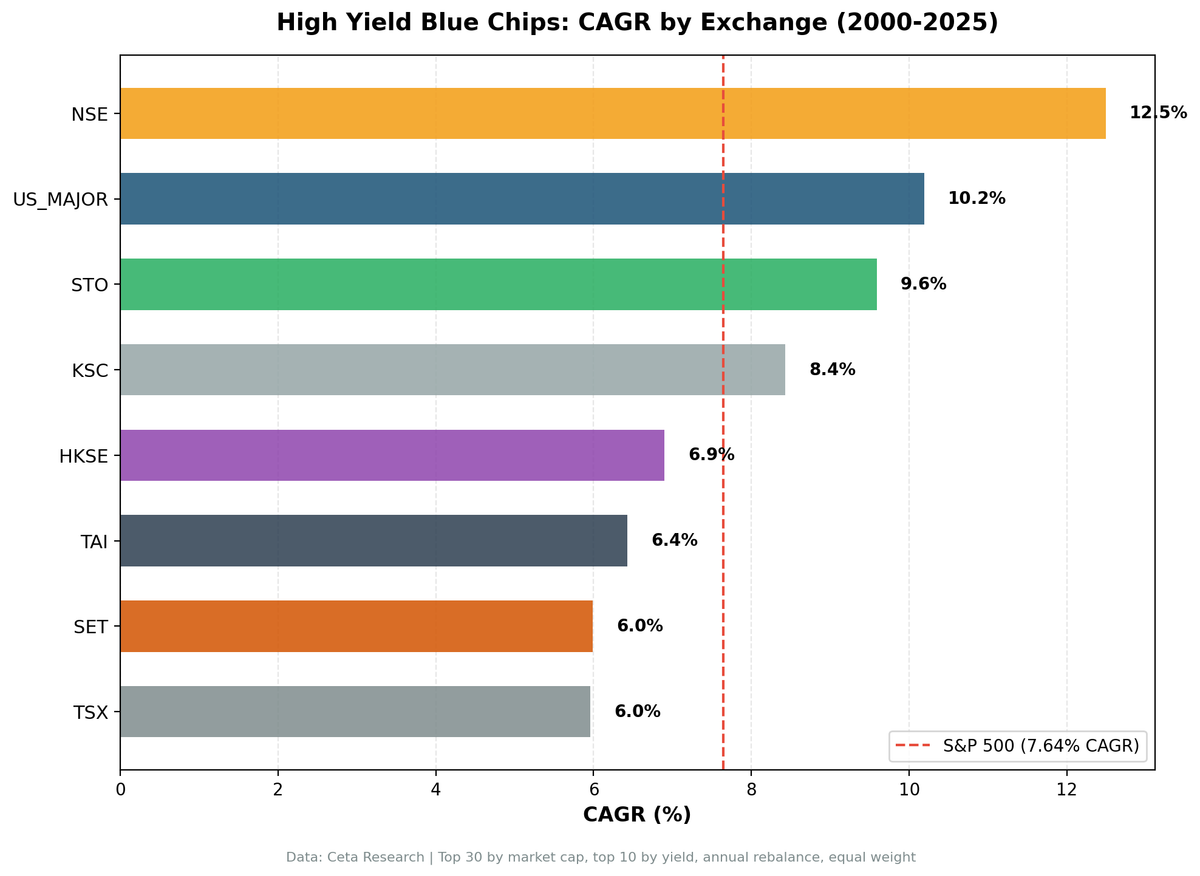
The strategy beat the S&P 500 in 6 of 13 markets. India led with 14.6% CAGR. The US had the best risk-adjusted returns (Sharpe 0.693). Japan, Thailand, Canada, and Hong Kong underperformed. Here's every exchange.
Data: FMP financial data warehouse, 2000–2025. Updated March 2026.
Method
Data source: Ceta Research (FMP financial data warehouse) Period: 2000-2025 (25 annual periods per exchange) Signal: Top 10 by trailing dividend yield within blue-chip universe Universe: Dow 30 (US), top 30 by market cap (all others) Rebalancing: Annual (January), equal weight Benchmark: S&P 500 Total Return (SPY, USD) for cross-market consistency Transaction costs: Size-tiered (0.1% mega-cap, 0.3% large-cap, 0.5% mid-cap) Excluded: LSE (London), SIX (Switzerland), XETRA (Germany), SAU (Saudi Arabia) due to insufficient blue-chip dividend payers or poor data quality
Full methodology: METHODOLOGY.md
The Results
Markets where high-yield blue chips beat the S&P 500
| Exchange | CAGR | Excess | Sharpe | Max DD | Vol | Win Rate | Avg Stocks |
|---|---|---|---|---|---|---|---|
| BSE (India) | 14.6% | +7.0% | 0.227 | -43.9% | 35.6% | 60% | 9 |
| NSE (India) | 12.5% | +4.8% | 0.194 | -40.0% | 30.7% | 44% | 9 |
| JNB (S. Africa) | 10.3% | +2.6% | 0.065 | -26.9% | 19.9% | 56% | 7 |
| US_MAJOR | 10.2% | +2.6% | 0.693 | -19.7% | 11.9% | 52% | 10 |
| STO (Sweden) | 9.7% | +2.1% | 0.342 | -38.2% | 22.6% | 68% | 10 |
| KSC (Korea) | 8.7% | +1.0% | 0.265 | -37.6% | 21.4% | 56% | 9 |
Markets where it didn't
| Exchange | CAGR | Excess | Sharpe | Max DD | Vol | Win Rate | Avg Stocks |
|---|---|---|---|---|---|---|---|
| TAI (Taiwan) | 7.0% | -0.7% | 0.325 | -35.5% | 18.4% | 52% | 9 |
| HKSE (Hong Kong) | 6.9% | -0.8% | 0.169 | -44.7% | 22.9% | 64% | 9 |
| TSX (Canada) | 6.0% | -1.7% | 0.204 | -34.5% | 17.0% | 52% | 7 |
| JPX (Japan) | 5.8% | -1.9% | 0.288 | -51.2% | 19.7% | 48% | 9 |
| SET (Thailand) | 5.8% | -1.9% | 0.147 | -36.3% | 22.3% | 68% | 9 |
All five underperformers still generated positive returns (5-7% CAGR), but fell short of the S&P 500's 7.6%. Japan is worth noting: it beat the Nikkei 225 by 2.8% annually, but the Nikkei itself trailed SPY over this period, dragging the cross-market comparison negative. A strategy doesn't need to beat the benchmark everywhere to be useful. Knowing where it fails is just as valuable.
Three Takeaways
1. The US has the best risk-adjusted returns, by a wide margin.
The US Dogs of the Dow had a Sharpe of 0.693. The next best was Sweden at 0.342. No other exchange came close. The US also had the lowest max drawdown (-19.7%) and the lowest volatility (11.9%). This makes sense: the Dow 30 is a curated index of the most stable American companies. The blue-chip proxy we use on other exchanges (top 30 by market cap) includes a wider range of companies.
2. High-yield blue chips work best in emerging markets.
India (BSE +7.0%, NSE +4.8%), South Africa (+2.6%), and Korea (+1.0%) produced positive excess vs SPY. The mean-reversion thesis, that high-yield blue chips are temporarily underpriced and will recover, appears more exploitable in less efficient markets. Japan beat the Nikkei 225 by 2.8% but trailed SPY due to Japan's weak equity market over this period. Developed markets (Canada, Hong Kong) and Thailand showed no excess.
Note: India's excess vs the local Sensex benchmark is lower (+3.2% for BSE), because the Sensex itself outperformed SPY. Much of what appeared as alpha vs SPY was actually Indian market beta.
Note: Sweden's +2.1% vs SPY understates the alpha vs the local market. The OMX Stockholm 30 returned only 2.95% CAGR over this period, far below SPY's 7.64%. Against its local benchmark, Swedish blue chips beat the OMX30 by +6.8% annually, with a 68% win rate. See the Sweden regional post for the full OMX30 comparison.
3. High returns came with high volatility.
India's 14.6% CAGR came with 35.6% volatility and a -43.9% max drawdown. Korea's 8.7% CAGR came with -37.6% max drawdown. The higher excess returns in emerging markets were compensation for higher risk, not a free lunch. The US is the only market where the strategy delivered alpha with genuinely low risk.
China: A Special Case
We also tested Shanghai (SHH) and Shenzhen (SHZ), which had unique data characteristics.
| Exchange | CAGR | Excess | Sharpe | Max DD | Notes |
|---|---|---|---|---|---|
| SHH (full period) | 3.4% | -4.2% | 0.025 | -70.1% | Includes 2006-07 bubble |
| SHZ (full period) | 3.9% | -3.7% | 0.032 | -60.0% | Includes 2006-07 bubble |
The 2006-07 Chinese stock market bubble was real. The Shanghai Composite went from ~1,000 to ~6,000 in two years. Our backtest shows single-year returns of +144% (SHH, 2006) and +146% (SHZ, 2007). The crash was equally extreme: -70% (SHH, 2008).
Either way, Chinese exchanges trailed the S&P 500 by a wide margin. High-yield blue chips in China didn't work over this period.
Excluded Exchanges
| Exchange | Reason | Action |
|---|---|---|
| SIX (Switzerland) | Avg 3.6 stocks (too few for meaningful "top 10" strategy) | Excluded |
| XETRA (Germany) | Avg 6 stocks, 3.1% CAGR, Sharpe 0.069 | Excluded |
| LSE (London) | Avg 5 stocks, -74% max drawdown, negative Sharpe (-0.057) | Excluded |
| SAU (Saudi Arabia) | 1.6% CAGR, negative Sharpe, 8 cash periods | Excluded |
| SAO (Brazil) | Broken adjClose data (unadjusted stock splits, >1000x price ratios) | Excluded |
| ASX (Australia) | Broken adjClose data (unadjusted stock splits, >1000x price ratios) | Excluded |
SIX, XETRA, and LSE had insufficient blue-chip dividend payers to fill the portfolio. LSE's blue-chip universe produced only 5 qualifying stocks on average, leading to extreme concentration risk and a -74% drawdown. SAU had too many cash periods (8 of 25) and negative Sharpe. SAO and ASX have data quality issues that make historical returns unreliable (raw prices contain unadjusted stock splits).
The Screen
To run this strategy on any exchange, change the exchange filter:
WITH blue_chips AS (
    SELECT k.symbol, p.companyName, k.marketCap
    FROM key_metrics_ttm k
    JOIN profile p ON k.symbol = p.symbol
    WHERE p.exchange = 'BSE'  -- Change exchange here
        AND k.marketCap > 20e9  -- Exchange-specific threshold (local currency): BSE/NSE=20e9, STO=5e9, NYSE/NASDAQ=1e9, others see cli_utils.py
    ORDER BY k.marketCap DESC
    LIMIT 30
)
SELECT
    bc.symbol,
    bc.companyName,
    f.dividendYieldTTM * 100 as dividend_yield_pct,
    bc.marketCap / 1e9 as market_cap_billions
FROM blue_chips bc
JOIN financial_ratios_ttm f ON bc.symbol = f.symbol
WHERE f.dividendYieldTTM > 0
ORDER BY f.dividendYieldTTM DESC
LIMIT 10
Supported exchanges: BSE, NSE, STO, SET, KSC, HKSE, TAI, TSX, JPX, SHH, SHZ.
For the US Dogs (using actual Dow 30 membership):
SELECT
    d.symbol,
    d.name as companyName,
    f.dividendYieldTTM * 100 as dividend_yield_pct,
    k.marketCap / 1e9 as market_cap_billions
FROM dowjones_constituent d
JOIN key_metrics_ttm k ON d.symbol = k.symbol
JOIN financial_ratios_ttm f ON d.symbol = f.symbol
WHERE f.dividendYieldTTM > 0
ORDER BY f.dividendYieldTTM DESC
LIMIT 10
Run the US screen on Ceta Research →
Run It Yourself
git clone https://github.com/ceta-research/backtests.git
cd backtests

# Run all exchanges
python3 dogs-of-dow/run_all_exchanges.py --verbose

# Run a single exchange
python3 dogs-of-dow/backtest.py --preset india --verbose
python3 dogs-of-dow/backtest.py --preset sweden --verbose

# Current screen for any exchange
python3 dogs-of-dow/screen.py --preset india
Limitations
SPY benchmark. We compare all markets against the S&P 500 for consistency. Local benchmarks (Nifty 50, OMX 30, SET Index) would give different excess return numbers. SPY makes cross-market comparison possible but isn't the natural benchmark for any non-US market.
Currency. Returns are in local currency vs SPY in USD. Currency appreciation/depreciation is embedded in the excess returns.
Blue-chip proxy. We use top 30 by market cap as a blue-chip proxy. The Dow 30 is a curated index with editorial judgment on membership. Market-cap ranking is a mechanical approximation.
Annual drawdown. Max drawdown is the worst full-year return, not intra-year peak-to-trough. Actual drawdowns during the year would be larger.
Survivorship bias. Some exchanges have better delisting coverage than others. Markets where delisted stocks are poorly covered may show slightly optimistic results.
Takeaway
The high-yield blue chip strategy works best where it started: the US. Not because of the highest returns (India wins that), but because the Dow 30 is the perfect universe for this strategy, a curated set of ultra-stable companies where mean reversion is most reliable and volatility is lowest.
Emerging markets (India, Korea) produced higher raw returns but with proportionally higher risk. When measured against local benchmarks (Sensex for India), much of the apparent "alpha" vs SPY turns out to be market beta. Japan beat the Nikkei 225 by 2.8% but still trailed SPY. Developed non-US markets (Canada, Hong Kong) and Thailand showed no excess.
The strategy is simple across all markets. One screen, one sort, one trade per year. The question isn't whether it works, but where, and whether you can tolerate the volatility.
For detailed analysis of individual markets, see: - Dogs of the Dow: US Results (flagship) - High Yield Blue Chips: India - High Yield Blue Chips: Sweden
Data: Ceta Research (FMP financial data warehouse), 2000-2025. Full methodology: METHODOLOGY.md
Past performance does not guarantee future results. This is educational content, not investment advice.


