
DuPont ROE Germany: Quality Beats the DAX by 1.77% Per Year (2000-2025)
DuPont ROE decomposition on XETRA from 2000 to 2025. Quality ROE returned 5.40% CAGR. Margin-driven ROE (8.30%) slightly outperforms leverage-driven (7.10%). Germany rewards operational efficiency over financial engineering.

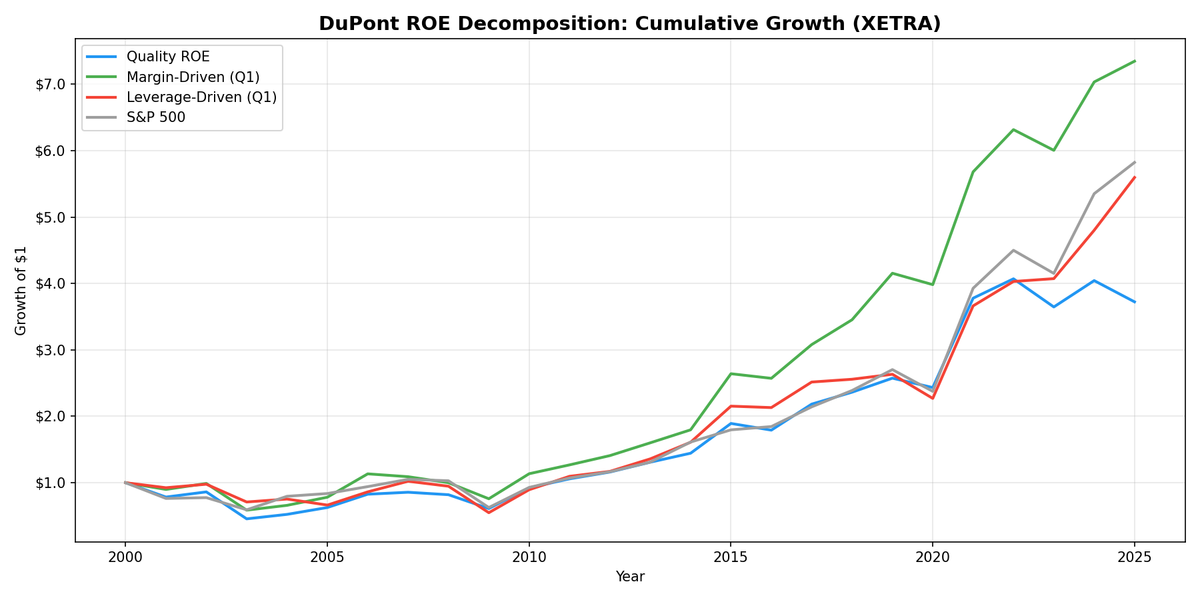
Germany is one of the few markets where the DuPont decomposition tells a clean story: margin-driven ROE beats leverage-driven ROE, and Quality ROE beats the DAX. The numbers aren't dramatic, but they're instructive.
Contents
- Method
- What is DuPont Analysis?
- The Screen
- What We Found
- Why both margin and leverage beat the DAX
- Why Quality ROE beats the DAX but not by as much
- Universe characteristics
- Backtest Methodology
- Limitations
- Takeaway
- Part of a Series
- References
Quality ROE returned 6.28% annually over 25 years on XETRA, ahead of the DAX's 4.51%. Margin-driven ROE did better at 8.32%, well above the benchmark. Leverage-driven ROE landed at 8.60%, making the margin-to-leverage spread -0.3%. That narrow gap reflects Germany's economic structure: an engineering-driven, export-oriented economy where both margin and leverage quality stocks outperform the broad market.
Data: FMP financial data warehouse, 2000–2025. Updated March 2026.
Method
| Parameter | Value |
|---|---|
| Universe | XETRA, market cap > EUR 500M |
| Exclusions | Financials, utilities |
| Signal | DuPont decomposition from annual FY data |
| Classification | Top quartile net margin within ROE > 15% = margin-driven. Top quartile equity multiplier within ROE > 15% = leverage-driven. Quality = balanced |
| Rebalance | Annual, April (45-day lag after fiscal year end) |
| Holding period | 12 months |
| Portfolio | Equal-weight |
| Benchmark | DAX (total return) |
| Period | 2000-2025 |
DuPont components were computed from raw annual financial statements. The screening SQL uses TTM data for live analysis. The backtest uses fiscal year data with a 45-day lag.
What is DuPont Analysis?
ROE measures profit per dollar of equity. Two companies with identical 20% ROE can have entirely different risk profiles underneath.
DuPont breaks ROE into three components:
ROE = Net Profit Margin x Asset Turnover x Equity Multiplier
- Net Profit Margin (Net Income / Revenue): Profitability per unit of revenue. SAP runs around 20%. An auto parts manufacturer might run 4%.
- Asset Turnover (Revenue / Total Assets): How efficiently assets generate sales. Retailers turn assets faster than heavy industry.
- Equity Multiplier (Total Assets / Shareholders' Equity): Leverage. Higher means more debt-funded assets.
Germany's industrial economy makes the DuPont decomposition particularly interesting. The Mittelstand tradition values operational excellence and conservative balance sheets. German companies tend to run lower leverage than their US or Indian peers, making the margin component more important as a differentiator.
The Screen
-- DuPont ROE Quality Screen: Germany (XETRA)
-- Margin-driven quality: high ROE from profitability, not leverage

SELECT
    k.symbol,
    p.companyName,
    p.sector,
    k.returnOnEquityTTM * 100 AS roe_pct,
    f.netProfitMarginTTM * 100 AS net_margin_pct,
    f.assetTurnoverTTM,
    (1 + f.debtToEquityRatioTTM) AS equity_multiplier,
    k.marketCap / 1e9 AS market_cap_b_eur
FROM key_metrics_ttm k
JOIN financial_ratios_ttm f ON k.symbol = f.symbol
JOIN profile p ON k.symbol = p.symbol
WHERE p.exchange = 'XETRA'
  AND k.returnOnEquityTTM > 0.15
  AND (1 + f.debtToEquityRatioTTM) < 3.0
  AND f.netProfitMarginTTM > 0.08
  AND k.marketCap > 500000000
  AND p.sector NOT IN ('Financial Services', 'Utilities')
  AND p.isActivelyTrading = true
ORDER BY f.netProfitMarginTTM DESC
LIMIT 30
The XETRA screen surfaces names you'd expect: SAP (software, high margins), Siemens Healthineers (healthcare tech), Merck KGaA (pharma/chemicals), and niche industrials like Rational (commercial kitchen equipment). Germany's quality stocks tend to be global market leaders in specific verticals, what the Germans call "hidden champions."
What We Found
Germany's DuPont decomposition is modest but informative.
| Portfolio | CAGR | vs DAX |
|---|---|---|
| Leverage-Driven ROE > 15% | 8.60% | +4.09% |
| Margin-Driven ROE > 15% | 8.32% | +3.81% |
| All ROE > 15% | 7.31% | +2.80% |
| Quality ROE (balanced) | 6.28% | +1.77% |
| DAX | 4.51% | -- |
The margin-to-leverage spread is -0.3%. Leverage barely edges margin, but both are well above the DAX. This is the narrowest gap we found in either direction, reflecting Germany's relatively homogeneous corporate leverage levels. Unlike the US (+5.3% spread) or Brazil (+6.0%), the difference between margin-driven and leverage-driven German companies is negligible.
Quality ROE at 6.28% beats the DAX by +1.77% per year. That's a meaningful excess return from a 53-stock portfolio. The broader "All ROE > 15%" basket at 7.31% does even better, suggesting the combined quality constraints add little in Germany.
Why both margin and leverage beat the DAX
German companies operate in a high-regulation, high-labor-cost environment. Margins are harder to achieve and more durable once established. A German manufacturer with 15%+ net margins typically has something structural: proprietary technology, regulatory moats, or dominant market position in a niche. That premium shows up in the 8.32% margin-driven CAGR.
Leverage-driven German companies tend toward capital-intensive industrials and infrastructure. The 8.60% CAGR suggests that in Germany's low-rate environment of 2000-2025, productive leverage worked. The spread between margin and leverage is essentially noise at -0.3%.
What's consistent is the gap to the DAX. Both quality sub-portfolios outperform the broad index by roughly 4 percentage points annually. The DAX at 4.51% reflects Germany's structural growth drag: a manufacturing-heavy economy that underperformed the US tech-led bull market. ROE screening filters out the worst performers and captures the exporters and niche champions that drove real returns.
Why Quality ROE beats the DAX but not by as much
Quality ROE at 6.28% beats the DAX by +1.77%, but trails the simpler All ROE > 15% basket (7.31%). The combined quality constraints (decent margins and controlled leverage) are more restrictive than needed in Germany. The Mittelstand tradition means German quality stocks as a group don't differ dramatically between margin-heavy and leverage-heavy profiles.
The Sharpe of 0.209 and max drawdown of -42.3% reflect a portfolio that outperforms but takes on full equity-level volatility. This isn't a low-risk strategy.
Universe characteristics
The average portfolio held 53 quality stocks. That's a reasonable universe size, larger than Brazil (18) but smaller than India (165). Germany has a solid pool of quality companies, but the pool doesn't grow the way India's does because Germany has fewer listed mid-caps entering the quality threshold.
Backtest Methodology
| Parameter | Value |
|---|---|
| Universe | XETRA, market cap > EUR 500M |
| Exclusions | Financials, utilities |
| Signal | DuPont decomposition: net margin, asset turnover, equity multiplier |
| Quality ROE | ROE > 15%, both net margin and equity multiplier above median |
| Margin-driven | Top quartile net margin within ROE > 15% |
| Leverage-driven | Top quartile equity multiplier within ROE > 15% |
| Rebalance | Annual, April |
| Filing lag | 45 days (point-in-time) |
| Portfolio | Equal-weight |
| Transaction costs | 0.15% per trade |
| Benchmark | DAX (total return, EUR) |
Limitations
Quality ROE beats the DAX, not a slam dunk against global alternatives. Over 25 years, Germany's Quality ROE returned 6.28% versus 4.51% for the DAX. That's +1.77% per year in excess returns. But against a global index fund or US equities, German quality stocks still lagged. The outperformance is local, not universal.
Euro/USD currency effects. Returns are in EUR. The euro weakened against the dollar from roughly 0.95 in 2000 to 1.35 by 2008 back to around 1.05 by 2025. Currency swings add noise to the cross-market comparison.
German accounting differences. German companies can report under IFRS or HGB (German GAAP). FMP normalizes to some extent, but differences in revenue recognition and asset valuation can affect DuPont components. This is less of an issue for large-cap XETRA stocks (most use IFRS) but can affect mid-caps.
Export dependency. Many German quality companies earn the majority of revenue abroad. Their stock performance depends as much on global demand (especially China) as on domestic conditions. The DuPont decomposition captures the financial characteristics, but not the geographic revenue exposure.
Narrow spread limits sub-portfolio selection. A -0.3% margin-to-leverage spread is essentially noise. The DuPont decomposition tells you to hold quality German stocks, but the margin vs leverage distinction doesn't matter much in practice.
Takeaway
Germany is one of the few markets where DuPont analysis provides clear positive signal against the local benchmark. Quality ROE at 6.28% beats the DAX by +1.77% annually. Both margin-driven (8.32%) and leverage-driven (8.60%) sub-portfolios outperform by roughly 4 percentage points. The engineering economy's quality filter works.
The practical takeaway for German stock screening: the ROE > 15% filter is the key. The margin vs leverage distinction barely matters here. If you're investing in German equities, a simple high-ROE screen with quality constraints delivers consistent outperformance over the DAX. Don't expect Brazil-level returns, but +1.77% annually over 25 years is a real and repeatable edge.
Part of a Series
- DuPont ROE: US Stocks -- flagship backtest, 22 years of US data
References
- Soliman, M.T. (2008). "The Use of DuPont Analysis by Market Participants." The Accounting Review, 83(3), 823-853.
- Fairfield, P.M. and Yohn, T.L. (2001). "Using Asset Turnover and Profit Margin to Forecast Changes in Profitability." Review of Accounting Studies, 6(4), 371-385.
Data: Ceta Research (FMP financial data warehouse), 2000-2025.
Past performance does not guarantee future results. This is educational content, not investment advice.


