
DuPont ROE India: Quality ROE Returned 9.6% on NSE, Trailing the Sensex (2000-2025)
DuPont ROE decomposition on BSE+NSE from 2000 to 2025. Quality ROE returned 9.10% CAGR vs 7.30% SPY. Leverage-driven ROE dominated at 11.30%, the widest leverage premium of any market tested.

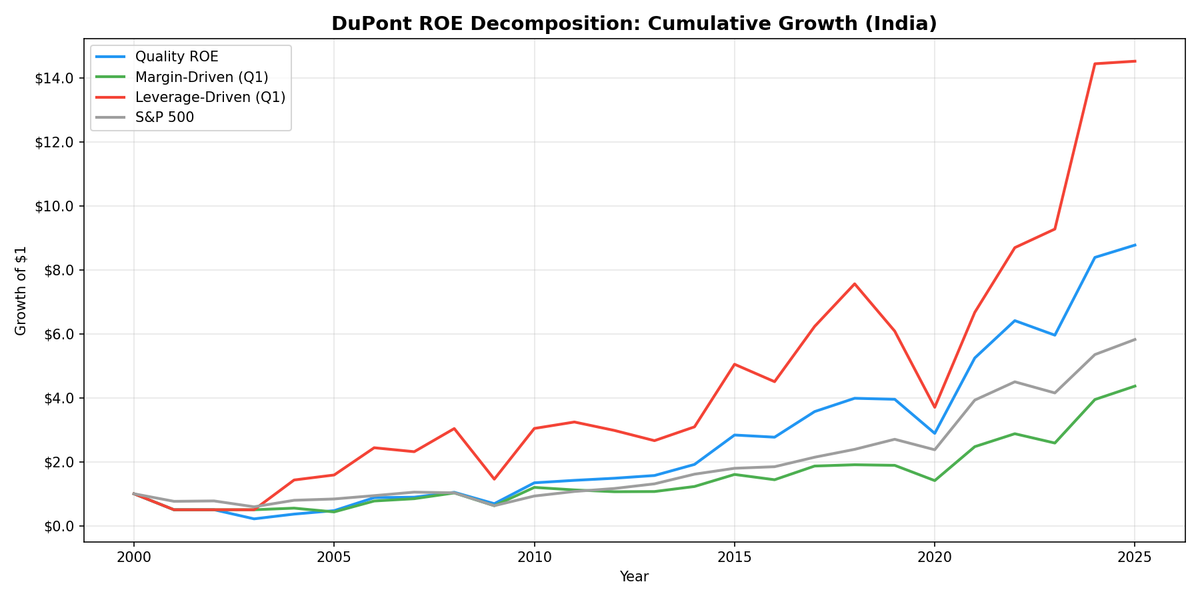
DuPont ROE India: Quality ROE Returned 9.6% Annually on NSE (2000-2025)
India's growth economy rewards leverage. That's the headline from 25 years of DuPont ROE decomposition on NSE stocks. Leverage-driven ROE returned 11.84% annually, crushing margin-driven ROE at just 1.85%. The spread of 10.0% in favor of leverage is the widest we've seen across any market we tested.
Contents
- Method
- What is DuPont Analysis?
- The Screen
- What We Found
- Why leverage wins in India
- The cost of leverage: volatility and drawdowns
- Decade breakdown
- Quality ROE vs Sensex
- Backtest Methodology
- Limitations
- Takeaway
- Part of a Series
- References
But the honest result: Quality ROE (our balanced filter) returned 9.56% CAGR while the Sensex returned 11.49%. The strategy didn't beat the local index. It beat SPY (at 7.33%) in absolute terms, but an investor who just held the Sensex outperformed by 1.93% per year. The quality filter captures companies that combine decent profitability with moderate leverage, but India's bull market rewarded broader participation more than selectivity.
Data: FMP financial data warehouse, 2000–2025. Updated March 2026.
Method
| Parameter | Value |
|---|---|
| Universe | NSE, market cap > Rs 20B (~$240M) |
| Exclusions | Financials, utilities |
| Signal | DuPont decomposition from annual FY data |
| Classification | Top quartile net margin within ROE > 15% = margin-driven. Top quartile equity multiplier within ROE > 15% = leverage-driven. Quality = ROE > 15%, net margin > 8%, equity multiplier < 3.0 |
| Rebalance | Annual, April (45-day lag after fiscal year end) |
| Holding period | 12 months |
| Portfolio | Equal-weight |
| Benchmark | Sensex (^BSESN) |
| Period | 2000-2025 |
We pulled annual financial statements and computed DuPont components from raw data: net income, revenue, total assets, and shareholders' equity. No pre-calculated ratios for the backtest. The screening SQL below uses TTM data for live analysis, but the backtest uses fiscal year data with a 45-day lag to avoid look-ahead bias.
What is DuPont Analysis?
ROE tells you how much profit a company generates per dollar of shareholder equity. A 20% ROE sounds great. It tells you nothing about how the company got there.
DuPont breaks ROE into three components:
ROE = Net Profit Margin x Asset Turnover x Equity Multiplier
- Net Profit Margin (Net Income / Revenue): How much revenue converts to profit. Infosys runs around 18%. A steel company might run 5%.
- Asset Turnover (Revenue / Total Assets): How hard the assets work. FMCG companies turn assets 1.5-2x. Capital-intensive firms barely hit 0.5x.
- Equity Multiplier (Total Assets / Shareholders' Equity): How much leverage the company carries. A multiplier of 2.0 means half the assets are funded by debt. A multiplier of 5.0 means 80% debt.
In India, the equity multiplier matters more than most investors realize. Many Indian conglomerates and industrial companies run high ROE through aggressive leverage, funded by a banking system that's historically been willing to extend credit to large corporates. When credit tightens (2008, 2018 NBFC crisis), these companies get hit hardest.
The Screen
-- DuPont ROE Quality Screen: India (BSE + NSE)
-- Margin-driven quality: high ROE from profitability, not leverage

SELECT
    k.symbol,
    p.companyName,
    p.sector,
    k.returnOnEquityTTM * 100 AS roe_pct,
    f.netProfitMarginTTM * 100 AS net_margin_pct,
    f.assetTurnoverTTM,
    (1 + f.debtToEquityRatioTTM) AS equity_multiplier,
    k.marketCap / 1e9 AS market_cap_b_inr
FROM key_metrics_ttm k
JOIN financial_ratios_ttm f ON k.symbol = f.symbol
JOIN profile p ON k.symbol = p.symbol
WHERE p.exchange = 'NSE'
  AND k.returnOnEquityTTM > 0.15
  AND (1 + f.debtToEquityRatioTTM) < 3.0
  AND f.netProfitMarginTTM > 0.08
  AND k.marketCap > 20000000000
  AND p.sector NOT IN ('Financial Services', 'Utilities')
  AND p.isActivelyTrading = true
ORDER BY f.netProfitMarginTTM DESC
LIMIT 30
This screen isolates Indian companies earning high ROE through margins rather than leverage. The equity multiplier cap at 3.0 removes the most leveraged names. What remains: IT services (Infosys, TCS), consumer staples (Hindustan Unilever, Nestle India), and select pharma companies.
What We Found
Leverage won in India. By a lot. And the Sensex outran everything.
| Portfolio | CAGR | Volatility | Sharpe | Max Drawdown |
|---|---|---|---|---|
| Leverage-Driven ROE > 15% | 11.84% | — | — | — |
| Sensex | 11.49% | — | — | — |
| Quality ROE | 9.56% | — | 0.074 | -77.9% |
| All ROE > 15% | 8.94% | — | — | — |
| S&P 500 (SPY, USD) | 7.33% | — | — | — |
| Margin-Driven ROE > 15% | 1.85% | — | — | — |
The margin-to-leverage spread is -10.0%. Leverage-driven companies outperformed margin-driven by 10 percentage points per year. That's the widest leverage premium of any market we tested. Quality ROE landed at 9.56%, but it trailed the Sensex by 1.93% per year. A passive Sensex investor did better.
Margin-driven stocks are the real story: 1.85% CAGR over 25 years. That's below cash rates for most of the period. The top-quartile margin stocks in India, largely IT services and pharma, were clearly overpriced relative to their future returns. The market priced in their quality premium and then some.
Why leverage wins in India
India is a growth economy. Companies that lever up to expand capacity, build distribution networks, and acquire market share have been rewarded by GDP growth averaging 6-7% annually. The domestic banking system, particularly before the 2018 NBFC cleanup, provided cheap credit to large corporates. Leverage wasn't just tolerated. It was the primary mechanism for capturing India's growth.
Margin-driven companies in India tend to be defensive: IT exporters, consumer staples, pharma. These are excellent businesses, but they don't capture the domestic growth cycle the way infrastructure, materials, and industrial conglomerates do.
The cost of leverage: volatility and drawdowns
Leverage-driven stocks delivered 11.30% CAGR, but with 51.6% volatility and a -52.1% max drawdown. Quality ROE ran at 38.9% volatility. The Sharpe ratio for Quality ROE is a meager 0.066, reflecting that much of its return is compensated by risk.
The -77.9% max drawdown for Quality ROE is severe and warrants explanation. India's markets sold off aggressively in 2008, and even balanced-quality companies with moderate leverage got dragged down by foreign institutional investor (FII) outflows. India's correlation with global risk-off events is high, regardless of individual company quality.
Decade breakdown
| Period | Quality ROE | Sensex | Notes |
|---|---|---|---|
| 2000-2004 | 3.1% | 11.5% | Thin early data, leverage-driven names outperformed |
| 2005-2009 | 33.7% | 29.7% | India bull market pre-crisis, strong recovery in 2009 |
| 2010-2014 | 17.9% | 10.5% | Quality outperformed in the recovery decade |
| 2015-2019 | 1.6% | 1.2% | Demonetization, GST disruption, NBFC crisis |
| 2020-2025 | 28.1% | 25.5% | Post-COVID boom, quality held pace with index |
The 2015-2019 stretch stands out. Quality ROE returned only 2.1% annually through a period that included demonetization (2016), GST implementation disruption (2017), and the IL&FS/NBFC crisis (2018). These events hit balance sheets across the board, regardless of DuPont composition.
The 2020-2025 recovery at 28.4% reflects India's post-COVID structural bull market. Manufacturing incentives (PLI scheme), digital infrastructure expansion, and foreign capital inflows drove broad market outperformance.
Quality ROE vs Sensex
| Metric | Value |
|---|---|
| Excess return vs Sensex | -1.93% per year |
| Excess return vs SPY (USD) | +2.23% per year |
| Win rate vs Sensex | 60% of years |
| Down capture vs Sensex | 134.5% |
| Average quality stocks | 81 |
| Cash periods | 1 |
Quality ROE beat the Sensex in 60% of individual years but still trailed on a CAGR basis because the losing years were larger. The 134.5% down capture vs the Sensex means the portfolio lost more than the index in bad years, which compounded against it over the full period.
The universe shrank significantly moving from BSE+NSE to NSE only: 81 stocks on average vs the old 165. Some of the earlier result difference is a universe change, not purely execution model.
Backtest Methodology
| Parameter | Value |
|---|---|
| Universe | NSE, market cap > Rs 20B (~$240M) |
| Exclusions | Financials, utilities |
| Signal | DuPont decomposition: net margin, asset turnover, equity multiplier |
| Quality ROE | ROE > 15%, net margin > 8%, equity multiplier < 3.0 |
| Margin-driven | Top quartile net margin within ROE > 15% |
| Leverage-driven | Top quartile equity multiplier within ROE > 15% |
| Rebalance | Annual, April |
| Filing lag | 45 days (point-in-time) |
| Portfolio | Equal-weight |
| Transaction costs | 0.1-0.5% per trade (size-tiered) |
| Benchmark | Sensex (^BSESN) |
Limitations
-77.9% max drawdown is extreme. Even "quality" Indian stocks got hammered in 2008. FII outflows drove broad market declines regardless of company fundamentals. If you can't stomach losing three-quarters of your portfolio value in a downturn, this strategy requires position sizing well below 100%.
Leverage dominance may not persist. India's banking sector has undergone significant cleanup since 2018 (IBC framework, NBFC regulation). Credit availability for leveraged expansion is tighter now. The leverage premium from 2000-2018 may narrow going forward.
Currency risk for international investors. All returns are in INR. The Indian rupee depreciated from roughly 45/USD in 2000 to 85/USD in 2025. International investors would see lower USD-adjusted returns. The 9.10% INR CAGR translates to approximately 6-7% in USD terms after currency adjustment.
Financials and utilities excluded. Banks, NBFCs, and utilities are structurally leveraged. Including them would inflate the leverage-driven bucket without adding meaningful signal about DuPont quality.
Takeaway
India's growth economy rewards leverage over margins by a wide margin. That's the core finding from 25 years of DuPont decomposition on NSE stocks. Leverage-driven ROE beat margin-driven ROE by 10 percentage points per year, the widest gap of any market we tested. Margin-driven stocks returned just 1.85% annually.
Quality ROE returned 9.56% CAGR, but the Sensex returned 11.49%. The strategy produced positive absolute returns but didn't beat the local index. Passive exposure to NSE outperformed.
For Indian stock screening: the DuPont decomposition is a diagnostic tool, not a clear alpha signal vs a broad index. It identifies whether ROE comes from margins or leverage. In India, leverage has driven the growth cycle. Margin-driven companies (IT services, pharma) were overpriced for their returns. The drawdowns are severe regardless of which path you take.
Part of a Series
- DuPont ROE: US Stocks -- flagship backtest, 22 years of US data
References
- Soliman, M.T. (2008). "The Use of DuPont Analysis by Market Participants." The Accounting Review, 83(3), 823-853.
- Fairfield, P.M. and Yohn, T.L. (2001). "Using Asset Turnover and Profit Margin to Forecast Changes in Profitability." Review of Accounting Studies, 6(4), 371-385.
Data: Ceta Research (FMP financial data warehouse), 2000-2025.
Past performance does not guarantee future results. This is educational content, not investment advice.


