
DuPont ROE on UK Stocks: +5.30% Over FTSE 100, Leverage Leads at 7.70% CAGR
DuPont ROE decomposition on LSE from 2000-2025. Leverage-driven ROE at 7.00% CAGR beat margin-driven at 4.30%. The UK reverses the US pattern: commodity-heavy sectors and dividend culture reward productive leverage.


We ran the same DuPont decomposition on London Stock Exchange companies that we ran on US stocks. The result: every DuPont track beat the FTSE 100. The FTSE 100 returned just 1.15% CAGR over 25 years. Quality ROE returned 6.45%. Leverage-driven hit 7.70%. Even the weakest track, margin-driven at 5.53%, beat the benchmark by +4.38%.
Contents
- Method
- What is DuPont Analysis?
- The Screen
- What We Found
- Every DuPont track beats FTSE 100. Leverage-driven leads at 7.70% CAGR.
- Why leverage works in the UK
- Annual returns
- Backtest Methodology
- Limitations
- Takeaway
- Part of a Series
- References
That FTSE 100 context matters. The UK has one of the developed world's worst large-cap equity records over this period. DuPont quality screening delivered meaningful alpha, not by generating exceptional absolute returns, but by clearing a low bar that the passive alternative couldn't.
For the full DuPont methodology, decomposition logic, and US results, see our US DuPont ROE analysis.
Data: FMP financial data warehouse, 2000–2025. Updated March 2026.
Method
| Parameter | Value |
|---|---|
| Universe | LSE (London Stock Exchange), market cap > GBP 500M (~$635M) |
| Exclusions | Financials, utilities |
| Period | 2000-2025 (25 years) |
| Rebalancing | Annual (April, 45-day filing lag) |
| Holding period | 12 months |
| Portfolio size | Equal weight, top 30 per group |
| Transaction costs | 0.15% per trade |
| Benchmark | FTSE 100 (GBP total return) |
| Data source | Ceta Research (FMP financial data warehouse) |
We computed DuPont components from raw annual financial statements: net profit margin, asset turnover, and equity multiplier. Stocks with ROE above 15% were sorted into margin-driven (top quartile net margin) or leverage-driven (top quartile equity multiplier). The quality ROE portfolio requires both decent margins (above 8%) and controlled leverage (equity multiplier below 3.0).
What is DuPont Analysis?
ROE measures how much profit a company earns per dollar of shareholder equity. Two companies can both report 20% ROE through entirely different mechanisms. One earns it from high margins on a capital-light business. The other earns it by stacking debt and amplifying thin margins.
DuPont splits ROE into three components:
ROE = Net Profit Margin x Asset Turnover x Equity Multiplier
- Net Profit Margin (Net Income / Revenue): Profitability per unit of revenue. High margins usually indicate pricing power, brand strength, or cost efficiency.
- Asset Turnover (Revenue / Total Assets): Revenue generation per unit of assets. Asset-light businesses score higher.
- Equity Multiplier (Total Assets / Shareholders' Equity): Financial leverage. A multiplier of 2.0 means half the balance sheet is debt-funded. At 4.0, it's 75% debt.
In the US, margin-driven ROE consistently outperforms. The UK tells a different story. And the FTSE 100's 1.15% CAGR over 25 years means the bar for beating the benchmark is unusually low.
The Screen
-- DuPont Quality Screen: UK (LSE)
-- Margin-driven ROE stocks
SELECT
    k.symbol,
    p.companyName,
    p.sector,
    k.returnOnEquityTTM * 100 AS roe_pct,
    f.netProfitMarginTTM * 100 AS net_margin_pct,
    f.assetTurnoverTTM,
    (1 + f.debtToEquityRatioTTM) AS equity_multiplier,
    k.marketCap / 1e9 AS market_cap_b_gbp
FROM key_metrics_ttm k
JOIN financial_ratios_ttm f ON k.symbol = f.symbol
JOIN profile p ON k.symbol = p.symbol
WHERE k.returnOnEquityTTM > 0.15
  AND (1 + f.debtToEquityRatioTTM) < 3.0
  AND f.netProfitMarginTTM > 0.08
  AND k.marketCap > 500000000
  AND p.exchange = 'LSE'
  AND p.sector NOT IN ('Financial Services', 'Utilities')
  AND p.isActivelyTrading = true
ORDER BY f.netProfitMarginTTM DESC
LIMIT 30
This filters for ROE above 15%, controlled leverage (equity multiplier below 3.0), and net margin above 8%. Remove the leverage and margin constraints to get the broader "All ROE > 15%" universe.
What We Found
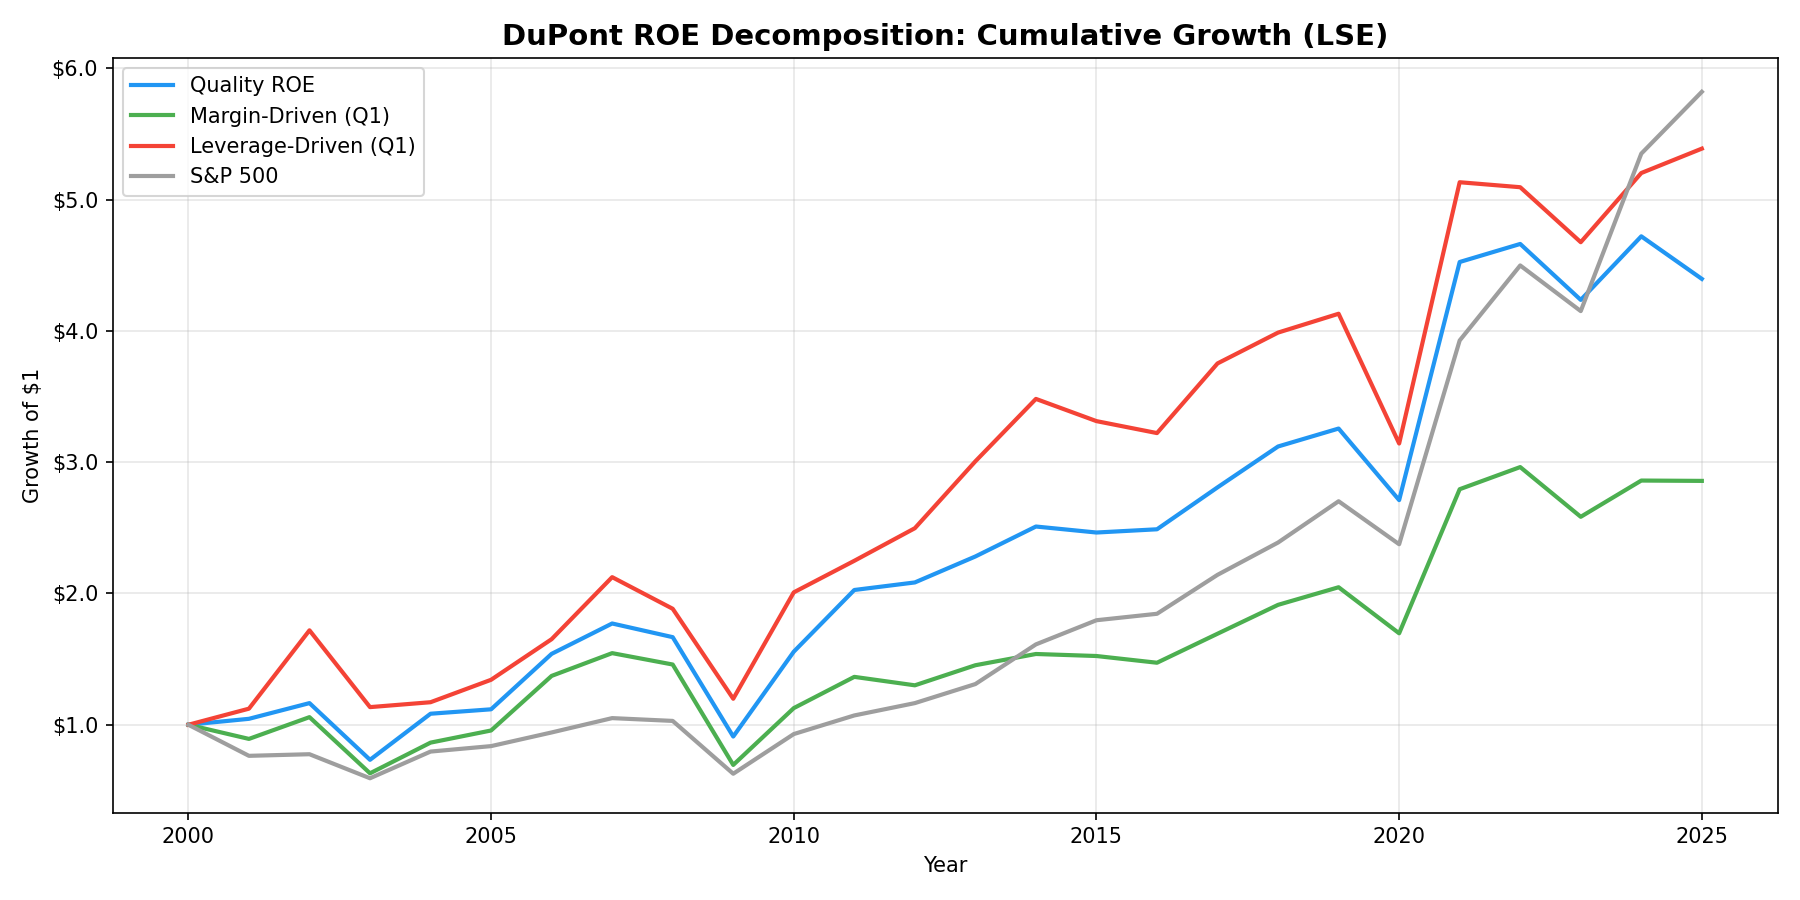
Every DuPont track beats FTSE 100. Leverage-driven leads at 7.70% CAGR.
| Portfolio | CAGR | vs FTSE 100 |
|---|---|---|
| Leverage-Driven ROE > 15% | 7.70% | +6.55% |
| All ROE > 15% | 7.62% | +6.47% |
| Quality ROE (combined) | 6.45% | +5.30% |
| Margin-Driven ROE > 15% | 5.53% | +4.38% |
| FTSE 100 | 1.15% | -- |
The margin-leverage spread is -2.2%. That's the opposite sign from the US (+5.3%). Leverage-driven stocks at 7.70% led the pack. The unfiltered "All ROE > 15%" bucket at 7.62% was close behind. Quality ROE at 6.45% beat FTSE 100 by +5.30% annually.
The FTSE 100 context is critical. A 1.15% CAGR over 25 years is one of the worst records among major developed market indices. UK passive equity investors largely went nowhere over this period. Every DuPont portfolio delivered substantially better outcomes.
Roughly 74 stocks qualified on average for the Quality ROE screen per period. That's a smaller universe than China (~186) or the US (~200), reflecting the LSE's concentration in large-cap companies.
Why leverage works in the UK
Three structural factors explain why the US pattern doesn't hold here:
Sector composition favors leverage. The LSE is heavy on mining, energy, consumer staples, and industrials. These sectors use leverage productively. A mining company borrowing to develop a copper deposit or an infrastructure firm financing long-term contracts isn't taking reckless risk. It's deploying capital in ways that suit the business model. The UK's high-ROE, high-leverage stocks tend to be established commodity and industrial companies, not speculative leveraged plays.
UK dividend culture supports leveraged returns. UK companies distribute a higher share of earnings as dividends than US companies. Leverage-driven ROE companies in the UK often carry significant dividend yields. That income component stabilizes total returns. A stock with 7% ROE and a 4% dividend yield can deliver reasonable total returns even if the price appreciation is modest.
Margin-driven companies are scarce. The UK has fewer high-margin technology and healthcare companies than the US. The margin-driven portfolio in the UK draws from a narrower pool. Consumer brands like Diageo and Unilever qualify, but there isn't the deep bench of high-margin tech (Microsoft, Apple, Visa) that drives the US result. A smaller pool means less diversification and more idiosyncratic risk.
Annual returns
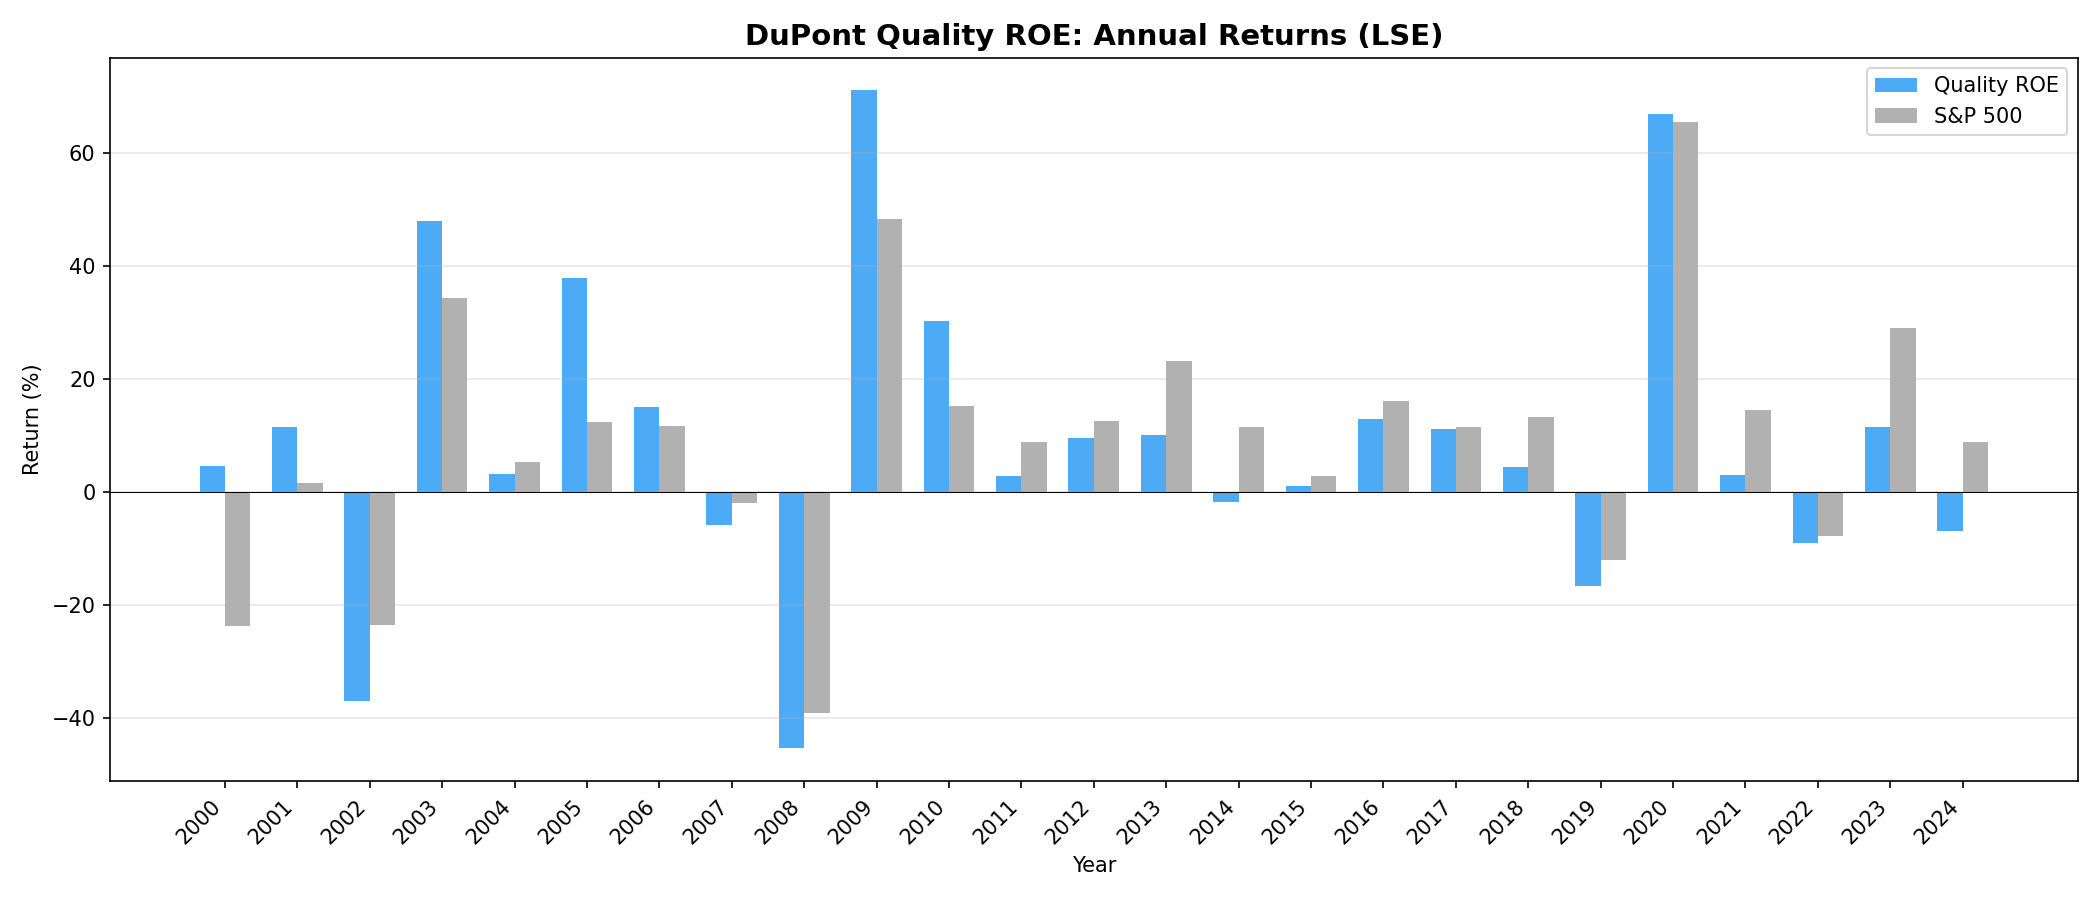
The leverage-driven portfolio's 7.70% CAGR came with a bumpier path than FTSE 100, but the starting bar was low enough that it didn't matter. UK large-cap leverage tends to be in mature businesses with real asset backing. The quality ROE portfolio at 6.45% was the steadier ride. The margin-driven portfolio at 5.53% underperformed the other DuPont tracks but still beat FTSE 100 by +4.38% annually.
Backtest Methodology
| Parameter | Choice |
|---|---|
| Universe | LSE, market cap > GBP 500M (~$635M), excl. financials/utilities |
| Signal | DuPont decomposition from annual FY data |
| Classification | Top quartile net margin within ROE > 15% = margin-driven. Top quartile equity multiplier within ROE > 15% = leverage-driven |
| Quality ROE | ROE > 15%, equity multiplier < 3.0, net margin > 8% |
| Rebalance | Annual (April, 45-day lag after fiscal year end) |
| Holding period | 12 months |
| Portfolio size | Equal weight, top 30 per group |
| Transaction costs | 0.15% per trade |
| Survivorship bias | Mitigated via point-in-time financial data |
| Look-ahead bias | 45-day lag on all fundamental data |
| Benchmark | FTSE 100 (GBP total return) |
| Avg stocks (Quality ROE) | ~74 per period |
Limitations
Small margin-driven universe. With roughly 74 qualifying stocks per period and even fewer in the margin-driven bucket, concentration risk is elevated. A few bad picks can drag down the portfolio in ways that wouldn't happen in a deeper market like the US.
Sector bias in leverage classification. Mining, energy, and industrial companies naturally carry higher leverage. Excluding financials and utilities removes the worst offenders, but the remaining leverage-driven stocks still skew heavily toward commodity-linked sectors. When commodity prices rise (2003-2007, 2020-2022), leverage-driven ROE gets a tailwind that has nothing to do with the DuPont framework.
UK-specific reporting conventions. UK companies report under IFRS, which treats certain lease obligations and pension liabilities differently than US GAAP. This can inflate the equity multiplier for UK companies relative to US peers, making cross-market comparisons of leverage levels less precise.
Currency effects. Returns are in GBP. The GBP/USD exchange rate moved substantially over the 25-year period. International investors see different absolute returns than domestic ones. The SPY benchmark is in USD, so the comparison carries an implicit currency dimension.
Negative equity exclusions. Companies with negative shareholders' equity (from buybacks or accumulated losses) were excluded. UK companies like those in the consumer staples sector occasionally hit negative equity from aggressive buyback programs.
Benchmark choice. We benchmark against the FTSE 100 for this analysis. Against the FTSE 250 (mid-cap), results would differ. The FTSE 100's poor 25-year record (1.15% CAGR) makes the excess returns look large. The absolute CAGR numbers tell a more sober story.
Takeaway
The UK is the clearest case in our series for DuPont quality beating passive equity exposure. The FTSE 100 returned 1.15% CAGR over 25 years. Every DuPont portfolio cleared that by a wide margin. Quality ROE delivered +5.30% excess return. Leverage-driven led at 7.70% CAGR, a +6.55% annual advantage.
The margin-leverage pattern also inverted relative to the US. Leverage-driven at 7.70% beat margin-driven at 5.53%, a -2.2% spread. That's structural. The LSE's sector mix (mining, energy, industrials, consumer staples) favors companies that use leverage productively. The UK's dividend culture provides income stability for leveraged companies. High-margin tech is scarce on the LSE.
For UK-focused investors, the practical takeaway is twofold. First, don't automatically penalize leverage in DuPont analysis here. In commodity-heavy markets with dividend cultures, leverage-driven ROE works. Second, the most important decision wasn't which DuPont track to pick. It was whether to screen at all. The passive alternative was essentially flat for 25 years.
Part of a Series
This analysis is part of our DuPont ROE global exchange comparison: - DuPont ROE on US Stocks -- 14.2% margin-driven CAGR, full methodology - DuPont ROE on Chinese Stocks -- +2.07% over SSE Composite, margin beats leverage - DuPont ROE on Taiwanese Stocks -- marginal +0.43% over TAIEX
References
- Soliman, M.T. (2008). "The Use of DuPont Analysis by Market Participants." The Accounting Review, 83(3), 823-853.
- Fairfield, P.M. and Yohn, T.L. (2001). "Using Asset Turnover and Profit Margin to Forecast Changes in Profitability." Review of Accounting Studies, 6(4), 371-385.
- Sheridan, T. and Wessels, R. (1988). "The Determinants of Capital Structure Choice." The Journal of Finance, 43(1), 1-19.
Data: Ceta Research (FMP financial data warehouse), 2000-2025. Annual April rebalance, equal weight top 30, 0.15% transaction costs. Past performance is not indicative of future results.
Past performance does not guarantee future results. This is educational content, not investment advice.


