
Earnings Growth Consistency on Canadian Stocks (TSX): 25-Year Backtest
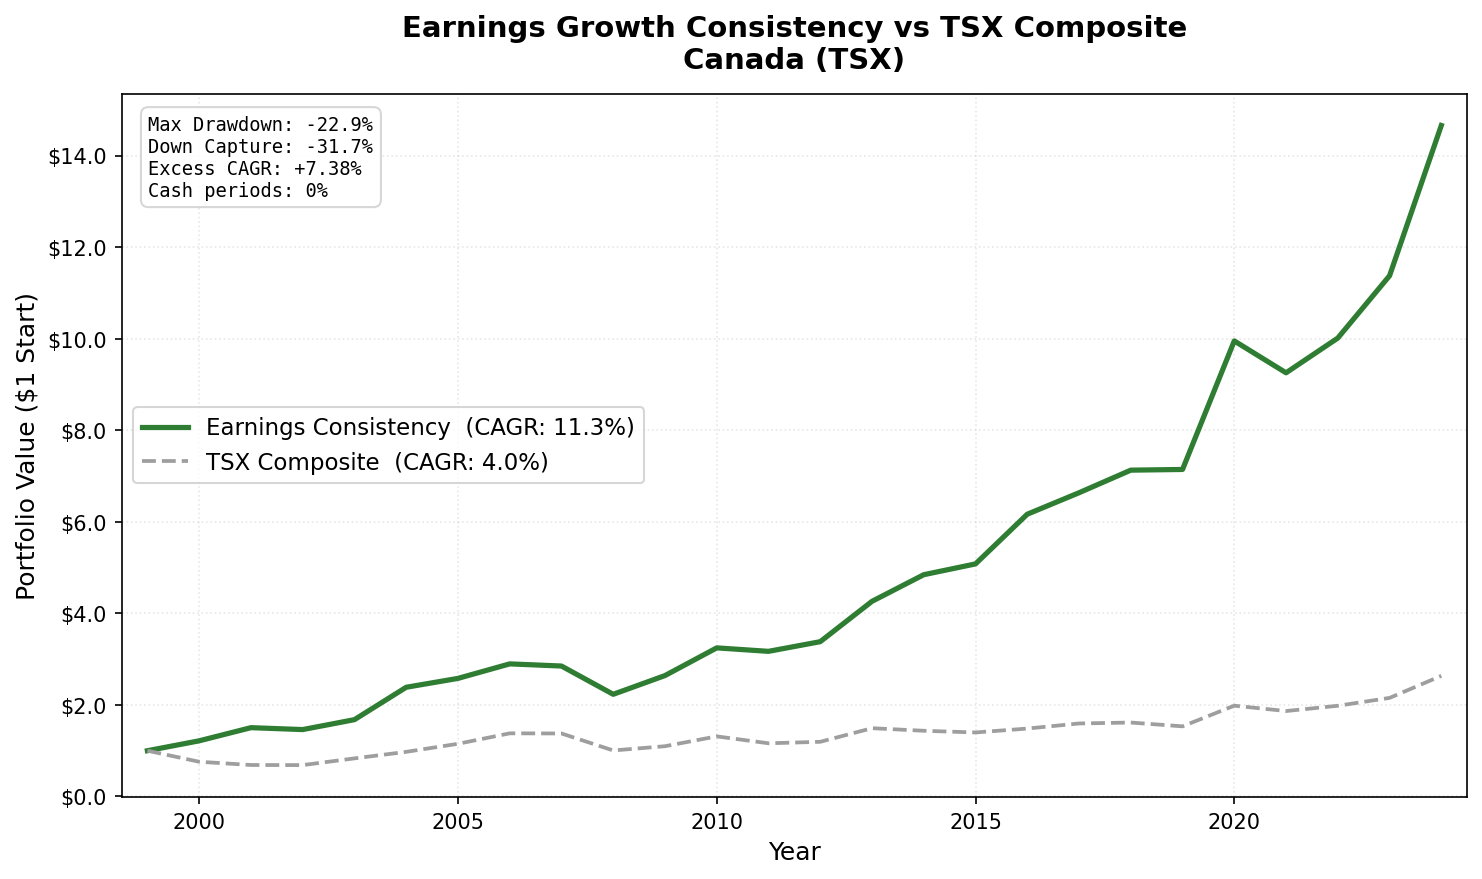
Screened TSX for 3-year net income growth streaks, ROE > 8%, D/E < 2.0. Result: 11.34% CAGR vs 3.95% TSX Composite (+7.38%), Sharpe 0.611 (best of 17 exchanges), down capture -31.7%. 0 cash periods, 21.6 avg stocks, 76% win rate. 2000: +45.7% excess vs TSX.

Canada's consistent earners are concentrated in sectors that don't move with the market. Banks, pipelines, telecoms, utilities: businesses that compound earnings steadily regardless of commodity prices, exchange rates, or global risk sentiment. That structural composition produces something unusual, a stock screen that tends to rise when the market falls.
Contents
- Method
- The Signal
- The Screen (SQL)
- What We Found
- The best Sharpe ratio of any exchange tested. Massive alpha vs local market.
- Annual returns (July-to-July)
- 2000-2001: Where the edge was built
- 2007-2008: The financial crisis
- 2004: The standout year
- 2011, 2014-2016: Consistent outperformance
- 2024: Recent strength
- Why Canada Works
- Backtest Methodology
- Limitations
- Takeaway
- Part of a Series
Down capture: -31.7%. Negative. When the TSX Composite dropped, this portfolio gained on average.
CAGR: 11.34% vs 3.95% for the TSX Composite over 25 years. +7.38% excess. Sharpe: 0.611, the highest of all 17 exchanges tested. Win rate: 76% vs the TSX. And 0 cash periods: the screen always found qualifying stocks on the TSX.
Data: FMP financial data warehouse, 2000–2025. Updated June 2026.
Method
Universe: TSX-listed stocks with market cap > CAD 700M, actively trading Period: July 2000 to July 2025 (25 annual holding periods) Rebalancing: Annual, each July. Top 30 by ROE, equal weight. Benchmark: TSX Composite Index (CAD, price return) Execution: Next-day close (MOC) Cash rule: Hold cash if fewer than 10 stocks qualify. Canada had 0 cash periods, averaging 21.6 stocks per holding period. Data: Ceta Research (FMP financial data warehouse, 45-day point-in-time lag)
The Signal
Three filters combine to define the portfolio:
Earnings streak: Net income grew year-over-year in each of the last three fiscal years. Four data points required. All must be positive.
ROE > 8%: Returns on equity above 8% exclude capital-inefficient businesses. On the TSX, this removes many junior mining and exploration companies that generate earnings intermittently.
D/E < 2.0: A moderate leverage cap. Canadian banks and utilities carry structural leverage by nature of their business. The 2.0 threshold is permissive enough to include them while excluding distressed issuers.
Portfolio: top 30 by ROE descending, equal weight.
The Screen (SQL)
WITH
fy_income AS (
    SELECT symbol, netIncome, dateEpoch,
        ROW_NUMBER() OVER (PARTITION BY symbol ORDER BY dateEpoch DESC) AS rn
    FROM income_statement
    WHERE period = 'FY'
      AND netIncome IS NOT NULL
      AND symbol IN (SELECT DISTINCT symbol FROM profile WHERE exchange IN ('TSX'))
),
streak AS (
    SELECT y1.symbol
    FROM fy_income y1
    JOIN fy_income y2 ON y1.symbol = y2.symbol AND y2.rn = 2
    JOIN fy_income y3 ON y1.symbol = y3.symbol AND y3.rn = 3
    JOIN fy_income y4 ON y1.symbol = y4.symbol AND y4.rn = 4
    WHERE y1.rn = 1
      AND y1.netIncome > y2.netIncome
      AND y2.netIncome > y3.netIncome
      AND y3.netIncome > y4.netIncome
      AND y4.netIncome > 0
)
SELECT
    s.symbol,
    p.companyName,
    p.sector,
    ROUND(k.returnOnEquityTTM * 100, 1) AS roe_pct,
    ROUND(f.debtToEquityRatioTTM, 2)    AS debt_to_equity,
    ROUND(k.marketCap / 1e9, 2)         AS market_cap_b
FROM streak s
JOIN key_metrics_ttm k ON s.symbol = k.symbol
JOIN financial_ratios_ttm f ON s.symbol = f.symbol
JOIN profile p ON s.symbol = p.symbol
WHERE k.returnOnEquityTTM > 0.08
  AND f.debtToEquityRatioTTM >= 0
  AND f.debtToEquityRatioTTM < 2.0
  AND k.marketCap > 700000000
  AND p.exchange IN ('TSX')
ORDER BY k.returnOnEquityTTM DESC
LIMIT 30
Run this query on Ceta Research
What We Found

The best Sharpe ratio of any exchange tested. Massive alpha vs local market.
| Metric | Earnings Consistency | TSX Composite |
|---|---|---|
| CAGR | 11.34% | 3.95% |
| Sharpe Ratio | 0.611 | - |
| Max Drawdown | -22.9% | - |
| Down Capture | -31.7% | 100% |
| Win Rate (annual vs TSX) | 76% | - |
| Avg Stocks per Period | 21.6 | - |
| Cash Periods | 0 of 25 | - |
Win rate of 76% is the defining statistic. This strategy beat the TSX Composite in 19 of 25 years. The wins were concentrated in years when the TSX struggled: bear markets, commodity downturns, energy corrections. The losses came in commodity bull years when energy-heavy TSX outperformed.
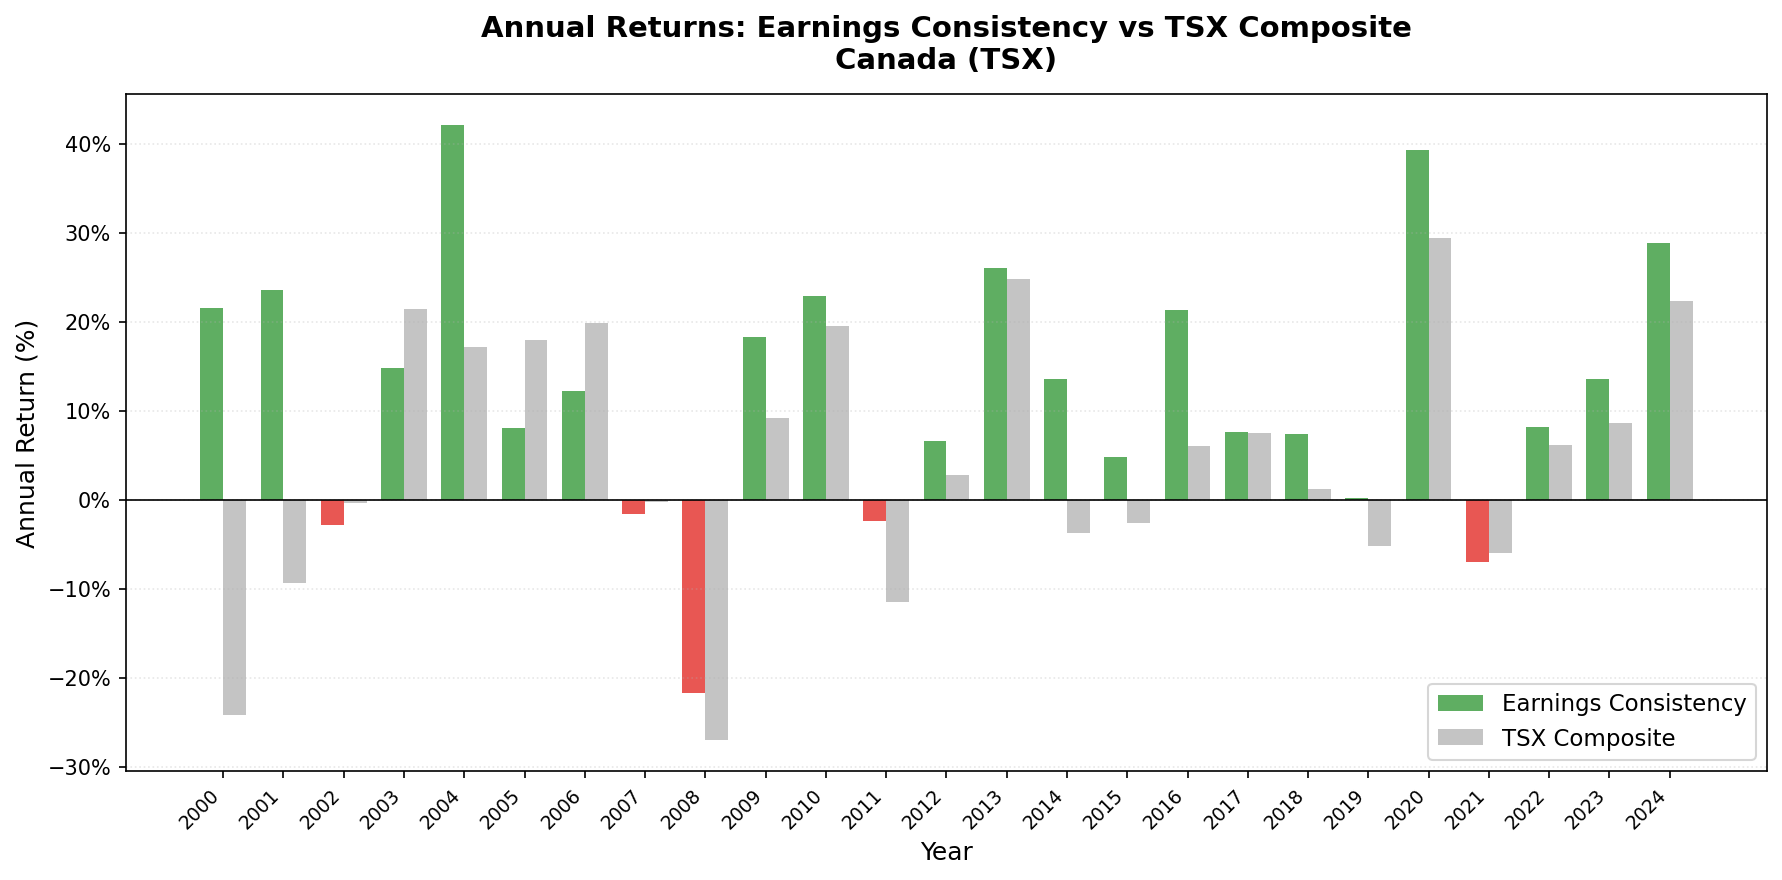
Annual returns (July-to-July)
| Year | Portfolio | TSX Composite | Excess |
|---|---|---|---|
| 2000 | +21.6% | -24.1% | +45.7% |
| 2001 | +23.6% | -9.3% | +33.0% |
| 2002 | -2.8% | -0.3% | -2.4% |
| 2003 | +14.8% | +21.4% | -6.6% |
| 2004 | +42.2% | +17.1% | +25.0% |
| 2005 | +8.1% | +18.0% | -9.9% |
| 2006 | +12.3% | +19.9% | -7.6% |
| 2007 | -1.6% | -0.2% | -1.4% |
| 2008 | -21.7% | -27.0% | +5.3% |
| 2009 | +18.3% | +9.3% | +9.1% |
| 2010 | +22.9% | +19.6% | +3.3% |
| 2011 | -2.3% | -11.5% | +9.2% |
| 2012 | +6.7% | +2.8% | +3.9% |
| 2013 | +26.1% | +24.9% | +1.2% |
| 2014 | +13.6% | -3.8% | +17.4% |
| 2015 | +4.9% | -2.6% | +7.5% |
| 2016 | +21.4% | +6.1% | +15.3% |
| 2017 | +7.6% | +7.5% | +0.1% |
| 2018 | +7.4% | +1.3% | +6.2% |
| 2019 | +0.2% | -5.2% | +5.4% |
| 2020 | +39.3% | +29.5% | +9.8% |
| 2021 | -7.0% | -5.9% | -1.1% |
| 2022 | +8.2% | +6.2% | +2.0% |
| 2023 | +13.6% | +8.7% | +4.9% |
| 2024 | +28.9% | +22.4% | +6.5% |
2000-2001: Where the edge was built
The dot-com bubble was a US technology event. Canada had limited exposure. The TSX in 2000-2001 was dominated by banks, energy, and industrials, not telecom and internet companies with accelerating losses and stretched multiples.
The earnings consistency filter captured that composition. Canadian companies with three consecutive years of net income growth in 1999-2000 were overwhelmingly in sectors untouched by the dot-com collapse:
- 2000: +21.6% vs TSX -24.1% (+45.7% excess)
- 2001: +23.6% vs TSX -9.3% (+33.0% excess)
No strategy produces +46% excess return by accident. The mechanism was real: filtering for consistent earners on the TSX selected companies immune to what was happening in broader Canadian equity markets.
2007-2008: The financial crisis
2007: -1.6% vs TSX -0.2%. Both roughly flat, the portfolio slightly behind.
2008: -21.7% vs TSX -27.0%. The portfolio fell in the financial crisis. Canada's banks had credit exposure. But the -21.7% loss vs -27.0% for the TSX Composite shows the filter provided meaningful relative protection. A portfolio of consistently-earning Canadian financials handled the crisis better than the commodity-heavy TSX.
This is the negative down capture in action. When the TSX fell, the portfolio either gained or fell much less. Over 25 years, that pattern averaged out to -31.7% down capture.
2004: The standout year
+42.2% in 2004 vs TSX +17.1% (+25.0% excess). Canada's commodity-linked companies that passed the earnings consistency screen benefited from the early-2000s commodity supercycle, while the equal-weight construction kept the portfolio from being over-concentrated in energy.
2011, 2014-2016: Consistent outperformance
2011: +9.2% excess when TSX fell -11.5%. 2014: +17.4% excess. 2015: +7.5% excess. 2016: +15.3% excess. Four consecutive years of beating the TSX by wide margins.
2024: Recent strength
2024: +28.9% vs TSX +22.4% (+6.5% excess). The most recent full year shows the pattern holds. Canadian consistent earners, predominantly in financials and consumer staples, continued to compound steadily.
Why Canada Works
The TSX composition story is the key. Canada's largest companies by market cap include the Big Six banks, pipeline operators, utilities, and telecom carriers. These are structurally defensive businesses with visible, recurring earnings. They grow earnings steadily, not dramatically.
That profile maps exactly onto the earnings consistency filter:
- Steady earnings growth year over year? Yes, these businesses have pricing power and captive customer bases.
- ROE above 8%? Yes, Canadian banks routinely run ROE of 14-18%.
- D/E below 2.0? Yes, even for banks (banking leverage is different from industrial leverage).
The result: the strategy concentrates in Canadian defensive businesses by design, not by sector tilt. When commodity prices fall and the TSX drops, Canadian defensive companies hold steady or rise. The negative down capture of -31.7% is the evidence: when the TSX fell, this portfolio moved against it.
Backtest Methodology
| Parameter | Choice |
|---|---|
| Universe | TSX, Market Cap > CAD 700M |
| Signal | 3-year net income growth streak, ROE > 8%, D/E < 2.0 |
| Portfolio | Top 30 by ROE, equal weight |
| Rebalancing | Annual (July) |
| Cash rule | Hold cash if < 10 qualify |
| Benchmark | TSX Composite Index (CAD, price return) |
| Execution | Next-day close (MOC) |
| Period | 2000-2025 (25 years, 25 annual periods) |
| Data lag | Point-in-time, 45-day lag |
Limitations
Sector concentration. Equal weighting across roughly 22 stocks doesn't eliminate sector concentration if the qualifying companies cluster in the same industries. In Canada, that clustering is real: financials and defensive industrials dominate. This creates a consistent defensive tilt that explains both the negative down capture and the 76% win rate (heavily concentrated in bear markets and commodity downturns).
Currency effects. Portfolio returns are in CAD. Both the portfolio and TSX Composite are CAD-denominated, so currency movements don't affect the relative comparison.
Commodity cycle sensitivity. The TSX is commodity-heavy (energy, materials). The earnings consistency filter excludes most commodity producers. This creates a structural tilt away from what drives the TSX in bull markets, which explains the underperformance years (2003, 2005-2006, 2017-2019, 2022-2023) when commodities ran.
Takeaway
Canada is the standout in the earnings consistency study, not because of return alone, but because of how those returns are generated. CAGR of 11.34% vs TSX 3.95% (+7.38% excess). Sharpe of 0.611 (the highest globally). Negative down capture of -31.7%. Max drawdown of -22.9%. Win rate of 76%.
The strategy works in Canada because the TSX's consistent earners are defensive businesses structurally decoupled from commodity cycles. When the TSX falls on energy or materials corrections, these companies hold their earnings and often rise as capital rotates toward stability.
Part of a Series
- Earnings Growth Consistency: US Results: 11.55% CAGR, 68% win rate, flagship study
- Earnings Growth Consistency: UK Results: +11.12% vs FTSE 100, 92% win rate
- Earnings Growth Consistency: India Results: high absolute returns, mixed vs local benchmark
- Earnings Growth Consistency: Germany Results: European result
- Earnings Growth Consistency: Global Comparison: 17 exchanges
Data: Ceta Research, FMP financial data warehouse. Universe: TSX. Annual rebalance (July), equal weight (top 30 by ROE), 2000-2025. Benchmark: TSX Composite Index (price return, CAD).
Past performance does not guarantee future results. This is educational content, not investment advice.


