
Earnings Growth Consistency on German Stocks (XETRA): 25-Year Backtest
Screened XETRA for 3-year net income growth streaks, ROE > 8%, D/E < 2.0. Result: 8.59% CAGR vs 5.04% DAX (+3.55%), Sharpe 0.423, 64% win rate, 0 cash periods. Signal works vs the local benchmark; absolute returns lower than Anglo-Saxon markets.

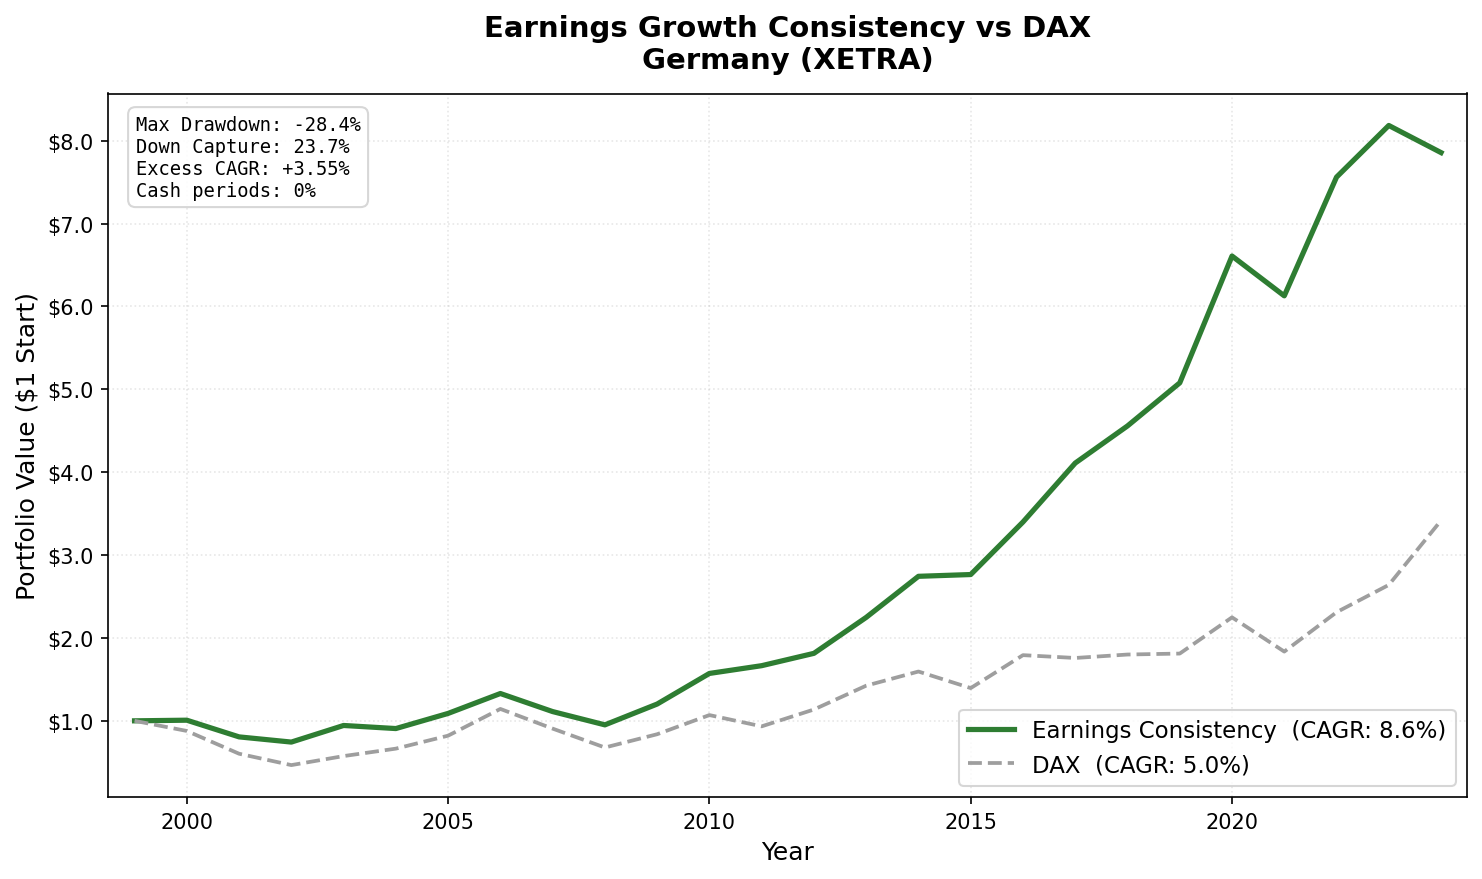
Germany produces solid alpha against the local benchmark: CAGR of 8.59% vs 5.04% for the DAX. +3.55% per year excess. 0 cash periods. 17.3 stocks on average. Win rate of 64% against the DAX.
Contents
- Method
- The Signal
- The Screen (SQL)
- What We Found
- Positive alpha vs the local market. The signal works.
- Annual returns (July-to-July)
- 2001-2002: Early losses, but relative protection
- 2011 and 2017: The stand-out years
- 2014: Mid-cycle strength
- 2024: The worst year in the study
- Why Germany Outperforms the DAX But Trails Anglo-Saxon Markets
- Backtest Methodology
- Limitations
- Takeaway
- Part of a Series
Compared to Anglo-Saxon markets, the absolute return is lower and the drawdowns are deeper. But the signal works clearly when measured against what German investors actually have access to: the domestic market. Germany is the European data point in this study, and it's a genuine positive result.
Understanding why Germany underperforms relative to Anglo-Saxon markets is as useful as understanding why it beats the local baseline.
Data: FMP financial data warehouse, 2000–2025. Updated June 2026.
Method
Universe: XETRA-listed stocks with market cap > €500M, actively trading Period: July 2000 to July 2025 (25 annual holding periods) Rebalancing: Annual, each July. Top 30 by ROE, equal weight. Benchmark: DAX Performance Index (total return, EUR) Execution: Next-day close (MOC) Cash rule: Hold cash if fewer than 10 stocks qualify. Data: Ceta Research (FMP financial data warehouse, 45-day point-in-time lag)
The Signal
Earnings streak: Net income grew year-over-year in each of the last three fiscal years. Four data points required. All must be positive.
ROE > 8%: Germany has many capital-intensive industrial companies with structurally lower returns on equity. This filter removes the low-efficiency industrial base while retaining higher-quality manufacturers and services businesses.
D/E < 2.0: Moderate leverage cap. German companies, particularly automotive and industrial, often carry meaningful debt. The 2.0 threshold accommodates manageable leverage while excluding distressed cases.
Portfolio: top 30 by ROE descending, equal weight.
The Screen (SQL)
WITH
fy_income AS (
    SELECT symbol, netIncome, dateEpoch,
        ROW_NUMBER() OVER (PARTITION BY symbol ORDER BY dateEpoch DESC) AS rn
    FROM income_statement
    WHERE period = 'FY'
      AND netIncome IS NOT NULL
      AND symbol IN (SELECT DISTINCT symbol FROM profile WHERE exchange IN ('XETRA'))
),
streak AS (
    SELECT y1.symbol
    FROM fy_income y1
    JOIN fy_income y2 ON y1.symbol = y2.symbol AND y2.rn = 2
    JOIN fy_income y3 ON y1.symbol = y3.symbol AND y3.rn = 3
    JOIN fy_income y4 ON y1.symbol = y4.symbol AND y4.rn = 4
    WHERE y1.rn = 1
      AND y1.netIncome > y2.netIncome
      AND y2.netIncome > y3.netIncome
      AND y3.netIncome > y4.netIncome
      AND y4.netIncome > 0
)
SELECT
    s.symbol,
    p.companyName,
    p.sector,
    ROUND(k.returnOnEquityTTM * 100, 1) AS roe_pct,
    ROUND(f.debtToEquityRatioTTM, 2)    AS debt_to_equity,
    ROUND(k.marketCap / 1e9, 2)         AS market_cap_b
FROM streak s
JOIN key_metrics_ttm k ON s.symbol = k.symbol
JOIN financial_ratios_ttm f ON s.symbol = f.symbol
JOIN profile p ON s.symbol = p.symbol
WHERE k.returnOnEquityTTM > 0.08
  AND f.debtToEquityRatioTTM >= 0
  AND f.debtToEquityRatioTTM < 2.0
  AND k.marketCap > 500000000
  AND p.exchange IN ('XETRA')
ORDER BY k.returnOnEquityTTM DESC
LIMIT 30
Run this query on Ceta Research
What We Found

Positive alpha vs the local market. The signal works.
| Metric | Earnings Consistency | DAX |
|---|---|---|
| CAGR | 8.59% | 5.04% |
| Sharpe Ratio | 0.423 | - |
| Max Drawdown | -28.4% | - |
| Down Capture | 23.7% | 100% |
| Win Rate (annual vs DAX) | 64% | - |
| Avg Stocks per Period | 17.3 | - |
| Cash Periods | 0 of 25 | - |
The max drawdown of -28.4% is meaningful, Germany's market saw deep drawdowns in 2001-2002 and 2008. But the down capture of 23.7% vs the DAX shows the portfolio absorbed far less of those losses than the broad German market. Germany doesn't offer the drawdown protection seen in Canada or the UK, but it delivers genuine risk-adjusted outperformance against the local benchmark.
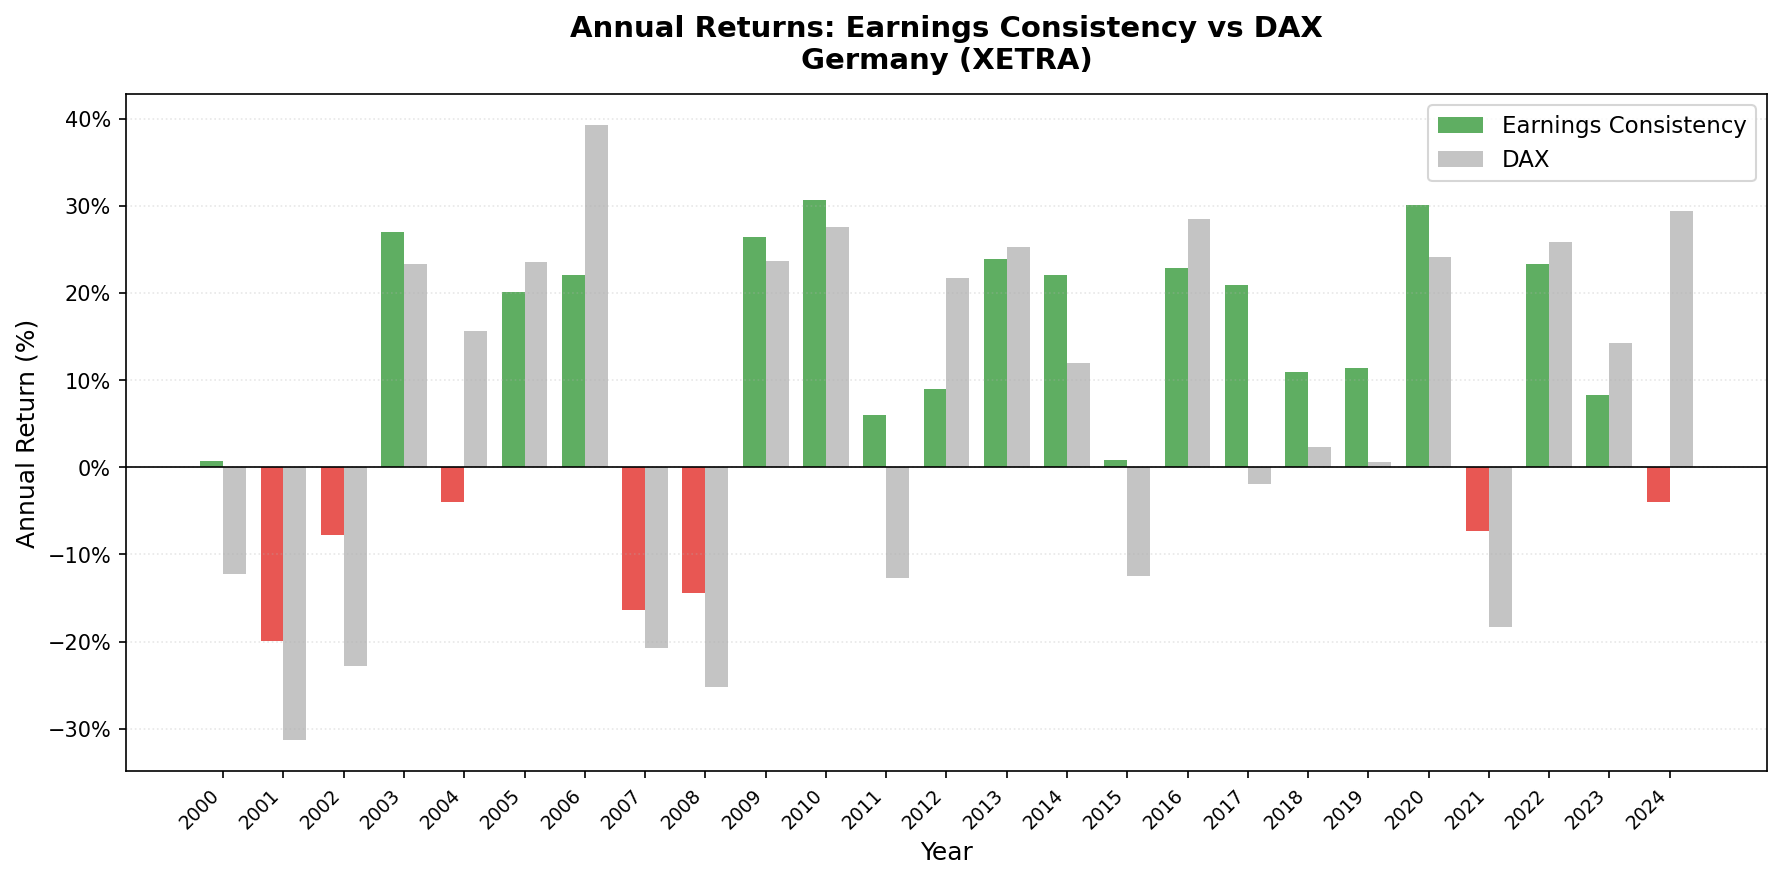
Annual returns (July-to-July)
| Year | Portfolio | DAX | Excess |
|---|---|---|---|
| 2000 | +0.8% | -12.2% | +13.0% |
| 2001 | -20.0% | -31.3% | +11.3% |
| 2002 | -7.8% | -22.8% | +15.0% |
| 2003 | +26.9% | +23.4% | +3.6% |
| 2004 | -3.9% | +15.6% | -19.6% |
| 2005 | +20.1% | +23.6% | -3.4% |
| 2006 | +22.0% | +39.3% | -17.3% |
| 2007 | -16.4% | -20.8% | +4.4% |
| 2008 | -14.4% | -25.2% | +10.8% |
| 2009 | +26.4% | +23.6% | +2.8% |
| 2010 | +30.7% | +27.6% | +3.1% |
| 2011 | +6.0% | -12.7% | +18.7% |
| 2012 | +8.9% | +21.8% | -12.8% |
| 2013 | +23.9% | +25.3% | -1.4% |
| 2014 | +22.0% | +12.0% | +10.1% |
| 2015 | +0.8% | -12.5% | +13.3% |
| 2016 | +22.9% | +28.5% | -5.6% |
| 2017 | +20.9% | -1.9% | +22.8% |
| 2018 | +10.9% | +2.4% | +8.5% |
| 2019 | +11.4% | +0.7% | +10.8% |
| 2020 | +30.1% | +24.1% | +6.0% |
| 2021 | -7.3% | -18.4% | +11.1% |
| 2022 | +23.4% | +25.9% | -2.5% |
| 2023 | +8.2% | +14.3% | -6.0% |
| 2024 | -4.0% | +29.5% | -33.5% |
2001-2002: Early losses, but relative protection
-20.0% in 2001. The dot-com and telecom collapse hit Germany hard. German equity markets had heavy telecom exposure (Deutsche Telekom was one of the largest XETRA stocks). But vs the DAX, which fell -31.3%, the portfolio held up far better, +11.3% excess. The screen held companies that had grown earnings through the tech boom, and they weathered the collapse better than the broad index.
2002 extended the story: portfolio -7.8% vs DAX -22.8% (+15.0% excess). As the post-bubble correction deepened, earnings-consistent German companies proved significantly more resilient than the broad market.
2011 and 2017: The stand-out years
2011: portfolio +6.0% vs DAX -12.7% (+18.7% excess). 2017: portfolio +20.9% vs DAX -1.9% (+22.8% excess). These two years show the signal at its best in Germany. In 2011, the European debt crisis hit the DAX hard; consistent earners proved defensively positioned. In 2017, German exporters struggled while quality domestic businesses continued compounding.
2014: Mid-cycle strength
+22.0% in 2014 vs DAX +12.0% (+10.1% excess). Germany's mid-cycle recovery from the European debt crisis benefited precisely the kind of companies the earnings consistency filter selects: Mittelstand industrials and specialty manufacturers with demonstrated earnings growth and moderate leverage. 2013 was the exception in this stretch, roughly tracking the DAX (+23.9% vs +25.3%, a -1.4% miss).
2024: The worst year in the study
-4.0% vs DAX +29.5%, a -33.5% miss. This is the single worst year in the 25-year German backtest. The DAX surged on a combination of AI optimism, European reflation trades, and post-energy-crisis industrial recovery. Earnings-consistent German companies, which tend toward steady but not high-growth businesses, missed the rally entirely.
This is the strategy's fundamental risk in Germany: it selects quality earners, not growth momentum. When the market rewards catch-up growth, beaten-down cyclicals recovering or AI beneficiaries rerating, the consistent-earner portfolio is structurally excluded.
Why Germany Outperforms the DAX But Trails Anglo-Saxon Markets
The +3.55% excess return vs DAX is real, but the absolute CAGR of 8.59% trails the US (11.55%), UK (12.35%), and Canada (11.34%). The gap has a structural explanation.
Germany's economy concentrates in global cyclicals: automotive, chemicals, industrial machinery, capital goods. These sectors have episodic earnings growth. They compound well during global expansion and compress sharply during contractions. Consistent three-year growth streaks are less common in cyclical industrials than in defensive services or consumer businesses.
In the US, consistent earners include technology companies that grew earnings regardless of cycle. In Canada, they include banks and telecoms. In Germany, the consistent earner universe is smaller and more volatile in sector composition.
The DAX itself has been a weak benchmark in price terms because of Germany's economic challenges over the period. The strategy beats it clearly, but the underlying economy constrains what's achievable in absolute terms.
Backtest Methodology
| Parameter | Choice |
|---|---|
| Universe | XETRA, Market Cap > €500M |
| Signal | 3-year net income growth streak, ROE > 8%, D/E < 2.0 |
| Portfolio | Top 30 by ROE, equal weight |
| Rebalancing | Annual (July) |
| Cash rule | Hold cash if < 10 qualify |
| Benchmark | DAX Performance Index (total return, EUR) |
| Execution | Next-day close (MOC) |
| Period | 2000-2025 (25 years, 25 annual periods) |
| Data lag | Point-in-time, 45-day lag |
Limitations
Cyclical sector risk. The XETRA universe is dominated by cyclical industrials. The earnings consistency filter reduces cyclical exposure but doesn't eliminate it. In downturns that hit German manufacturing (2001-2002, 2008, 2024) the strategy absorbs losses. The 2024 miss (-33.5% vs DAX) shows the risk acutely.
Small eligible universe. Averaging 17.3 qualifying stocks is on the low end. The filter is working with a narrower passing universe than the US (27.0 stocks) or India (23.4 stocks). Concentrated equal-weight portfolios in small universes have more idiosyncratic risk.
Currency effects. Returns are in EUR. Both the portfolio and the DAX benchmark are EUR-denominated, so currency movements don't affect the relative comparison.
Takeaway
Germany shows the signal working against the local benchmark: +3.55% excess return per year, 64% win rate, 0% cash periods, 23.7% down capture vs DAX. The absolute CAGR of 8.59% is lower than the Anglo-Saxon markets, reflecting Germany's economic structure, more cyclical, more export-dependent, more vulnerable to manufacturing recessions.
For investors with Germany exposure, the earnings consistency filter clearly improves risk-adjusted returns over the full cycle. It doesn't eliminate Germany's cyclical risk, 2024's -33.5% miss is evidence of that. But 64% of years it beats the DAX, and across 25 years it compounds at 8.59% vs the DAX's 5.04%.
Part of a Series
- Earnings Growth Consistency: US Results: 11.55% CAGR, flagship study
- Earnings Growth Consistency: Canada Results: best Sharpe globally
- Earnings Growth Consistency: UK Results: +11.12% vs FTSE 100, highest win rate
- Earnings Growth Consistency: India Results: high absolute returns, mixed vs local benchmark
- Earnings Growth Consistency: Global Comparison: 17 exchanges
Data: Ceta Research, FMP financial data warehouse. Universe: XETRA. Annual rebalance (July), equal weight (top 30 by ROE), 2000-2025. Benchmark: DAX Performance Index (total return, EUR).
Past performance does not guarantee future results. This is educational content, not investment advice.


